

1. Executive Summary
1.1. Global Urea Market Snapshot 2025 and 2032
1.2. Market Opportunity Assessment, 2025-2032, US$ Bn
1.3. Key Market Trends
1.4. Industry Developments and Key Market Events
1.5. Demand Side and Supply Side Analysis
1.6. PMR Analysis and Recommendations
2. Market Overview
2.1. Market Scope and Definitions
2.2. Value Chain Analysis
2.3. Macro-Economic Factors
2.3.1. Global GDP Outlook
2.3.2. Global Agriculture Industry Overview
2.3.3. Global Animal Feed Industry Overview
2.3.4. Global Chemical Industry Overview
2.3.5. Global Nitrogen Fertilizers Market Overview
2.4. Forecast Factors – Relevance and Impact
2.5. COVID-19 Impact Assessment
2.6. PESTLE Analysis
2.7. Porter's Five Forces Analysis
2.8. Geopolitical Tensions: Market Impact
2.9. Regulatory and Technology Landscape
3. Market Dynamics
3.1. Drivers
3.2. Restraints
3.3. Opportunities
3.4. Trends
4. Price Trend Analysis, 2019 – 2032
4.1. Region-wise Price Analysis
4.2. Price by Segments
4.3. Price Impact Factors
5. Global Urea Market Outlook:
5.1. Key Highlights
5.2. Global Urea Market Outlook: Grade
5.2.1. Introduction/Key Findings
5.2.2. Historical Market Size (US$ Bn) and Volume (Kilo Tons) Analysis by Grade, 2019-2023
5.2.3. Current Market Size (US$ Bn) and Volume (Kilo Tons) Analysis and Forecast, by Grade, 2025-2032
5.2.3.1. Fertilizer
5.2.3.2. Feed
5.2.3.3. Industrial
5.2.4. Market Attractiveness Analysis: Grade
5.3. Global Urea Market Outlook: Application
5.3.1. Introduction/Key Findings
5.3.2. Historical Market Size (US$ Bn) and Volume (Kilo Tons) Analysis by Application, 2019-2023
5.3.3. Current Market Size (US$ Bn) and Volume (Kilo Tons) Analysis and Forecast, by Application, 2025-2032
5.3.3.1. Agriculture
5.3.3.2. Animal Feed
5.3.3.3. Chemical Synthesis
5.3.4. Market Attractiveness Analysis: Application
6. Global Urea Market Outlook: Region
6.1. Key Highlights
6.2. Historical Market Size (US$ Bn) and Volume (Kilo Tons) Analysis by Region, 2019-2023
6.3. Current Market Size (US$ Bn) and Volume (Kilo Tons) Analysis and Forecast, by Region, 2025-2032
6.3.1. North America
6.3.2. Europe
6.3.3. East Asia
6.3.4. South Asia & Oceania
6.3.5. Latin America
6.3.6. Middle East & Africa
6.4. Market Attractiveness Analysis: Region
7. North America Urea Market Outlook:
7.1. Key Highlights
7.2. Pricing Analysis
7.3. North America Market Size (US$ Bn) and Volume (Kilo Tons) Analysis and Forecast, by Country, 2025-2032
7.3.1. U.S.
7.3.2. Canada
7.4. North America Market Size (US$ Bn) and Volume (Kilo Tons) Analysis and Forecast, by Grade, 2025-2032
7.4.1. Fertilizer
7.4.2. Feed
7.4.3. Industrial
7.5. North America Market Size (US$ Bn) and Volume (Kilo Tons) Analysis and Forecast, by Application, 2025-2032
7.5.1. Agriculture
7.5.2. Animal Feed
7.5.3. Chemical Synthesis
8. Europe Urea Market Outlook:
8.1. Key Highlights
8.2. Pricing Analysis
8.3. Europe Market Size (US$ Bn) and Volume (Kilo Tons) Analysis and Forecast, by Country, 2025-2032
8.3.1. Germany
8.3.2. Italy
8.3.3. France
8.3.4. U.K.
8.3.5. Spain
8.3.6. Russia
8.3.7. Rest of Europe
8.4. Europe Market Size (US$ Bn) and Volume (Kilo Tons) Analysis and Forecast, by Grade, 2025-2032
8.4.1. Fertilizer
8.4.2. Feed
8.4.3. Industrial
8.5. Europe Market Size (US$ Bn) and Volume (Kilo Tons) Analysis and Forecast, by Application, 2025-2032
8.5.1. Agriculture
8.5.2. Animal Feed
8.5.3. Chemical Synthesis
9. East Asia Urea Market Outlook:
9.1. Key Highlights
9.2. Pricing Analysis
9.3. East Asia Market Size (US$ Bn) and Volume (Kilo Tons) Analysis and Forecast, by Country, 2025-2032
9.3.1. China
9.3.2. Japan
9.3.3. South Korea
9.4. East Asia Market Size (US$ Bn) and Volume (Kilo Tons) Analysis and Forecast, by Grade, 2025-2032
9.4.1. Fertilizer
9.4.2. Feed
9.4.3. Industrial
9.5. East Asia Market Size (US$ Bn) and Volume (Kilo Tons) Analysis and Forecast, by Application, 2025-2032
9.5.1. Agriculture
9.5.2. Animal Feed
9.5.3. Chemical Synthesis
9.6. East Asia Market Size (US$ Bn) and Volume (Kilo Tons) Analysis and Forecast, by , 2025-2032
10. South Asia & Oceania Urea Market Outlook:
10.1. Key Highlights
10.2. Pricing Analysis
10.3. South Asia & Oceania Market Size (US$ Bn) and Volume (Kilo Tons) Analysis and Forecast, by Country, 2025-2032
10.3.1. India
10.3.2. Southeast Asia
10.3.3. ANZ
10.3.4. Rest of SAO
10.4. South Asia & Oceania Market Size (US$ Bn) and Volume (Kilo Tons) Analysis and Forecast, by Grade, 2025-2032
10.4.1. Fertilizer
10.4.2. Feed
10.4.3. Industrial
10.5. South Asia & Oceania Market Size (US$ Bn) and Volume (Kilo Tons) Analysis and Forecast, by Application, 2025-2032
10.5.1. Agriculture
10.5.2. Animal Feed
10.5.3. Chemical Synthesis
11. Latin America Urea Market Outlook:
11.1. Key Highlights
11.2. Pricing Analysis
11.3. Latin America Market Size (US$ Bn) and Volume (Kilo Tons) Analysis and Forecast, by Country, 2025-2032
11.3.1. Brazil
11.3.2. Mexico
11.3.3. Rest of LATAM
11.4. Latin America Market Size (US$ Bn) and Volume (Kilo Tons) Analysis and Forecast, by Grade, 2025-2032
11.4.1. Fertilizer
11.4.2. Feed
11.4.3. Industrial
11.5. Latin America Market Size (US$ Bn) and Volume (Kilo Tons) Analysis and Forecast, by Application, 2025-2032
11.5.1. Agriculture
11.5.2. Animal Feed
11.5.3. Chemical Synthesis
12. Middle East & Africa Urea Market Outlook:
12.1. Key Highlights
12.2. Pricing Analysis
12.3. Middle East & Africa Market Size (US$ Bn) and Volume (Kilo Tons) Analysis and Forecast, by Country, 2025-2032
12.3.1. GCC Countries
12.3.2. South Africa
12.3.3. Northern Africa
12.3.4. Rest of MEA
12.4. Middle East & Africa Market Size (US$ Bn) and Volume (Kilo Tons) Analysis and Forecast, by Grade, 2025-2032
12.4.1. Fertilizer
12.4.2. Feed
12.4.3. Industrial
12.5. Middle East & Africa Market Size (US$ Bn) and Volume (Kilo Tons) Analysis and Forecast, by Application, 2025-2032
12.5.1. Agriculture
12.5.2. Animal Feed
12.5.3. Chemical Synthesis
13. Competition Landscape
13.1. Market Share Analysis, 2025
13.2. Market Structure
13.2.1. Competition Intensity Mapping
13.2.2. Competition Dashboard
13.3. Company Profiles
13.3.1. Euro Chem
13.3.1.1. Company Overview
13.3.1.2. Product Portfolio/Offerings
13.3.1.3. Key Financials
13.3.1.4. SWOT Analysis
13.3.1.5. Company Strategy and Key Developments
13.3.2. BASF SE
13.3.3. China National Petroleum Corporation
13.3.4. CF Industries Holdings, Inc.
13.3.5. Nutrien Ltd.
13.3.6. OST Chem
13.3.7. Yara International ASA
13.3.8. Industries Qatar Q.P.S.C
13.3.9. SABIC
13.3.10. PT Pupuk Sriwidjaja Palembang (PUSRI)
13.3.11. PT Pupuk Kujang
13.3.12. PT Pupuk Kalimantan Timur
14. Appendix
14.1. Research Methodology
14.2. Research Assumptions
14.3. Acronyms and Abbreviations


- Agrochemicals
- Urea Market
Urea Market Size, Share, and Growth Forecast for 2025 - 2032
Urea Market by Grade (Fertilizer, Feed, Industrial), Application (Agriculture, Animal Feed, Chemical Synthesis), and Regional Analysis from 2025 to 2032
Urea Market Size and Share Analysis
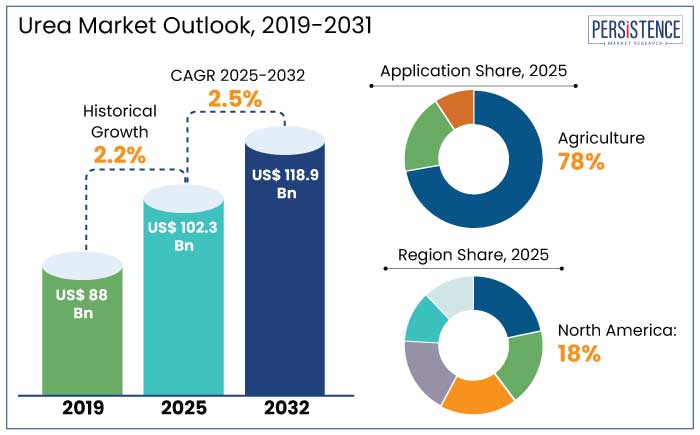
The global urea market is estimated to reach a size of US$ 102.3 Bn in 2025. It is predicted to rise at a CAGR of 2.5% through the assessment period to attain a value of US$ 118.9 Bn by 2032.
Urea, a crucial nitrogen source, is set to witness significant growth in the global urea market due to its significant role in enhancing crop yield and soil fertility. A vital component of agriculture, urine is rising due to its growing use in Asia Pacific, where nations like China, India, and Indonesia account for most of the consumption.
Significant economies including the U.S., China, and India have resumed industrial activities in 2024, marking the industry's recovery from the global epidemic. The agriculture and animal feed industries have shown resilience in the face of trade difficulties, assuring a consistent need for fertilizers based on nitrogen.
Key Highlights of the Market
- Growing agricultural sector is requesting nitrogen-based fertilizers for enhanced crop yields and improved food production.
- Increasing population and food demand are driving the consumption of fertilizers in developing agricultural economies.
- Use of AdBlue/DEF solutions based on urea is gaining popularity as a method to reduce vehicle emissions in commercial transportation.
- The focus on sustainable agriculture practices is influencing the consumption patterns and methods of urea.
- In 2025, agriculture applications are anticipated to attain a market share of 78% due to rising demand across fields.
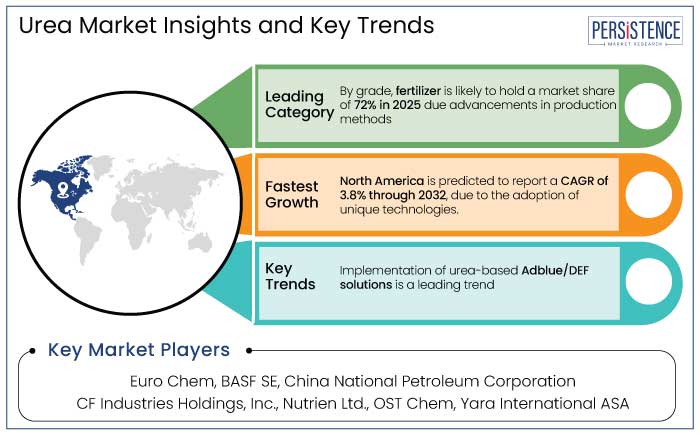
- Based on grade, the fertilizer grade is set to account for a market share of 72% in 2025 due to a wide variety in production.
- North America is estimated to acquire a market share of 18% in 2025 due to developments in agro technology.
- Asia Pacific is envisioned to hold a market share of 65% in 2025 with strong increase in agricultural practices.
|
Market Attributes |
Key Insights |
|
Urea Market Size (2025E) |
US$ 102.3 Bn |
|
Projected Market Value (2032F) |
US$ 118.9 Bn |
|
Global Market Growth Rate (CAGR 2025 to 2032) |
2.5% |
|
Historical Market Growth Rate (CAGR 2019 to 2023) |
2.2% |
Developments in Agro Technology to Offer Novel Visions in North America
The urea industry in North America, which is set to hold 18% of the global market share in 2025, is rising steadily due to high demand from the industrial and agricultural sectors. Nitrogenous fertilizers, crucial for crop yield enhancement and global food export, are gaining popularity due to their industrial applications in resins and adhesives, bolstering urea demand. For instance,
- CF Industries extended its nitrogen production facility in Louisiana in January 2024 to meet increasing domestic demand.
Adoption of eco-friendly farming practices and government subsidies are set to sustain growth. The urea industry in North America is predicted to record a CAGR of 3.8% from 2025 to 2032, driven by technological developments and sustainable agriculture initiatives.
Innovative Agricultural Trends in Asia Pacific Cultivates Urea Production
Asia Pacific is anticipated to dominate the global urea market with a 65% share in 2025, driven by the agricultural sector's demand for urea-based fertilizers to boost crop yields. Countries like China, India, Indonesia, Japan, and South Korea dominate the worldwide urea industry. The rising population of Asia Pacific is driving the need for food, which, in turn, is spurring demand for fertilizers and feed-grade materials.
The regional automobile industry is utilizing urea-based Selective Catalytic Reduction (SCR) systems to decrease vehicle emissions and aid in carbamide production. The market is predicted to generate a CAGR of 4.5% from 2025 to 2032, fueled by ongoing investments in sustainable agriculture, unique farming technologies, and emission control solutions. Asia Pacific is changing due to China's carbon neutrality target and India's agrochemical modernization initiatives.
Fertilizer-grade Urea Leads due to Rising Use in Emerging Economies
In 2025, the fertilizer-grade urea segment is estimated to dominate the global market, accounting for 72% of share, driven by growing demand in developing countries from Africa and Asia. As the global population is set to reach 9.7 billion by 2050, countries in these regions are prioritizing the use of high-yield fertilizers to boost agricultural productivity.
Fertilizer-grade urea is particularly valued for its high nitrogen content, making it essential for key crops such as wheat, maize, and rice. For example,
- Nigeria is set to commission the Dangote Urea Plant in 2024 to meet local demand and export excess capacity to neighboring countries.
- India introduced subsidies and incentives in March 2024 to boost urea production, ensuring affordability for farmers and enhancing food security.
Urgent Need to Boost Crop Yield Propels Demand in Agriculture Industry
In 2025, agricultural applications are predicted to hold 78% of the global urea market share, demonstrating its crucial role in meeting the increasing demand for food and animal feed. Urea, a nitrogen-rich fertilizer, is utilized to boost crop yields and supplement cow feed in developing countries, especially in India and China, leading to global agricultural output. The agriculture sector’s reliance on urea is driven by its affordability and efficiency in providing essential nutrients to crops like rice, wheat, and maize. For example,
- In February 2024, India launched a US$ 2 Bn nitrogenous fertilizer subsidy scheme, assuring farmers' affordability and enhancing nutrient efficiency through developments in slow-release urea formulations.
Urea Market Introduction and Trend Analysis
Growing population and rising food demands in emerging countries are driving the agricultural sector's development, which is further pushing demand for urea. For example,
- The global population is projected to reach 9.7 Bn by 2050, according to the United Nations, which will likely lead to surging demand for food production, thereby raising the use of urea-based fertilizers.
Industrial applications in plastics, resins, and adhesive manufacturing continue to fuel demand. Adoption of urea-based solutions is being promoted through sustainable agriculture practices, precision farming techniques, government subsidies, and unique agricultural technologies.
Environmental regulations are influencing investments in urea production capacities in leading urea-producing regions like the Middle East and China to achieve sustainable goals. The loss of arable land due to urbanization makes it necessary to use fertilizers efficiently to increase agricultural yields, which is why slow-release and bio-based urea formulations are becoming more popular. In 2024, demand for bio-urea formulations surged due to rising need for eco-friendly alternatives to conventional urea products.
Historical Growth and Course Ahead
The global urea powder market recorded a CAGR of 2.2% in the historical period from 2019 to 2024. Global economic recovery has been hindered by the Russia-Ukraine war because of supply chain interruptions, increased commodity prices, and economic sanctions. Nonetheless, certain regions are experiencing development because of government programs like fertilizer purchase incentives by the Government of India.
Global consumption of urea-based products is predicted to increase, with almost one-fourth of the surge occurring in South Asia. The industry has been affected by supply chain interruptions, economic sanctions, and rising commodity prices. But in the years that followed, the war had an effect on markets all around the world. Demand for urea powder is estimated to record a considerable CAGR of 2.5% during the forecast period between 2025 and 2032.
Market Growth Drivers
Increasing Food Demand Drives Fertilizer Consumption in Developing Economies
According to projections, there will be 9.7 billion people on the planet by 2050, which would lead to a rise in fertilizer use in emerging agricultural nations. In urbanized areas, fertilizers, especially nitrogen-based ones like urea, are essential for soil fertility and agricultural production.
- Africa and Asia are driving this demand spike. In 2024, fertilizer consumption grew by 5.8% in Sub-Saharan Africa and 6.2% in India, respectively.
As seen by the African Development Bank's investment in fertilizer manufacturing facilities and India's increased urea subsidy scheme, governments are providing more assistance for agricultural inputs. By encouraging sustainable agricultural methods, these initiatives seek to close the gap between the supply and demand for food.
Implementation of Urea-based Adblue/DEF Solutions to Reduce Vehicle Emissions
The global adoption of AdBlue/diesel exhaust fluid (DEF) solutions, based on urea, is increasing due to strict emission regulations in the commercial transportation sector. AdBlue, a urea-water solution, is critical in selective catalytic reduction (SCR) systems for reducing nitrogen oxide (NOx) emissions, helping diesel vehicles meet emission standards.
- In 2024, the global diesel exhaust fluid market was valued at US$ 16.4 Bn, with a projected CAGR of 7.2% from 2025 to 2032, as regulations like Euro 6 in Europe and Bharat Stage VI in India enforce cleaner emissions.
Key markets like North America and Europe are leading adoption, supported by increasing DEF infrastructure. For example,
- The U.S. EPA updated its NOx reduction standards in March 2024, necessitating increased SCR usage in heavy-duty vehicles.
- China has commenced DEF usage in new commercial fleets under its Blue Sky Action Plan, a move in line with global efforts toward sustainable transportation.
Market Restraining Factors
Acceptance of Organic Farming May Hamper Production
Globally, the price of urea, petroleum, and natural gas is rising, which affects import-dependent nations like Brazil, Australia, Japan, and India. The primary fertilizer used in agriculture, carbamide, raises input prices and increases emissions of carbon dioxide and ammonia. Both human health and ecology are adversely affected by these pollutants.
Alternative farming methods, such as organic and natural farming, are being promoted by governments all over the world without any funding. The Paramparagat Krishi Vikas Yojana program of the Government of India encourages chemical-free farming methods, yet because of the power of prominent customers, these initiatives may impede growth of the market.
Key Market Opportunities
Cosmetic Industry to Boost Usage of Urea-infused Products
Rising discretionary budgets and awareness of skincare issues are driving the cosmetic industry's demand for urea, a crucial component of personal care products. The clean beauty movement and the outstanding skincare qualities of urease have made it a popular natural and sustainable component in North America and Asia Pacific. For example,
- South Korea launched urea-infused K-beauty products in February 2024, targeting global markets.
- Unilever introduced a new line of urea-based body lotions in March 2024, focusing on hydration for diverse skin types, highlighting the growing role of urea in the cosmetics industry.
Development in Urea Production Presents Growth Potential
Integration of novel technology in urea production is estimated to present key opportunities to market players. Utilizing carbon dioxide, nitrogen, and water as basic ingredients, Blue Urea is a significant industrial process that electrolyzes hydrogen.
Renewable energy sources, such as wind turbines, which are situated close to agricultural land, provide the energy. This approach removes contaminants from traditional production and lowers emissions and transportation costs.
Standardized ISO containers may be used to store the equipment, which encourages delocalization and lowers emissions. The product is ideal for usage because its composition is devoid of pollutants. This cutting-edge production method presents substantial prospects for market expansion.
Competitive Landscape for the Urea Market
The urea market is shaped by leading corporations that prioritize significant developments in their product lines. These key players are actively engaging in strategic joint ventures and extending their reach into emerging markets, all while making substantial investments in research and development.
The primary objective is to diversify not only their product offerings but also to surge their customer base by introducing innovative, dependable, and sustainable solutions. This dynamic and multifaceted industry empowers companies to solidify their competitive edge and enhance their positions in the urea market, fostering a continual cycle of growth and improvement.
Recent Industry Developments
- In November 2024, National Fertilizers (NFL) announced its plans to introduce nano urea production at its Nangal plant, aiming to produce thousands of 500ml bottles daily, making it more efficient and environmentally friendly.
- In June 2024, Paradeep Phosphates introduced India's first biogenic Nano Urea and Nano DAP, enhancing crop response and nutrient release, with over 90% nutrient use efficiency.
- In May 2024, Badische Anilin und Soda Fabrik (BASF) introduced biomass-balanced ammonia and urea products, certified by ISCC PLUS, using renewable electricity, reducing carbon footprint by 80% compared to fossil ammonia derivatives.
- In April 2024, India's IFFCO introduced a new Nano Urea Plus with a higher nitrogen content, following a three-year change in crop nutrient specifications.
- In March 2024, EuroChem invested nearly US$ 1 Bn in a state-of-the-art phosphate and urea fertilizer complex in Serra do Salitre, Brazil, offering integrated production with low water consumption and clean energy generation.
- In June 2023, Indian Farmers Fertiliser Cooperative Ltd (IFFCO) partnered with Kapoor Enterprises Inc. to export nano urea to the U.S., replacing traditional Urea bags and reducing logistics and warehousing costs.
Companies Covered in Urea Market
- Euro Chem
- BASF SE
- China National Petroleum Corporation
- CF Industries Holdings, Inc.
- Nutrien Ltd.
- OST Chem
- Yara International ASA
- Industries Qatar Q.P.S.C
- SABIC
- PT Pupuk Sriwidjaja Palembang (PUSRI)
- PT Pupuk Kujang
- PT Pupuk Kalimantan Timur
Frequently Asked Questions
The market size is set to reach US$ 118.9 Bn by 2032.
Urea phosphate outperformed DAP in grain yield and P-fertilizer efficiency, with higher yield at 60ppm P2O5 compared to 80ppm P2O5 at 8.98g pot-1.
In 2025, North America is projected to hold a market share of 18%.
In 2025, the market is estimated to be valued at US$ 102.3 Bn.
Euro Chem, BASF SE, China National Petroleum Corporation, CF Industries Holdings, Inc., and Nutrien Ltd., are a few key players.


