

- Executive Summary
- Global Transcatheter Heart Valve Replacement Repair Market Snapshot, 2026 and 2033
- Market Opportunity Assessment, 2026 – 2033, US$ Bn
- Key Market Trends
- Future Market Projections
- Premium Market Insights
- Industry Developments and Key Market Events
- PMR Analysis and Recommendations
- Market Overview
- Market Scope and Definition
- Market Dynamics
- Drivers
- Restraints
- Opportunity
- Key Trends
- Macro-Economic Factors
- Global Sectorial Outlook
- Global GDP Growth Outlook
- COVID-19 Impact Analysis
- Forecast Factors – Relevance and Impact
- Value Added Insights
- Product Adoption Analysis
- Recent Product Launches
- Regulatory Landscape
- Value Chain Analysis
- Key Deals and Mergers
- PESTLE Analysis
- Porter’s Five Force Analysis
- Price Trend Analysis, 2020 - 2033
- Key Highlights
- Key Factors Impacting Product Prices
- Pricing Analysis, By Product
- Regional Prices and Product Preferences
- Global Transcatheter Heart Valve Replacement Repair Market Outlook:
- Key Highlights
- Market Size (US$ Bn) and Y-o-Y Growth
- Absolute $ Opportunity
- Market Size (US$ Bn) Analysis and Forecast
- Historical Market Size (US$ Bn) Analysis, 2020-2025
- Market Size (US$ Bn) Analysis and Forecast, 2026–2033
- Global Transcatheter Heart Valve Replacement Repair Market Outlook: Product
- Introduction / Key Findings
- Historical Market Size (US$ Bn) Analysis and Volume (Units) Analysis, By Product, 2020 – 2025
- Market Size (US$ Bn) Analysis and Volume (Units) Analysis and Forecast, By Product, 2026 – 2033
- Transcatheter Aortic Valve Replacement (TAVR)
- Self – Expandable Transcatheter Aortic Valves
- Balloon-Expandable Transcatheter Aortic Valves
- Mechanically Expanded Transcatheter Aortic Valves
- Transcatheter Mitral Valve Repair (TMVR)
- Others
- Transcatheter Aortic Valve Replacement (TAVR)
- Market Attractiveness Analysis: By Product
- Global Transcatheter Heart Valve Replacement Repair Market Outlook: Indication
- Introduction / Key Findings
- Historical Market Size (US$ Bn) Analysis, By Indication, 2020 – 2025
- Market Size (US$ Bn) Analysis and Forecast, By Indication, 2026 – 2033
- Severe Aortic Valve Stenosis
- Valve-in-Valve Procedures (Failed Bioprosthesis)
- Aortic Regurgitation
- Market Attractiveness Analysis: Indication
- Global Transcatheter Heart Valve Replacement Repair Market Outlook: End User
- Introduction / Key Findings
- Historical Market Size (US$ Bn) Analysis, By End User, 2020 – 2025
- Market Size (US$ Bn) Analysis and Forecast, By End User, 2026 – 2033
- Hospitals
- Cardiac Catheterization Labs
- Ambulatory Surgery Centers
- Others
- Market Attractiveness Analysis: End User
- Key Highlights
- Global Transcatheter Heart Valve Replacement Repair Market Outlook: Region
- Key Highlights
- Historical Market Size (US$ Bn) Analysis, By Region, 2020 – 2025
- Market Size (US$ Bn) Analysis and Forecast, By Region, 2026 – 2033
- North America
- Europe
- East Asia
- South Asia and Oceania
- Latin America
- Middle East & Africa
- Market Attractiveness Analysis: Region
- North America Transcatheter Heart Valve Replacement Repair Market Outlook:
- Key Highlights
- Historical Market Size (US$ Bn) Analysis, By Market, 2020 – 2025
- By Country
- By Product
- By Indication
- By End User
- Market Size (US$ Bn) Analysis and Forecast, By Country, 2026 – 2033
- U.S.
- Canada
- Market Size (US$ Bn) Analysis and Volume (Units) Analysis and Forecast, By Product, 2026 – 2033
- Transcatheter Aortic Valve Replacement (TAVR)
-
- Self – Expandable Transcatheter Aortic Valves
- Balloon-Expandable Transcatheter Aortic Valves
- Mechanically Expanded Transcatheter Aortic Valves
-
- Transcatheter Mitral Valve Repair (TMVR)
- Others
- Transcatheter Aortic Valve Replacement (TAVR)
- Market Size (US$ Bn) Analysis and Forecast, By Indication, 2026 – 2033
- Severe Aortic Valve Stenosis
- Valve-in-Valve Procedures (Failed Bioprosthesis)
- Aortic Regurgitation
- Market Size (US$ Bn) Analysis and Forecast, By End User, 2026 – 2033
- Hospitals
- Cardiac Catheterization Labs
- Ambulatory Surgery Centers
- Others
- Market Attractiveness Analysis
- Europe Transcatheter Heart Valve Replacement Repair Market Outlook:
- Key Highlights
- Historical Market Size (US$ Bn) Analysis, By Market, 2020 – 2025
- By Country
- By Product
- By Indication
- By End User
- Market Size (US$ Bn) Analysis and Forecast, By Country, 2026 – 2033
- Germany
- France
- U.K.
- Italy
- Spain
- Russia
- Rest of Europe
- Market Size (US$ Bn) Analysis and Volume (Units) Analysis and Forecast, By Product, 2026 – 2033
- Transcatheter Aortic Valve Replacement (TAVR)
-
- Self – Expandable Transcatheter Aortic Valves
- Balloon-Expandable Transcatheter Aortic Valves
- Mechanically Expanded Transcatheter Aortic Valves
-
- Transcatheter Mitral Valve Repair (TMVR)
- Others
- Transcatheter Aortic Valve Replacement (TAVR)
- Market Size (US$ Bn) Analysis and Forecast, By Indication, 2026 – 2033
- Severe Aortic Valve Stenosis
- Valve-in-Valve Procedures (Failed Bioprosthesis)
- Aortic Regurgitation
- Market Size (US$ Bn) Analysis and Forecast, By End User, 2026 – 2033
- Hospitals
- Cardiac Catheterization Labs
- Ambulatory Surgery Centers
- Others
- Market Attractiveness Analysis
- East Asia Transcatheter Heart Valve Replacement Repair Market Outlook:
- Key Highlights
- Historical Market Size (US$ Bn) Analysis, By Market, 2020 – 2025
- By Country
- By Product
- By Indication
- By End User
- Market Size (US$ Bn) Analysis and Forecast, By Country, 2026 – 2033
- China
- Japan
- South Korea
- Market Size (US$ Bn) Analysis and Volume (Units) Analysis and Forecast, By Product, 2026 – 2033
- Transcatheter Aortic Valve Replacement (TAVR)
-
- Self – Expandable Transcatheter Aortic Valves
- Balloon-Expandable Transcatheter Aortic Valves
- Mechanically Expanded Transcatheter Aortic Valves
-
- Transcatheter Mitral Valve Repair (TMVR)
- Others
- Transcatheter Aortic Valve Replacement (TAVR)
- Market Size (US$ Bn) Analysis and Forecast, By Indication, 2026 – 2033
- Severe Aortic Valve Stenosis
- Valve-in-Valve Procedures (Failed Bioprosthesis)
- Aortic Regurgitation
- Market Size (US$ Bn) Analysis and Forecast, By End User, 2026 – 2033
- Hospitals
- Cardiac Catheterization Labs
- Ambulatory Surgery Centers
- Others
- Market Attractiveness Analysis
- South Asia & Oceania Transcatheter Heart Valve Replacement Repair Market Outlook:
- Key Highlights
- Historical Market Size (US$ Bn) Analysis, By Market, 2020 – 2025
- By Country
- By Product
- By Indication
- By End User
- Market Size (US$ Bn) Analysis and Forecast, By Country, 2026 – 2033
- India
- Southeast Asia
- ANZ
- Rest of South Asia & Oceania
- Market Size (US$ Bn) Analysis and Volume (Units) Analysis and Forecast, By Product, 2026 – 2033
- Transcatheter Aortic Valve Replacement (TAVR)
-
- Self – Expandable Transcatheter Aortic Valves
- Balloon-Expandable Transcatheter Aortic Valves
- Mechanically Expanded Transcatheter Aortic Valves
-
- Transcatheter Mitral Valve Repair (TMVR)
- Others
- Transcatheter Aortic Valve Replacement (TAVR)
- Market Size (US$ Bn) Analysis and Forecast, By Indication, 2026 – 2033
- Severe Aortic Valve Stenosis
- Valve-in-Valve Procedures (Failed Bioprosthesis)
- Aortic Regurgitation
- Market Size (US$ Bn) Analysis and Forecast, By End User, 2026 – 2033
- Hospitals
- Cardiac Catheterization Labs
- Ambulatory Surgery Centers
- Others
- Market Attractiveness Analysis
- Latin America Transcatheter Heart Valve Replacement Repair Market Outlook:
- Key Highlights
- Historical Market Size (US$ Bn) Analysis, By Market, 2020 – 2025
- By Country
- By Product
- By Indication
- By End User
- Market Size (US$ Bn) Analysis and Forecast, By Country, 2026 – 2033
- Brazil
- Mexico
- Rest of Latin America
- Market Size (US$ Bn) Analysis and Volume (Units) Analysis and Forecast, By Product, 2026 – 2033
- Transcatheter Aortic Valve Replacement (TAVR)
-
- Self – Expandable Transcatheter Aortic Valves
- Balloon-Expandable Transcatheter Aortic Valves
- Mechanically Expanded Transcatheter Aortic Valves
-
- Transcatheter Mitral Valve Repair (TMVR)
- Others
- Transcatheter Aortic Valve Replacement (TAVR)
- Market Size (US$ Bn) Analysis and Forecast, By Indication, 2026 – 2033
- Severe Aortic Valve Stenosis
- Valve-in-Valve Procedures (Failed Bioprosthesis)
- Aortic Regurgitation
- Market Size (US$ Bn) Analysis and Forecast, By End User, 2026 – 2033
- Hospitals
- Cardiac Catheterization Labs
- Ambulatory Surgery Centers
- Others
- Market Attractiveness Analysis
- Middle East & Africa Transcatheter Heart Valve Replacement Repair Market Outlook:
- Key Highlights
- Historical Market Size (US$ Bn) Analysis, By Market, 2020 – 2025
- By Country
- By Product
- By Indication
- By End User
- Market Size (US$ Bn) Analysis and Forecast, By Country, 2026 – 2033
- GCC Countries
- Egypt
- South Africa
- Northern Africa
- Rest of Middle East & Africa
- Market Size (US$ Bn) Analysis and Volume (Units) Analysis and Forecast, By Product, 2026 – 2033
- Transcatheter Aortic Valve Replacement (TAVR)
-
- Self – Expandable Transcatheter Aortic Valves
- Balloon-Expandable Transcatheter Aortic Valves
- Mechanically Expanded Transcatheter Aortic Valves
-
- Transcatheter Mitral Valve Repair (TMVR)
- Others
- Transcatheter Aortic Valve Replacement (TAVR)
- Market Size (US$ Bn) Analysis and Forecast, By Indication, 2026 – 2033
- Severe Aortic Valve Stenosis
- Valve-in-Valve Procedures (Failed Bioprosthesis)
- Aortic Regurgitation
- Market Size (US$ Bn) Analysis and Forecast, By End User, 2026 – 2033
- Hospitals
- Cardiac Catheterization Labs
- Ambulatory Surgery Centers
- Others
- Market Attractiveness Analysis
- Competition Landscape
- Market Structure
- Competition Intensity Mapping By Market
- Competition Dashboard
- Company Profiles (Details – Overview, Recent Developments)
- Abbott
- Overview
- Segments and Product & End User
- Key Financials
- Market Developments
- Market Strategy
- Edwards Lifesciences Corporation
- Medtronic
- Boston Scientific Corporation
- JenaValve Technology, Inc.
- Meril Life Sciences
- Sahajanand Medical Technologies Limited
- MicroPort Scientific Corporation
- Venus Medtech (Hangzhou) Inc.
- Suzhou Jiecheng Medical Technology Co. Ltd.
- Peijia Medical Limited
- Blue Sail Medical Co., Ltd.
- Others
- Abbott
- Market Structure
- Appendix
- Research Methodology
- Research Assumptions
- Acronyms and Abbreviations


- Medical Devices
- Transcatheter Heart Valve Replacement Repair Market
Transcatheter Heart Valve Replacement Repair Market Size, Share, Growth, and Regional Forecast, 2026 to 2033
Global Transcatheter Heart Valve Replacement Repair Market by Product (Transcatheter Aortic Valve Replacement (TAVR) and Transcatheter Mitral Valve Repair (TMVR)), by Indication (Severe Aortic, Valve Stenosis, Valve-in-Valve Procedures (Failed Bioprosthesis), and Aortic Regurgitation), by End User (Hospitals, Cardiac Catheterization Labs, and Ambulatory Surgical Centers), and Regional Analysis from 2026 to 2033
Key Industry Highlights
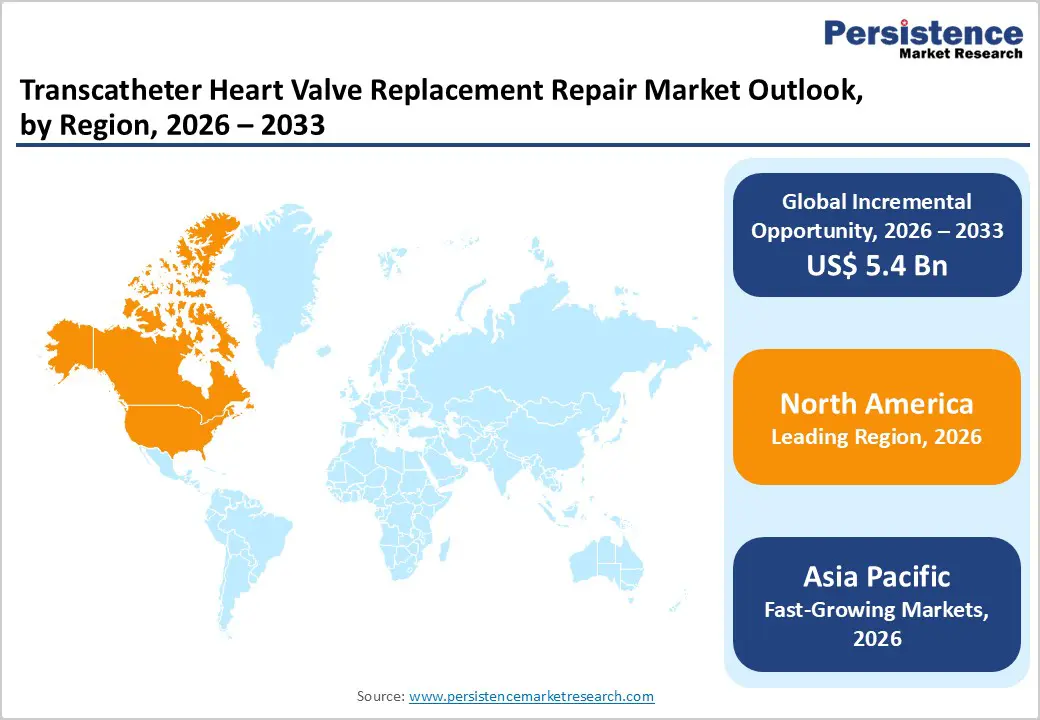
- Leading Region: North America holds the largest share at 47.3%, supported by a high prevalence of valvular heart diseases, strong healthcare spending, advanced structural heart care infrastructure, favorable reimbursement frameworks, and high adoption of transcatheter valve procedures across major hospitals and cardiac centers.
- Fastest-Growing Region: Asia Pacific is expanding fastest due to rising valvular disease burden, increasing aging population, improving healthcare access, rapid urbanization, growing investments in advanced cardiac care, and expansion of private cardiac specialty facilities. Leading Product Segment: Transcatheter aortic valve replacement (TAVR) dominates the market due to proven clinical effectiveness in treating severe aortic stenosis, strong guideline support, expanding patient eligibility, and high adoption across hospitals and cardiac specialty centers.
- Fastest-Growing Product Segment: Transcatheter mitral valve repair (TMVR) is growing rapidly as technological advancements improve procedural safety and durability, while increasing focus on minimally invasive solutions for mitral regurgitation expands adoption.
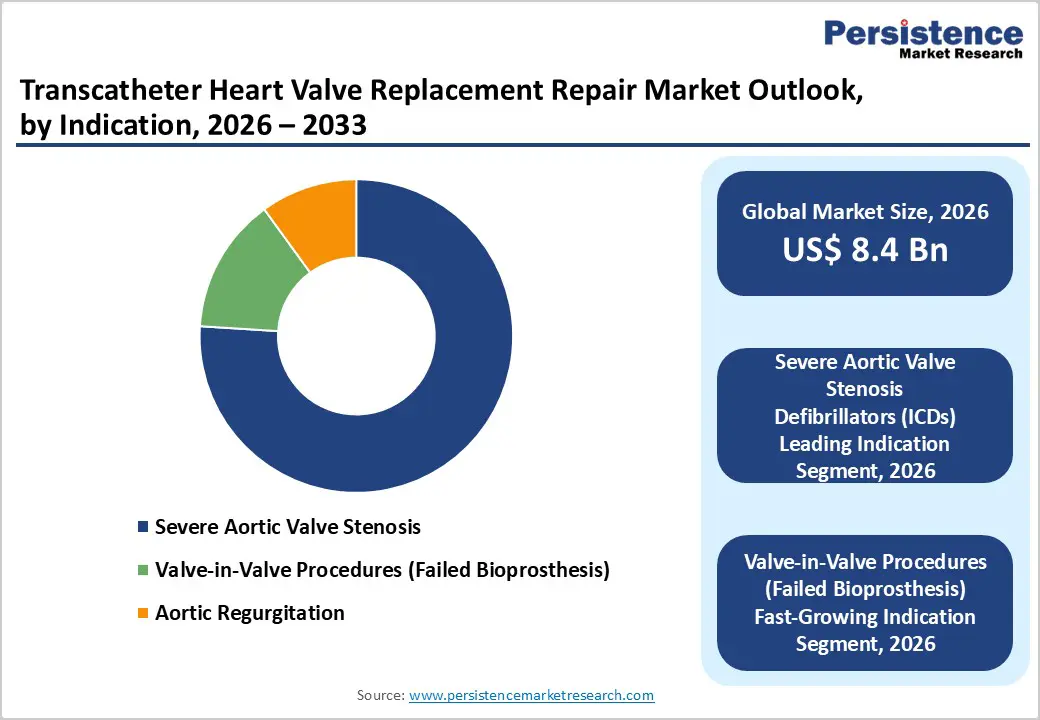
- Leading Indication Segment: Severe aortic valve stenosis remains the top segment, driven by high disease prevalence among elderly populations, strong clinical outcomes with transcatheter therapy, and widespread availability of advanced cardiac intervention facilities.
- Fastest-Growing Indication Segment: Valve-in-valve procedures (failed bioprosthesis) are scaling rapidly due to the growing need for minimally invasive re-intervention options, increasing volumes of aging surgical bioprosthetic valves, and rising preference for transcatheter solutions that reduce repeat open-heart surgery risk and recovery time.
| Report Attribute | Details |
|---|---|
|
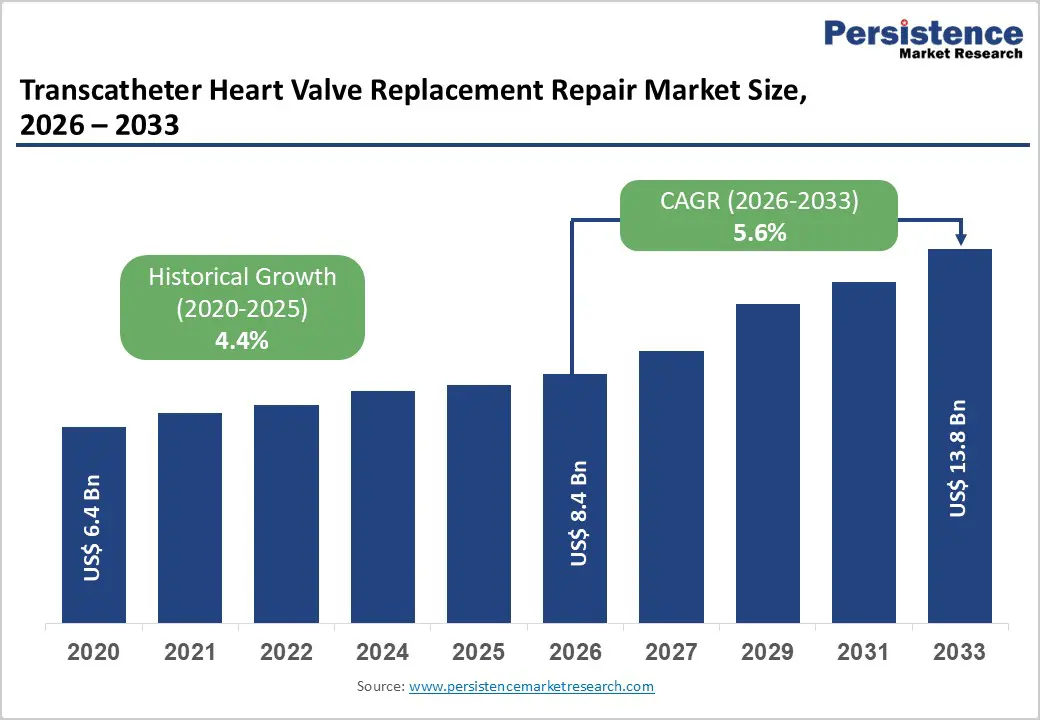
Transcatheter Heart Valve Replacement Repair Market Size (2026E) |
US$ 8.4 Bn |
|
Market Value Forecast (2033F) |
US$ 13.8 Bn |
|
Projected Growth (CAGR 2026 to 2033) |
5.6% |
|
Historical Market Growth (CAGR 2020 to 2025) |
4.4% |
Market Dynamics
Driver – Rising Burden of Valvular Heart Diseases, Aging Population, and Shift Toward Minimally Invasive Cardiac Procedures
Market growth is strongly supported by the rising global burden of valvular heart diseases, particularly aortic stenosis and mitral regurgitation, which are increasingly prevalent among aging populations. Degenerative valve disorders, driven by age-related calcification, hypertension, diabetes, and other lifestyle-related risk factors, have significantly expanded the addressable patient pool for transcatheter interventions. Transcatheter heart valve replacement and repair procedures offer a less invasive alternative to open-heart surgery, making them especially suitable for elderly and high-risk patients who are poor candidates for conventional surgical valve replacement.
Advancements in valve design, delivery systems, and imaging guidance have improved procedural safety, durability, and clinical outcomes, reinforcing physician confidence. Expanding clinical guidelines, growing awareness of early diagnosis, and favorable reimbursement support in developed markets further drive adoption. Additionally, increasing procedural volumes in hospitals and cardiac catheterization labs, coupled with improved survival and quality-of-life outcomes, continue to fuel sustained demand across both mature and emerging healthcare systems.
Restraints – High Procedure Costs, Limited Accessibility, and Infrastructure Constraints
Market growth is constrained by the high cost associated with transcatheter heart valve replacement and repair procedures. These interventions involve expensive valve devices, advanced imaging systems, hybrid operating room infrastructure, and specialized clinical expertise, significantly increasing overall treatment costs. Limited reimbursement coverage and budget constraints in cost-sensitive healthcare systems restrict broader adoption, particularly in developing regions.
The complexity of transcatheter procedures requires highly trained interventional cardiologists and multidisciplinary heart teams, which are not widely available in rural or low-resource settings. Inadequate access to catheterization laboratories and advanced diagnostic tools further limits penetration. Additionally, patient eligibility criteria, anatomical limitations, and long-term durability concerns can restrict procedure volumes. Stringent regulatory approval processes and varying country-specific requirements may delay market entry for new products. Collectively, these factors slow market expansion, especially in emerging economies where affordability, infrastructure gaps, and skilled workforce shortages remain key challenges.
Opportunity – Expanding Indications, Emerging Market Penetration, and Technological Innovation
Significant growth opportunities are emerging from the expansion of transcatheter valve indications beyond high-risk patients to intermediate- and low-risk populations. Increasing adoption of valve-in-valve procedures for failed bioprostheses is further expanding procedural volumes. Emerging markets across Asia Pacific, Latin America, and parts of the Middle East and Africa represent substantial untapped potential, supported by improving healthcare infrastructure, rising healthcare expenditure, and growing awareness of minimally invasive cardiac therapies.
Rapid expansion of private hospitals and cardiac specialty centers is improving access to transcatheter interventions in urban areas. Technological innovation presents another major opportunity, particularly through next-generation valve platforms with enhanced durability, improved sealing mechanisms, and more precise delivery systems. Integration of advanced imaging, digital planning tools, and remote patient monitoring can improve outcomes and procedural efficiency. Development of cost-optimized devices and strategic collaborations between manufacturers, hospitals, and healthcare systems are expected to further unlock long-term growth opportunities in the global transcatheter heart valve replacement and repair market.
Category-wise Analysis
By Product, Transcatheter Aortic Valve Replacement (TAVR) Leads Due to Strong Clinical Outcomes and Expanding Patient Eligibility
Transcatheter Aortic Valve Replacement (TAVR) is projected to dominate the global transcatheter heart valve replacement and repair market in 2026, accounting for a revenue share of 70.0%. Its leadership is primarily driven by proven clinical effectiveness in treating severe aortic valve stenosis, particularly among elderly and high-risk surgical patients. TAVR offers reduced procedural risk, shorter hospital stays, faster recovery, and lower complication rates compared to open-heart surgery. Continuous expansion of indications from high-risk to intermediate- and low-risk patient populations has significantly increased procedure volumes. Favorable clinical guidelines and reimbursement coverage in developed markets further support adoption. Technological advancements such as next-generation valve designs, enhanced durability, improved delivery systems, and better imaging compatibility continue to strengthen physician confidence. Additionally, rising prevalence of degenerative aortic valve disease, combined with growing awareness and screening, supports sustained demand. High procedural value and repeat interventions for valve-in-valve procedures also contribute meaningfully to market dominance.
By Indication, Severe Aortic Valve Stenosis Dominates Due to High Disease Burden in Aging Populations
The severe aortic valve stenosis segment is expected to dominate the global transcatheter heart valve replacement and repair market in 2026, capturing a revenue share of 76.0%. This dominance is driven by the high prevalence of aortic stenosis among elderly populations, where degenerative valve calcification is common. Aging demographics, coupled with increasing life expectancy, have significantly expanded the eligible patient pool for transcatheter interventions. Severe aortic stenosis often presents with high morbidity and mortality if untreated, making timely valve replacement clinically essential. TAVR has become the preferred treatment option for patients considered high or intermediate surgical risk, reinforcing demand in this indication. Increasing awareness, early diagnosis through advanced imaging, and routine cardiac screening programs further support growth. Additionally, strong clinical evidence demonstrating improved survival, symptom relief, and quality of life following TAVR procedures continues to drive adoption. As patient access improves globally, this indication is expected to remain the primary revenue contributor.
By End User, Hospitals Lead Due to Advanced Infrastructure and High Procedural Volumes
Hospitals are projected to dominate the global transcatheter heart valve replacement and repair market in 2026, accounting for a revenue share of 67.0%. This leadership is supported by high patient volumes, availability of advanced hybrid operating rooms, and access to specialized cardiac teams, including interventional cardiologists and cardiothoracic surgeons. Hospitals serve as the primary centers for complex transcatheter valve procedures, post-operative monitoring, and management of high-risk cardiac patients. Comprehensive diagnostic capabilities, including echocardiography and cardiac imaging, enable accurate patient selection and procedural planning. Higher capital budgets allow hospitals to invest in advanced transcatheter valve systems and supporting technologies. Strong reimbursement support, standardized treatment protocols, and multidisciplinary heart team approaches further reinforce hospital dominance. While cardiac catheterization labs and ambulatory surgical centers are gaining traction for select procedures, hospitals continue to lead due to their ability to manage complications and provide end-to-end cardiac care.
Region-wise Insights
North America Transcatheter Heart Valve Replacement Repair Market Trends
North America is expected to dominate the global transcatheter heart valve replacement and repair market with a value share of 47.3% in 2026, led primarily by the United States. The region benefits from a highly developed cardiovascular care ecosystem, early adoption of minimally invasive technologies, and strong clinical awareness of structural heart diseases. High prevalence of aortic stenosis, driven by an aging population and lifestyle-related risk factors, continues to fuel procedure volumes. Favorable reimbursement policies and well-defined clinical guidelines support widespread adoption of TAVR and related procedures.
The strong presence of leading manufacturers such as Medtronic, Abbott, Edwards Lifesciences Corporation, Boston Scientific Corporation, and JenaValve Technology, Inc. ensures rapid commercialization of next-generation valve technologies. Robust regulatory frameworks and extensive clinical trial activity further strengthen market confidence. Additionally, early integration of digital health tools, imaging advancements, and regular device upgrades sustain long-term market leadership across the forecast period.
Europe Transcatheter Heart Valve Replacement Repair Market Trends
The Europe transcatheter heart valve replacement and repair market is expected to grow steadily, supported by strong healthcare systems and increasing emphasis on early diagnosis and minimally invasive cardiac interventions. Countries such as Germany, the U.K., France, Italy, and Spain contribute significantly due to advanced hospital infrastructure and high procedural expertise. An aging population and rising incidence of degenerative valvular diseases are key demand drivers. Widespread availability of universal healthcare coverage in many European countries ensures broader patient access to transcatheter therapies.
Hospitals and specialized cardiac centers continue to adopt clinically validated valve systems to improve patient outcomes and reduce surgical risks. Strict regulatory standards promote high product quality and patient safety, reinforcing physician trust. Growing adoption of valve-in-valve procedures and expansion of treatment eligibility further support market growth. Public and private investments in cardiovascular care infrastructure ensure sustained adoption, positioning Europe as a stable and mature regional market.
Asia Pacific Transcatheter Heart Valve Replacement Repair Market Trends
The Asia Pacific transcatheter heart valve replacement and repair market is expected to register a relatively higher CAGR of around 7.6% between 2026 and 2033, driven by improving healthcare infrastructure and rising cardiovascular disease burden. Rapid urbanization, aging populations, and increasing prevalence of lifestyle-related risk factors are significantly increasing valvular heart disease incidence across countries such as China, India, Japan, South Korea, and Australia. Growing awareness of minimally invasive cardiac procedures and improving access to advanced hospital care are accelerating adoption.
Expansion of private hospitals and cardiac specialty centers is enhancing procedural capacity. Government initiatives aimed at strengthening cardiovascular care delivery and improving treatment outcomes further support market growth. Additionally, increasing participation of global manufacturers, local production initiatives, and availability of cost-effective valve systems are improving affordability. As healthcare expenditure rises and physician expertise expands, Asia Pacific is expected to emerge as the fastest-growing regional market.
Market Competitive Landscape
The global transcatheter heart valve replacement and repair market is highly competitive, with strong participation from companies such as Abbott, Edwards Lifesciences Corporation, Medtronic, Boston Scientific Corporation, and JenaValve Technology, Inc. These players leverage extensive global distribution networks, strong brand recognition, and diversified structural heart and cardiovascular product portfolios to address the rising demand for minimally invasive solutions for valvular heart diseases.
Their offerings emphasize advanced transcatheter valve technologies, procedural safety and durability, precise delivery systems, imaging and navigation compatibility, and suitability across hybrid operating rooms and cardiac catheterization labs. Continuous technological innovation, regulatory approvals, clinical trial validation, product safety, and adherence to stringent international quality and manufacturing standards remain critical to sustaining competitive positioning in the global transcatheter heart valve replacement and repair market.
Key Industry Developments:
- In August 2025, Medtronic reached a major regulatory milestone after the U.S. Food and Drug Administration (FDA) approved an expanded indication for its Evolut transcatheter aortic valve replacement (TAVR) system. The approval of the Redo-TAVR procedure enables physicians to implant a new transcatheter aortic valve within a previously failed TAV, providing a minimally invasive treatment alternative for patients who face high risks associated with repeat open-heart surgery.
- In July 2024, Edwards Lifesciences announced that it exercised its option to acquire Innovalve Bio Medical Ltd., an early-stage transcatheter mitral valve replacement (TMVR) company, following its initial investment in 2017. Since then, Innovalve has shown meaningful progress in its TMVR program, supported by encouraging early clinical experience.
Companies Covered in Transcatheter Heart Valve Replacement Repair Market
- Abbott
- Edwards Lifesciences Corporation
- Medtronic
- Boston Scientific Corporation
- JenaValve Technology, Inc.
- Meril Life Sciences
- Sahajanand Medical Technologies Limited
- MicroPort Scientific Corporation
- Venus Medtech (Hangzhou) Inc.
- Suzhou Jiecheng Medical Technology Co. Ltd.
- Peijia Medical Limited
- Blue Sail Medical Co., Ltd.
- Others
Frequently Asked Questions
The global transcatheter heart valve replacement repair market is projected to be valued at US$ 8.4 Bn in 2026.
Rising prevalence of valvular heart disease in aging populations, coupled with rapid adoption of minimally invasive transcatheter procedures is driving market growth.
The global transcatheter heart valve replacement repair market is poised to witness a CAGR of 5.6% between 2026 and 2033.
Expanding indications beyond high-risk patients and growing adoption of transcatheter therapies in emerging markets present significant growth opportunities.
Abbott, Edwards Lifesciences Corporation, Medtronic, Boston Scientific Corporation, and JenaValve Technology, Inc. are some of the key players in the transcatheter heart valve replacement repair market.


