

- Executive Summary
- Global Spatial Computing Market Snapshot, 2025 and 2032
- Market Opportunity Assessment, 2025 - 2032, US$ Bn
- Key Market Trends
- Future Market Projections
- Premium Market Insights
- Industry Developments and Key Market Events
- PMR Analysis and Recommendations
- Market Overview
- Market Scope and Definition
- Market Dynamics
- Drivers
- Restraints
- Opportunity
- Challenges
- Key Trends
- COVID-19 Impact Analysis
- Forecast Factors - Relevance and Impact
- Value Added Insights
- Value Chain Analysis
- Key Market Players
- Regulatory Landscape
- PESTLE Analysis
- Porter’s Five Forces Analysis
- Consumer Behavior Analysis
- Price Trend Analysis, 2019 - 2032
- Key Factors Impacting Product Prices
- Pricing Analysis, By Component
- Regional Prices and Product Preferences
- Global Spatial Computing Market Outlook
- Market Size (US$ Bn) Analysis and Forecast
- Historical Market Size (US$ Bn) Analysis, 2019-2024
- Market Size (US$ Bn) Analysis and Forecast, 2025-2032
- Global Spatial Computing Market Outlook: By Component
- Historical Market Size (US$ Bn) Analysis, By Component, 2019-2024
- Market Size (US$ Bn) Analysis and Forecast, By Component, 2025-2032
- Hardware
- Software
- Services
- Market Attractiveness Analysis: Component
- Global Spatial Computing Market Outlook: Technology
- Historical Market Size (US$ Bn) Analysis, By Technology, 2019-2024
- Market Size (US$ Bn) Analysis and Forecast, By Technology, 2025-2032
- Artificial Intelligence
- Augmented Reality
- Virtual Reality
- Mixed Reality
- Internet of Things (IoT)
- Digital Twins
- Others
- Market Attractiveness Analysis: Technology
- Global Spatial Computing Market Outlook: End-use
- Historical Market Size (US$ Bn) Analysis, By End-use, 2019-2024
- Market Size (US$ Bn) Analysis and Forecast, By End-use, 2025-2032
- Healthcare
- Education
- Architecture, Engineering, and Construction (AEC)
- Aerospace & Defense
- Automotive
- Gaming
- Consumer Electronics
- Government and Public Sector
- Information Technology
- Energy and Utilities
- Others
- Market Attractiveness Analysis: End-use
- Market Size (US$ Bn) Analysis and Forecast
- Global Spatial Computing Market Outlook: Region
- Historical Market Size (US$ Bn) Analysis, By Region, 2019-2024
- Market Size (US$ Bn) Analysis and Forecast, By Region, 2025-2032
- North America
- Latin America
- Europe
- East Asia
- South Asia and Oceania
- Middle East & Africa
- Market Attractiveness Analysis: Region
- North America Spatial Computing Market Outlook
- Historical Market Size (US$ Bn) Analysis, By Market, 2019-2024
- By Country
- By Component
- By Technology
- By End-use
- Market Size (US$ Bn) Analysis and Forecast, By Country, 2025-2032
- U.S.
- Canada
- Market Size (US$ Bn) Analysis and Forecast, By Component, 2025-2032
- Hardware
- Software
- Services
- Market Size (US$ Bn) Analysis and Forecast, By Technology, 2025-2032
- Artificial Intelligence
- Augmented Reality
- Virtual Reality
- Mixed Reality
- Internet of Things (IoT)
- Digital Twins
- Others
- Market Size (US$ Bn) Analysis and Forecast, By End-use, 2025-2032
- Healthcare
- Education
- Architecture, Engineering, and Construction (AEC)
- Aerospace & Defense
- Automotive
- Gaming
- Consumer Electronics
- Government and Public Sector
- Information Technology
- Energy and Utilities
- Others
- Market Attractiveness Analysis
- Historical Market Size (US$ Bn) Analysis, By Market, 2019-2024
- Europe Spatial Computing Market Outlook
- Historical Market Size (US$ Bn) Analysis, By Market, 2019-2024
- By Country
- By Component
- By Technology
- By End-use
- Market Size (US$ Bn) Analysis and Forecast, By Country, 2025-2032
- Germany
- France
- U.K.
- Italy
- Spain
- Russia
- Rest of Europe
- Market Size (US$ Bn) Analysis and Forecast, By Component, 2025-2032
- Hardware
- Software
- Services
- Market Size (US$ Bn) Analysis and Forecast, By Technology, 2025-2032
- Artificial Intelligence
- Augmented Reality
- Virtual Reality
- Mixed Reality
- Internet of Things (IoT)
- Digital Twins
- Others
- Market Size (US$ Bn) Analysis and Forecast, By End-use, 2025-2032
- Healthcare
- Education
- Architecture, Engineering, and Construction (AEC)
- Aerospace & Defense
- Automotive
- Gaming
- Consumer Electronics
- Government and Public Sector
- Information Technology
- Energy and Utilities
- Others
- Market Attractiveness Analysis
- Historical Market Size (US$ Bn) Analysis, By Market, 2019-2024
- East Asia Spatial Computing Market Outlook
- Historical Market Size (US$ Bn) Analysis, By Market, 2019-2024
- By Country
- By Component
- By Technology
- By End-use
- Market Size (US$ Bn) Analysis and Forecast, By Country, 2025-2032
- China
- Japan
- South Korea
- Market Size (US$ Bn) Analysis and Forecast, By Component, 2025-2032
- Hardware
- Software
- Services
- Market Size (US$ Bn) Analysis and Forecast, By Technology, 2025-2032
- Artificial Intelligence
- Augmented Reality
- Virtual Reality
- Mixed Reality
- Internet of Things (IoT)
- Digital Twins
- Others
- Market Size (US$ Bn) Analysis and Forecast, By End-use, 2025-2032
- Healthcare
- Education
- Architecture, Engineering, and Construction (AEC)
- Aerospace & Defense
- Automotive
- Gaming
- Consumer Electronics
- Government and Public Sector
- Information Technology
- Energy and Utilities
- Others
- Market Attractiveness Analysis
- Historical Market Size (US$ Bn) Analysis, By Market, 2019-2024
- South Asia & Oceania Spatial Computing Market Outlook
- Historical Market Size (US$ Bn) Analysis, By Market, 2019-2024
- By Country
- By Component
- By Technology
- By End-use
- Market Size (US$ Bn) Analysis and Forecast, By Country, 2025-2032
- India
- Indonesia
- Thailand
- Singapore
- ANZ
- Rest of South Asia & Oceania
- Market Size (US$ Bn) Analysis and Forecast, By Component, 2025-2032
- Hardware
- Software
- Services
- Market Size (US$ Bn) Analysis and Forecast, By Technology, 2025-2032
- Artificial Intelligence
- Augmented Reality
- Virtual Reality
- Mixed Reality
- Internet of Things (IoT)
- Digital Twins
- Others
- Market Size (US$ Bn) Analysis and Forecast, By End-use, 2025-2032
- Healthcare
- Education
- Architecture, Engineering, and Construction (AEC)
- Aerospace & Defense
- Automotive
- Gaming
- Consumer Electronics
- Government and Public Sector
- Information Technology
- Energy and Utilities
- Others
- Market Attractiveness Analysis
- Historical Market Size (US$ Bn) Analysis, By Market, 2019-2024
- Latin America Spatial Computing Market Outlook
- Historical Market Size (US$ Bn) Analysis, By Market, 2019-2024
- By Country
- By Component
- By Technology
- By End-use
- Market Size (US$ Bn) Analysis and Forecast, By Country, 2025-2032
- Brazil
- Mexico
- Rest of Latin America
- Market Size (US$ Bn) Analysis and Forecast, By Component, 2025-2032
- Hardware
- Software
- Services
- Market Size (US$ Bn) Analysis and Forecast, By Technology, 2025-2032
- Artificial Intelligence
- Augmented Reality
- Virtual Reality
- Mixed Reality
- Internet of Things (IoT)
- Digital Twins
- Others
- Market Size (US$ Bn) Analysis and Forecast, By End-use, 2025-2032
- Healthcare
- Education
- Architecture, Engineering, and Construction (AEC)
- Aerospace & Defense
- Automotive
- Gaming
- Consumer Electronics
- Government and Public Sector
- Information Technology
- Energy and Utilities
- Others
- Market Attractiveness Analysis
- Historical Market Size (US$ Bn) Analysis, By Market, 2019-2024
- Middle East & Africa Spatial Computing Market Outlook
- Historical Market Size (US$ Bn) Analysis, By Market, 2019-2024
- By Country
- By Component
- By Technology
- By End-use
- Market Size (US$ Bn) Analysis and Forecast, By Country, 2025-2032
- GCC Countries
- Egypt
- South Africa
- Northern Africa
- Rest of Middle East & Africa
- Market Size (US$ Bn) Analysis and Forecast, By Component, 2025-2032
- Hardware
- Software
- Services
- Market Size (US$ Bn) Analysis and Forecast, By Technology, 2025-2032
- Artificial Intelligence
- Augmented Reality
- Virtual Reality
- Mixed Reality
- Internet of Things (IoT)
- Digital Twins
- Others
- Market Size (US$ Bn) Analysis and Forecast, By End-use, 2025-2032
- Healthcare
- Education
- Architecture, Engineering, and Construction (AEC)
- Aerospace & Defense
- Automotive
- Gaming
- Consumer Electronics
- Government and Public Sector
- Information Technology
- Energy and Utilities
- Others
- Market Attractiveness Analysis
- Historical Market Size (US$ Bn) Analysis, By Market, 2019-2024
- Competition Landscape
- Market Share Analysis, 2024
- Market Structure
- Competition Intensity Mapping By Market
- Competition Dashboard
- Company Profiles (Details - Overview, Financials, Strategy, Recent Developments)
-
- Apple Inc.
- Overview
- Segments and Component
- Key Financials
- Market Developments
- Market Strategy
- Avegant Corporation
- Blippar
- DAQRI
- Google LLC
- HTC Corporation
- Lenovo Group Limited
- Magic Leap Inc.
- Marxent, Microsoft Corporation
- NVIDIA Corporation
- Oculus (Facebook Reality Labs)
- Qualcomm Technologies Inc.
- Seiko Epson Corporation
- Sony Group Corporation
- Unity Software Inc.
- Vuzix, Zappar Ltd.
- Others
-
- Appendix
- Research Methodology
- Research Assumptions
- Acronyms and Abbreviations


- Technology
- Spatial Computing Market
Spatial Computing Market Size, Share, and Growth Forecast, 2025 - 2032
Spatial Computing Market by Component (Hardware, Software, Services), Technology (Artificial Intelligence, Augmented Reality, Virtual Reality, Mixed Reality, Internet of Things (IoT), Digital Twins, Others), End-use (Healthcare, Education, Architecture, Engineering, and Construction), and Regional Analysis for 2025 - 2032
Spatial Computing Market Size and Trend Analysis
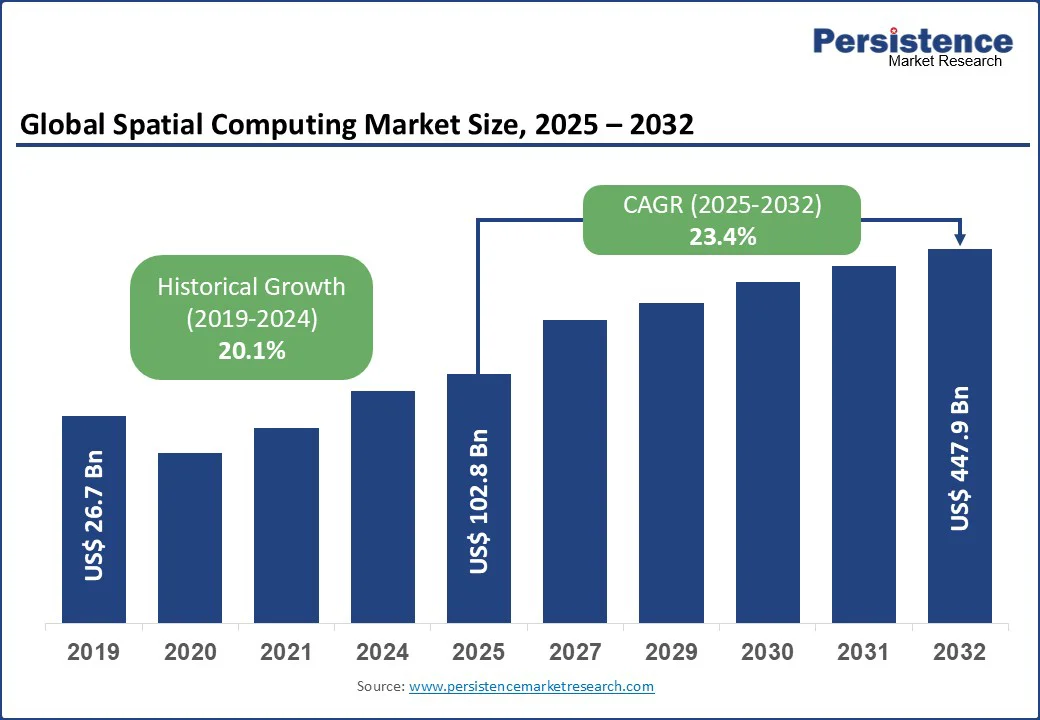
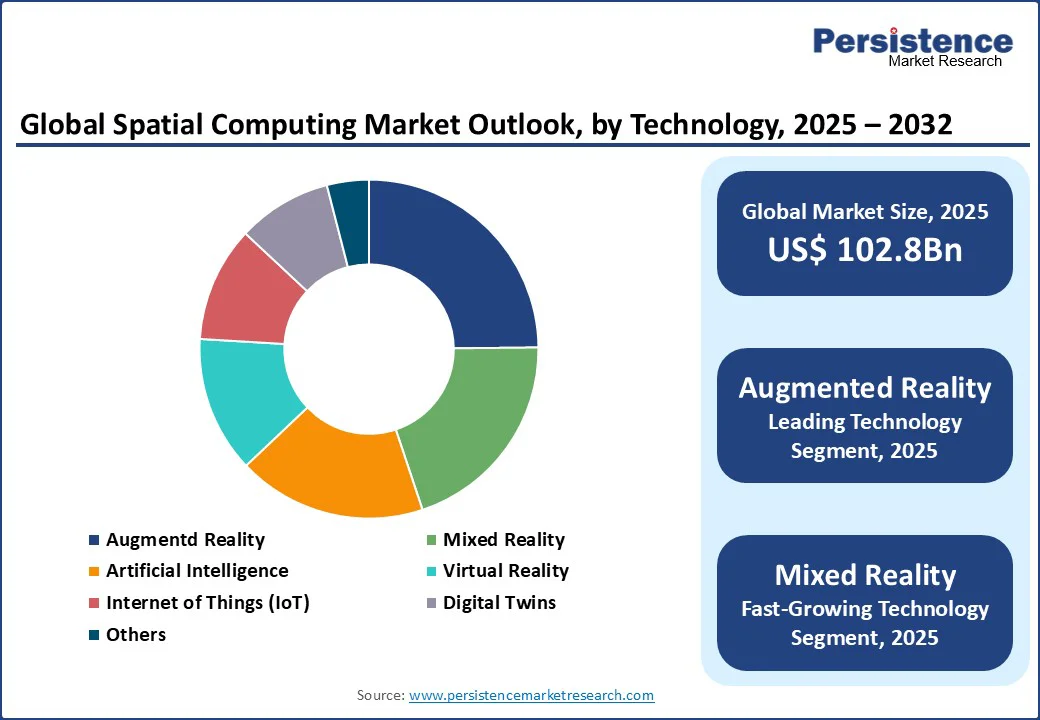
The global spatial computing market size is likely to be valued at US$102.8 Bn in 2025 and reach US$447.9 Bn by 2032, growing at a CAGR of 23.4% during the forecast period from 2025 to 2032.
Spatial computing, encompassing augmented reality (AR), virtual reality (VR), mixed reality (MR), and related technologies, is revolutionizing industries by enabling immersive digital experiences and seamless interaction with physical environments. The Spatial Computing market is driven by increasing adoption in gaming, healthcare, and architecture, engineering, and construction (AEC), fueled by advancements in hardware, AI integration, and IoT connectivity. Rising investments in smart city initiatives and Industry 4.0 further propel market growth, with key players innovating to meet diverse application needs.
Key Industry Highlights
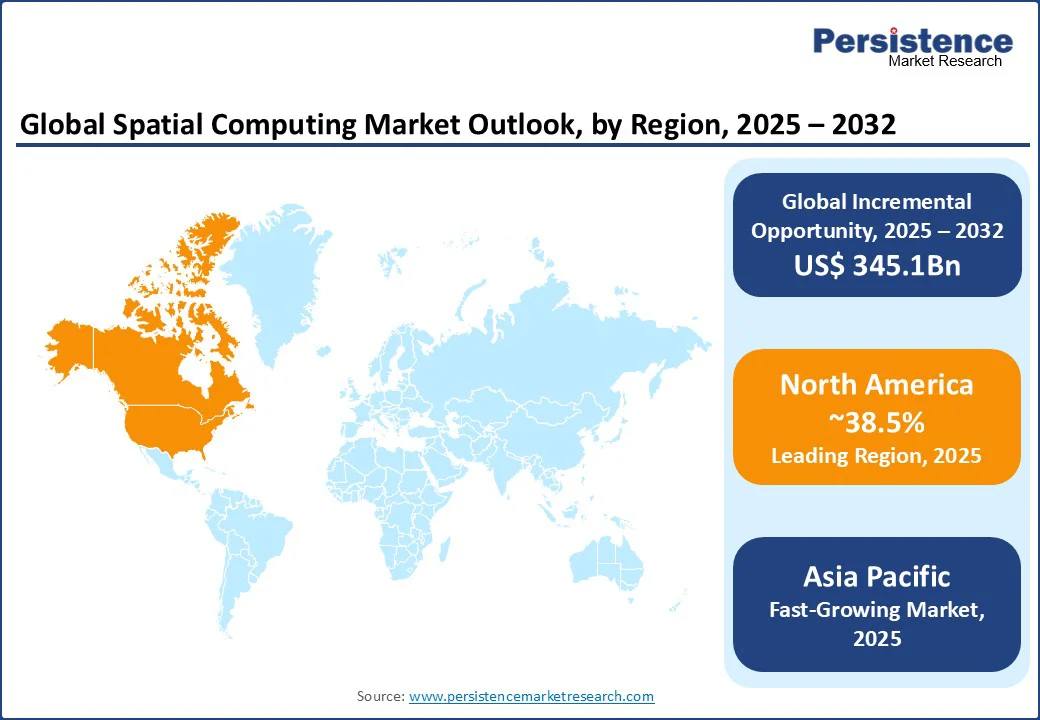
- Leading Region: North America holds a 38.5% market share in 2025, driven by technological innovation, robust R&D, and high adoption in gaming and healthcare in the U.S. and Canada.
- Fastest-growing Region: Asia Pacific is the fastest-growing region, propelled by rapid digitalization, government-led smart city projects, and increasing consumer electronics demand in China and India.
- Investment Plans: China’s 14th Five-Year Plan (2021–2025) places strong emphasis on "new infrastructure" allocating over ¥10 trillion (approx. US$1.49 trillion) to support sectors such as 5G, data centers, AI, IoT, industrial internet, and smart transportation systems-aimed at modernizing digital infrastructure and driving technological transformation boosting spatial computing applications in urban development.
- Dominant Component: Hardware accounts for 66.8% of market share, driven by demand for AR/VR headsets, sensors, and spatial mapping devices in gaming and industrial applications.
- Leading Application: Gaming contributes over 21.8% of market revenue, fueled by immersive experiences and widespread adoption of VR headsets and AR mobile applications.
|
Global Market Attribute |
Key Insights |
|
Spatial Computing Market Size (2025E) |
US$ 102.8Bn |
|
Market Value Forecast (2032F) |
US$ 447.9Bn |
|
Projected Growth (CAGR 2025 to 2032) |
23.4% |
|
Historical Market Growth (CAGR 2019 to 2024) |
20.1% |
Market Dynamics
Driver - Surge in Demand for Immersive Technologies in Gaming and Entertainment
The spatial computing market is experiencing robust growth due to surging demand for immersive technologies in gaming and entertainment. AR and VR technologies provide interactive and realistic experiences, driving adoption in gaming, live events, and media. According to Statista, the global gaming market is expected to reach $522.46 billion by 2025, with AR/VR gaming contributing significantly.
Companies such as Oculus (Meta) and Sony Group Corporation are launching advanced headsets, such as the Meta Quest 3 and PlayStation VR2, enhancing user engagement. The rise of esports and virtual concerts, with events such as Fortnite’s virtual concerts attracting millions, further fuels demand. In North America, the U.S. gaming industry relies heavily on spatial computing for immersive gameplay. Government support for digital innovation, such as Canada’s Media Fund, ensures sustained investment, positioning gaming as a key driver for market expansion through 2032.
Restraint - High Costs and Technical Complexity of Spatial Computing Systems
The spatial computing market faces challenges due to high development and deployment costs, coupled with technical complexities. Advanced AR/VR hardware, such as high-resolution headsets and spatial sensors, requires significant investment, limiting adoption among smaller enterprises. In 2024, the average cost of a premium VR headset, such as the Apple Vision Pro, exceeds $3,000, making it inaccessible for cost-sensitive markets.
Additionally, integrating AI, IoT, and digital twins demands sophisticated infrastructure, posing challenges for scalability. Limited standardization in software platforms and interoperability issues further hinder adoption, particularly in developing regions. These factors, combined with the need for skilled expertise, restrain market growth, especially in price-sensitive sectors such as education and small-scale AEC projects.
Opportunity - Expanding Applications in Healthcare and Training
The growing focus on healthcare and professional training presents significant opportunities for the spatial computing market. AR and VR technologies are transforming medical training, surgical simulations, and patient care by providing immersive, risk-free environments. According to the World Health Organization in 2021, global spending on health reached a new high of US$9.8 trillion, accounting for 10.3% of global GDP, with spatial computing playing a key role in telemedicine and diagnostics.
Companies such as Microsoft, with HoloLens 2, are enabling remote surgical guidance and 3D anatomical modeling. In training, spatial computing enhances workforce skills in industries such as aerospace and automotive, with Boeing using AR for assembly training, reducing errors by 30%, per industry reports. Government initiatives, such as the EU’s Horizon 2030 program, support digital health innovations, creating opportunities for manufacturers to develop tailored solutions, driving market growth through 2032.
Category-wise Analysis
Component Insights
- Hardware holds the largest market share, approximately 66.8% in 2025, driven by demand for AR/VR headsets, spatial sensors, and high-performance computing devices. Companies such as Apple Inc. and HTC Corporation lead with innovative products such as the Apple Vision Pro and HTC Vive, catering to gaming, AEC, and healthcare applications across North America and Europe.
- The services segment, including implementation, maintenance, and consulting, is the fastest-growing, propelled by the need for customized solutions and system integration. Providers such as PTC and Unity Software Inc. offer AR/VR development services, supporting industries such as automotive and education in the Asia Pacific and North America.
Technology Insights
- Augmented reality accounts for 24.8% market share in 2025, driven by its versatility in applications such as gaming, retail, and industrial maintenance. Companies such as Google LLC and Qualcomm Technologies Inc. are advancing AR platforms, with Google’s ARCore enabling seamless mobile AR experiences in North America and the Asia Pacific.
- Mixed reality is the fastest-growing segment, fueled by its ability to blend physical and digital environments for training and design. Microsoft’s HoloLens and Magic Leap’s headsets are gaining traction in healthcare and AEC, particularly in Europe and North America, due to their immersive capabilities.
End-use Insights
- The gaming sector accounts for over 21.8% of market revenue in 2025, driven by the popularity of VR headsets and AR mobile games. Companies such as Oculus and Sony Group Corporation lead with products such as Meta Quest and PlayStation VR, meeting consumer demand in North America and the Asia Pacific.
- Healthcare is the fastest-growing end-use segment, propelled by AR/VR applications in medical training, surgical planning, and patient rehabilitation. Microsoft and NVIDIA Corporation are innovating with solutions such as HoloLens for surgical simulations, with strong adoption in North America and Europe.
Regional Insights
North America Spatial Computing Market Trends
North America dominates the spatial computing market, holding a 38.5% share in 2025, propelled by robust technological innovation, high R&D investment, and strong demand in gaming and healthcare in the U.S. and Canada. The U.S. gaming industry relies on spatial computing for immersive experiences. Canada’s healthcare sector, supported by the Canada Health Infoway, adopts AR/VR for medical training. Major players such as Microsoft, Apple, and NVIDIA dominate with extensive distribution networks and advanced products such as HoloLens and Vision Pro. The region’s focus on Industry 4.0 and smart manufacturing further drives demand for spatial computing solutions, positioning North America for rapid growth through 2032.
Asia Pacific Spatial Computing Market Trends
Asia Pacific is the fastest-growing region, driven by rapid digitalization and high consumer electronics demand in China and India. China, a global technology hub, contributes significantly, with its 14th Five-Year Plan allocating $1.4 trillion for smart infrastructure by 2030, per the National Development and Reform Commission.
India’s Digital India initiative boosts AR/VR adoption in education and healthcare. The region’s gaming industry drives demand for VR headsets. Companies such as Lenovo and Seiko Epson Corporation expand their presence, leveraging low-cost manufacturing and strong R&D. Rising industrial automation and government support ensure the Asia Pacific’s market leadership through 2032.
Europe Spatial Computing Market Trends
Europe is the second fastest-growing region, driven by stringent regulations, rising demand in automotive and healthcare, and infrastructure development in Germany and France. The European AR/VR market, valued at €35 billion in 2024 per the European Commission, supports applications in automotive design and medical training. Germany’s Industry 4.0 initiatives boost demand for MR solutions, with companies such as Siemens and PTC leading innovation. The EU’s Horizon 2030 program promotes digital health and smart city projects, increasing the adoption of AR/VR in healthcare and AEC. Companies such as Zappar Ltd. and Unity Software Inc. cater to consumer and industrial needs, ensuring Europe’s strong market growth through 2032.
Competitive Landscape
The global spatial computing market is highly competitive and fragmented, with numerous international and regional players. Major companies such as Apple Inc., Microsoft Corporation, and Meta’s Oculus dominate through extensive product portfolios and global distribution networks. Regional players, such as Zappar Ltd., focus on localized AR solutions. Companies are investing in AI-driven AR/VR platforms and lightweight hardware to enhance market share, driven by demand in gaming, healthcare, and AEC.
Industry Developments:
- July 2025: PICO announced a strategic partnership with the Blender Foundation to enhance 3D content creation within enterprise XR pipelines. This collaboration marks PICO as the first XR platform to contribute to Blender's OpenXR development, aiming to revolutionize immersive virtual reality (VR) and mixed reality (MR) experiences.
- April 2025: Apple announced the integration of Apple Intelligence into its Vision Pro headset with the release of visionOS 2.4. This major update introduced a suite of AI-powered features aimed at enhancing productivity and creativity, including advanced writing tools, AI-generated images, personalized emojis, and improved natural language search capabilities within the Photos app.
Companies Covered in Spatial Computing Market
- Apple Inc.
- Avegant Corporation
- Blippar
- DAQRI
- Google LLC
- HTC Corporation
- Lenovo Group Limited
- Magic Leap Inc.
- Marxent, Microsoft Corporation
- NVIDIA Corporation
- Oculus (Facebook Reality Labs)
- Qualcomm Technologies Inc.
- Seiko Epson Corporation
- Sony Group Corporation
- Unity Software Inc.
- Vuzix, Zappar Ltd.
- Others
Frequently Asked Questions
The spatial computing market is projected to reach US$102.8 Bn in 2025.
Growing demand for immersive technologies in gaming, healthcare, and AEC, along with advancements in AI and IoT, are key market drivers.
The spatial computing market is poised to witness a CAGR of 23.4% from 2025 to 2032.
The rising adoption in the healthcare and professional training sectors is the key market opportunity.
Apple Inc., Microsoft Corporation, Oculus (Meta), and Sony Group Corporation are key market players.


