

- Executive Summary
- Global Single-Use Bronchoscopes Market Snapshot, 2026 and 2033
- Market Opportunity Assessment, 2026 – 2033, US$ Mn
- Key Market Trends
- Future Market Projections
- Premium Market Insights
- Industry Developments and Key Market Events
- PMR Analysis and Recommendations
- Market Overview
- Market Scope and Definition
- Market Dynamics
- Drivers
- Restraints
- Opportunity
- Key Trends
- Macro-Economic Factors
- Global Sectorial Outlook
- Global GDP Growth Outlook
- COVID-19 Impact Analysis
- Forecast Factors – Relevance and Impact
- Value Added Insights
- Product Adoption Analysis
- Recent Product Launches
- Regulatory Landscape
- Value Chain Analysis
- Key Deals and Mergers
- PESTLE Analysis
- Porter’s Five Force Analysis
- Price Trend Analysis, 2020 - 2033
- Key Highlights
- Key Factors Impacting Product Prices
- Pricing Analysis, By Product Type
- Regional Prices and Product Preferences
- Global Single-Use Bronchoscopes Market Outlook:
- Key Highlights
- Market Size (US$ Mn) and Y-o-Y Growth
- Absolute $ Opportunity
- Market Size (US$ Mn) Analysis and Forecast
- Historical Market Size (US$ Mn) Analysis, 2020-2025
- Market Size (US$ Mn) Analysis and Forecast, 2026–2033
- Global Single-Use Bronchoscopes Market Outlook: Product
- Introduction / Key Findings
- Historical Market Size (US$ Mn) Analysis and Volume (Units) Analysis, By Product, 2020 – 2025
- Market Size (US$ Mn) Analysis and Volume (Units) Analysis and Forecast, By Product, 2026 – 2033
- Large
- Regular
- Slim
- Ultra-slim
- Extra-large
- Market Attractiveness Analysis: By Product
- Global Single-Use Bronchoscopes Market Outlook: Usage
- Introduction / Key Findings
- Historical Market Size (US$ Mn) Analysis, By Usage, 2020 – 2025
- Market Size (US$ Mn) Analysis and Forecast, By Usage, 2026 – 2033
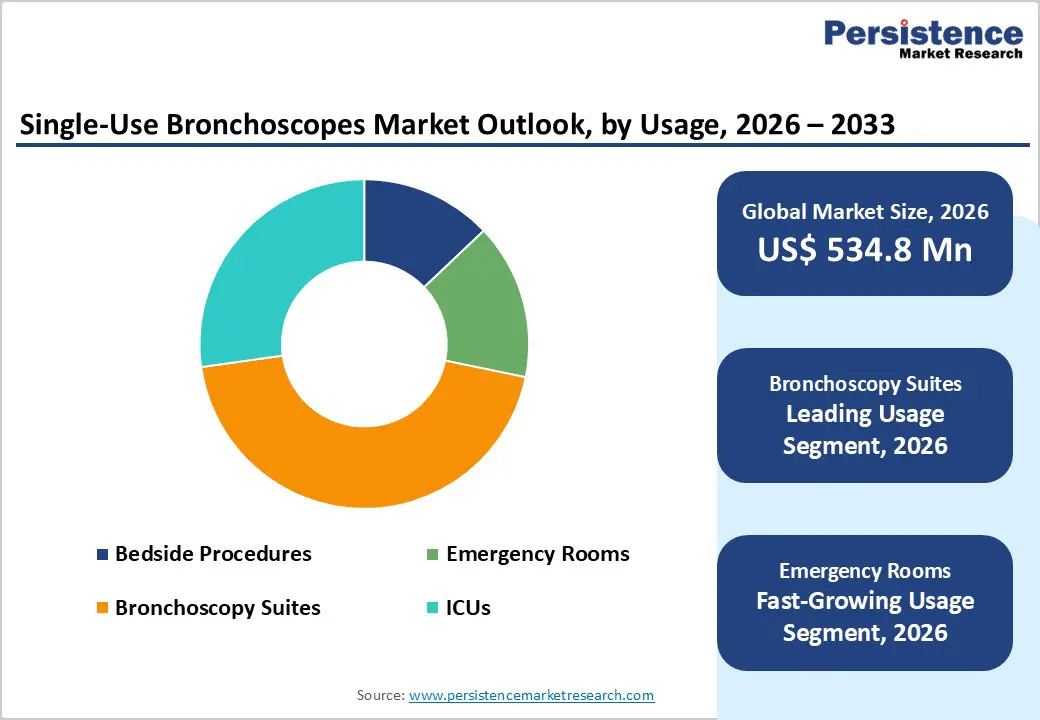
- Bedside Procedures
- Emergency Rooms
- Bronchoscopy Suites
- ICUs
- Market Attractiveness Analysis: By Usage
- Global Single-Use Bronchoscopes Market Outlook: Indication
- Introduction / Key Findings
- Historical Market Size (US$ Mn) Analysis, By Indication, 2020 – 2025
- Market Size (US$ Mn) Analysis and Forecast, By Indication, 2026 – 2033
- Lung Cancer
- Pulmonary Infections
- Interstitial Lung Disease
- Tuberculosis
- COPD
- Cystic Fibrosis
- Market Attractiveness Analysis: By Indication
- Global Single-Use Bronchoscopes Market Outlook: End User
- Introduction / Key Findings
- Historical Market Size (US$ Mn) Analysis, By End User, 2020 – 2025
- Market Size (US$ Mn) Analysis and Forecast, By End User, 2026 – 2033
- Hospitals
- Ambulatory Surgical Centers (ASCs)
- Specialty Clinics
- Diagnostic Centers
- Market Attractiveness Analysis: End User
- Key Highlights
- Global Single-Use Bronchoscopes Market Outlook: Region
- Key Highlights
- Historical Market Size (US$ Mn) Analysis, By Region, 2020 – 2025
- Market Size (US$ Mn) Analysis and Forecast, By Region, 2026 – 2033
- North America
- Europe
- East Asia
- South Asia and Oceania
- Latin America
- Middle East & Africa
- Market Attractiveness Analysis: Region
- North America Single-Use Bronchoscopes Market Outlook:
- Key Highlights
- Historical Market Size (US$ Mn) Analysis, By Market, 2020 – 2025
- By Country
- By Product
- By Usage
- By Indication
- By End User
- Market Size (US$ Mn) Analysis and Forecast, By Country, 2026 – 2033
- U.S.
- Canada
- Market Size (US$ Mn) Analysis and Volume (Units) Analysis and Forecast, By Product, 2026 – 2033
- Large
- Regular
- Slim
- Ultra-slim
- Extra-large
- Market Size (US$ Mn) Analysis and Forecast, By Usage, 2026 – 2033
- Bedside Procedures
- Emergency Rooms
- Bronchoscopy Suites
- ICUs
- Market Size (US$ Mn) Analysis and Forecast, By Indication, 2026 – 2033
- Lung Cancer
- Pulmonary Infections
- Interstitial Lung Disease
- Tuberculosis
- COPD
- Cystic Fibrosis
- Market Size (US$ Mn) Analysis and Forecast, By End User, 2026 – 2033
- Hospitals
- Ambulatory Surgical Centers (ASCs)
- Specialty Clinics
- Diagnostic Centers
- Market Attractiveness Analysis
- Europe Single-Use Bronchoscopes Market Outlook:
- Key Highlights
- Historical Market Size (US$ Mn) Analysis, By Market, 2020 – 2025
- By Country
- By Product
- By Usage
- By Indication
- By End User
- Market Size (US$ Mn) Analysis and Forecast, By Country, 2026 – 2033
- Germany
- France
- U.K.
- Italy
- Spain
- Russia
- Rest of Europe
- Market Size (US$ Mn) Analysis and Volume (Units) Analysis and Forecast, By Product, 2026 – 2033
- Large
- Regular
- Slim
- Ultra-slim
- Extra-large
- Market Size (US$ Mn) Analysis and Forecast, By Usage, 2026 – 2033
- Bedside Procedures
- Emergency Rooms
- Bronchoscopy Suites
- ICUs
- Market Size (US$ Mn) Analysis and Forecast, By Indication, 2026 – 2033
- Lung Cancer
- Pulmonary Infections
- Interstitial Lung Disease
- Tuberculosis
- COPD
- Cystic Fibrosis
- Market Size (US$ Mn) Analysis and Forecast, By End User, 2026 – 2033
- Hospitals
- Ambulatory Surgical Centers (ASCs)
- Specialty Clinics
- Diagnostic Centers
- Market Attractiveness Analysis
- East Asia Single-Use Bronchoscopes Market Outlook:
- Key Highlights
- Historical Market Size (US$ Mn) Analysis, By Market, 2020 – 2025
- By Country
- By Product
- By Usage
- By Indication
- By End User
- Market Size (US$ Mn) Analysis and Forecast, By Country, 2026 – 2033
- China
- Japan
- South Korea
- Market Size (US$ Mn) Analysis and Volume (Units) Analysis and Forecast, By Product, 2026 – 2033
- Large
- Regular
- Slim
- Ultra-slim
- Extra-large
- Market Size (US$ Mn) Analysis and Forecast, By Usage, 2026 – 2033
- Bedside Procedures
- Emergency Rooms
- Bronchoscopy Suites
- ICUs
- Market Size (US$ Mn) Analysis and Forecast, By Indication, 2026 – 2033
- Lung Cancer
- Pulmonary Infections
- Interstitial Lung Disease
- Tuberculosis
- COPD
- Cystic Fibrosis
- Market Size (US$ Mn) Analysis and Forecast, By End User, 2026 – 2033
- Hospitals
- Ambulatory Surgical Centers (ASCs)
- Specialty Clinics
- Diagnostic Centers
- Market Attractiveness Analysis
- South Asia & Oceania Single-Use Bronchoscopes Market Outlook:
- Key Highlights
- Historical Market Size (US$ Mn) Analysis, By Market, 2020 – 2025
- By Country
- By Product
- By Usage
- By Indication
- By End User
- Market Size (US$ Mn) Analysis and Forecast, By Country, 2026 – 2033
- India
- Southeast Asia
- ANZ
- Rest of South Asia & Oceania
- Market Size (US$ Mn) Analysis and Volume (Units) Analysis and Forecast, By Product, 2026 – 2033
- Large
- Regular
- Slim
- Ultra-slim
- Extra-large
- Market Size (US$ Mn) Analysis and Forecast, By Usage, 2026 – 2033
- Bedside Procedures
- Emergency Rooms
- Bronchoscopy Suites
- ICUs
- Market Size (US$ Mn) Analysis and Forecast, By Indication, 2026 – 2033
- Lung Cancer
- Pulmonary Infections
- Interstitial Lung Disease
- Tuberculosis
- COPD
- Cystic Fibrosis
- Market Size (US$ Mn) Analysis and Forecast, By End User, 2026 – 2033
- Hospitals
- Ambulatory Surgical Centers (ASCs)
- Specialty Clinics
- Diagnostic Centers
- Market Attractiveness Analysis
- Latin America Single-Use Bronchoscopes Market Outlook:
- Key Highlights
- Historical Market Size (US$ Mn) Analysis, By Market, 2020 – 2025
- By Country
- By Product
- By Usage
- By Indication
- By End User
- Market Size (US$ Mn) Analysis and Forecast, By Country, 2026 – 2033
- Brazil
- Mexico
- Rest of Latin America
- Market Size (US$ Mn) Analysis and Volume (Units) Analysis and Forecast, By Product, 2026 – 2033
- Large
- Regular
- Slim
- Ultra-slim
- Extra-large
- Market Size (US$ Mn) Analysis and Forecast, By Usage, 2026 – 2033
- Bedside Procedures
- Emergency Rooms
- Bronchoscopy Suites
- ICUs
- Market Size (US$ Mn) Analysis and Forecast, By Indication, 2026 – 2033
- Lung Cancer
- Pulmonary Infections
- Interstitial Lung Disease
- Tuberculosis
- COPD
- Cystic Fibrosis
- Market Size (US$ Mn) Analysis and Forecast, By End User, 2026 – 2033
- Hospitals
- Ambulatory Surgical Centers (ASCs)
- Specialty Clinics
- Diagnostic Centers
- Market Attractiveness Analysis
- Middle East & Africa Single-Use Bronchoscopes Market Outlook:
- Key Highlights
- Historical Market Size (US$ Mn) Analysis, By Market, 2020 – 2025
- By Country
- By Product
- By Usage
- By Indication
- By End User
- Market Size (US$ Mn) Analysis and Forecast, By Country, 2026 – 2033
- GCC Countries
- Egypt
- South Africa
- Northern Africa
- Rest of Middle East & Africa
- Market Size (US$ Mn) Analysis and Volume (Units) Analysis and Forecast, By Product, 2026 – 2033
- Large
- Regular
- Slim
- Ultra-slim
- Extra-large
- Market Size (US$ Mn) Analysis and Forecast, By Usage, 2026 – 2033
- Bedside Procedures
- Emergency Rooms
- Bronchoscopy Suites
- ICUs
- Market Size (US$ Mn) Analysis and Forecast, By Indication, 2026 – 2033
- Lung Cancer
- Pulmonary Infections
- Interstitial Lung Disease
- Tuberculosis
- COPD
- Cystic Fibrosis
- Market Size (US$ Mn) Analysis and Forecast, By End User, 2026 – 2033
- Hospitals
- Ambulatory Surgical Centers (ASCs)
- Specialty Clinics
- Diagnostic Centers
- Market Attractiveness Analysis
- Competition Landscape
- Market Structure
- Competition Intensity Mapping By Market
- Competition Dashboard
- Company Profiles (Details – Overview, Recent Developments)
- AMBU A/S
- Overview
- Segments and Product & End User
- Key Financials
- Market Developments
- Market Strategy
- Boston Scientific Corporation
- Fujifilm Holdings Corporation
- Karl Storz GmbH & Co. KG
- NeoScope Inc.
- Olympus Corporation
- Boston Scientific Corporation
- PENTAX Medical
- Karl Storz SE & Co.
- Endoso Life
- Innovex Medical Co., Ltd.
- Hunan Vathin Medical Instrument Co., Ltd.
- Zhejiang Geyi Medical Instrument Co., Ltd.
- Others
- AMBU A/S
- Market Structure
- Appendix
- Research Methodology
- Research Assumptions
- Acronyms and Abbreviations


- Medical Devices
- Single-use Bronchoscopes Market
Single-use Bronchoscopes Market Size, Share, Growth, and Regional Forecast, 2026 to 2033
Global Single-use Bronchoscopes Market by Product (Large, Regular, Slim, Ultra-slim, and Extra-large), by Usage (Bedside Procedures, Emergency Rooms, Bronchoscopy Suites, and ICUs), by Indication (Lung Cancer, Pulmonary Infections, Interstitial Lung Disease, Tuberculosis, COPD, and Cystic Fibrosis) by End User (Hospitals, Ambulatory Surgical Centers (ASCs), Specialty Clinics, and Diagnostic Centers), and Regional Analysis from 2026 to 2033
Single-use Bronchoscopes Market Size and Trends Analysis
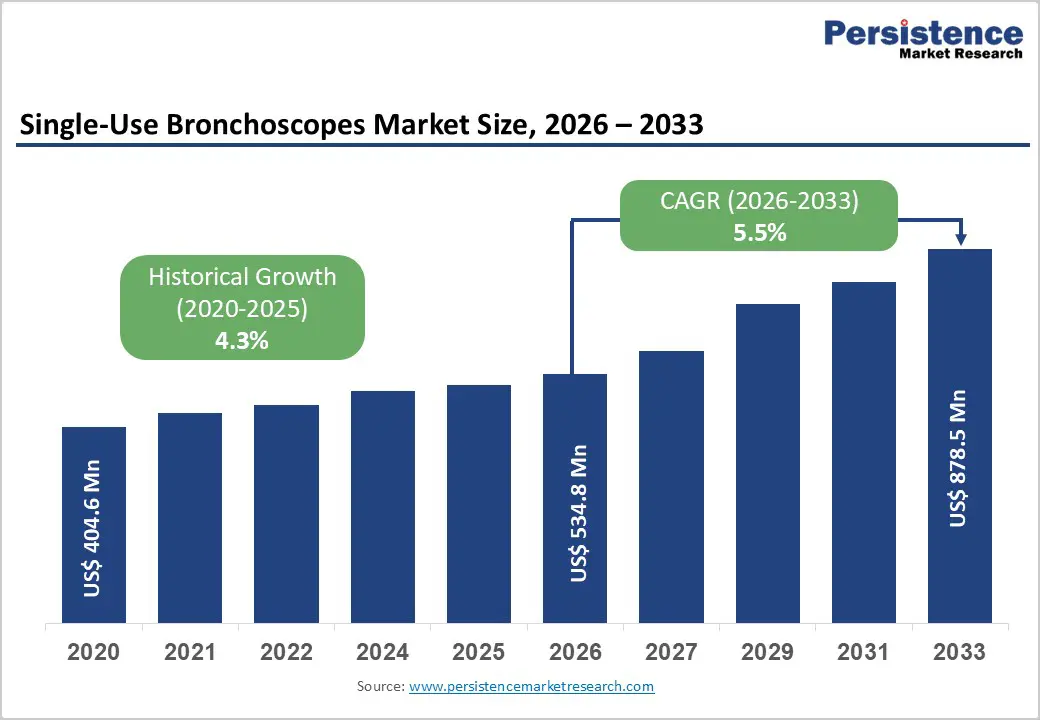
The global single-use bronchoscopes market size is estimated to grow from US$ 534.8 Mn in 2026 to US$ 878.5 Mn by 2033. The market is projected to record a CAGR of 5.5% during the forecast period from 2026 to 2033.
Global demand for single-use bronchoscopes is rising steadily, driven by the increasing prevalence of respiratory disorders such as COPD, lung cancer, pulmonary infections, and interstitial lung disease, along with growing preference for minimally invasive, infection-controlled procedures. Expanding use of single-use bronchoscopes across hospitals, specialty clinics, outpatient centers, and intensive care units is supporting sustained market growth. Higher volumes of diagnostic and interventional procedures, improved clinician awareness, and rising patient preference for safer, single-patient devices are further accelerating demand. In addition, increasing healthcare expenditure and enhanced access to advanced bronchoscopy technologies are enabling broader adoption across both developed and emerging markets. Continuous innovation in imaging quality, scope flexibility, portability, and digital data integration is enhancing procedural accuracy, ease of use, and clinical efficiency. The growing focus on point-of-care bronchoscopy, outpatient-based procedures, and digitally connected clinical workflows is further propelling the global single-use bronchoscopes market.
Key Industry Highlights
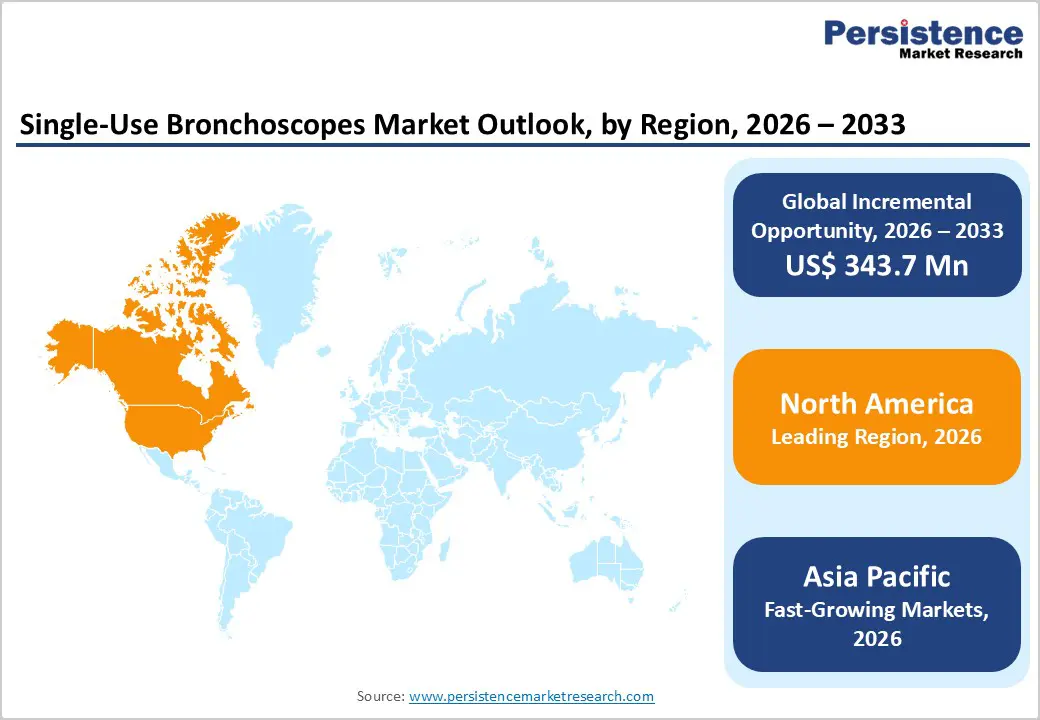
- Leading Region: North America holds the largest share at 46.7%, supported by advanced healthcare infrastructure, high adoption of minimally invasive respiratory diagnostics, early uptake of portable and connected bronchoscopy solutions, and strong presence of leading medical device manufacturers.
- Fastest-Growing Region: Asia Pacific is expanding fastest due to large undiagnosed respiratory patient populations, rapid growth of diagnostic and specialty centers, improving healthcare access, and rising investments in outpatient and home-based care.
- Leading Product Segment: Regular dominates the market due to their ease of use, portability, and widespread application in routine bronchoscopy across clinical settings. Fastest-Growing Product Segment: Large scopes are expanding rapidly as demand increases for point-of-care testing, outpatient bronchoscopy, and decentralized healthcare delivery.
- Leading Indication Segment: COPD remains the top application, driven by high global prevalence and routine use of single-use bronchoscopes for initial diagnosis and monitoring.
- Fastest-Growing Indication Segment: Lung cancer is scaling quickly as clinical awareness rises and single-use bronchoscopes become central to non-invasive diagnostic procedures and interventional management.
| Global Market Attributes | Key Insights |
|---|---|
| Single-use Bronchoscopes Market Size (2026E) | US$ 534.8 Mn |
| Market Value Forecast (2033F) | US$ 878.5 Mn |
| Projected Growth (CAGR 2026 to 2033) | 5.5% |
| Historical Market Growth (CAGR 2020 to 2025) | 4.3% |
Market Dynamics
Driver – Rising Burden of Respiratory Disorders and Preference for Minimally Invasive Procedures
Increasing prevalence of chronic respiratory diseases is a key factor propelling adoption of single-use bronchoscopes globally. Conditions such as chronic obstructive pulmonary disease (COPD), lung cancer, pulmonary infections, and interstitial lung disease are being diagnosed more frequently due to aging populations, environmental pollution, and heightened clinical awareness. Clinicians increasingly favor single-use bronchoscopes as they offer a minimally invasive, patient-friendly alternative to traditional reusable devices, reducing the risk of cross-contamination. These devices also allow rapid and reliable airway evaluation, making them suitable for both routine diagnostic procedures and follow-up assessments in hospitals, specialty clinics, and outpatient care settings.
Technological advancements are further enhancing their appeal. High-definition imaging, integrated suction channels, and improved maneuverability increase procedural accuracy. Lightweight, portable designs facilitate point-of-care bronchoscopy and enable rapid deployment in intensive care units or emergency settings. Growing emphasis on early detection of pulmonary disorders, preventive care, and decentralized diagnostics is boosting demand. Continuous innovation in device ergonomics, digital connectivity for real-time monitoring, and disposable components for infection control are contributing to sustained market expansion, supporting the preference for single-use solutions in both developed and emerging healthcare systems.
Restraints – High Equipment Costs and Operational Challenges
Several factors limit the broader adoption of single-use bronchoscopes in routine clinical practice. The relatively high initial cost of advanced disposable bronchoscopes, particularly those with high-definition imaging, integrated sensors, and multi-channel functionality, can deter smaller hospitals, outpatient clinics, and emerging market facilities. In cost-conscious healthcare environments, budget limitations often delay procurement or encourage continued use of reusable scopes, which may offer lower short-term expenses. Recurring expenditures for disposable consumables, including scope sheaths, suction tubing, and sterile accessories, further increase operational costs.
Operational considerations also constrain adoption. Effective bronchoscopy requires trained clinicians to operate the scope, manage airway interventions, and interpret findings accurately. Procedure success can be influenced by patient factors, such as airway anatomy, cooperation, and respiratory stability. Limited availability of trained personnel in certain regions may restrict routine use, especially in smaller clinics or outpatient settings. Additionally, variability in procedural protocols across institutions and inconsistent reimbursement policies can discourage widespread deployment. These economic and logistical challenges particularly affect adoption in resource-limited regions, moderating overall market growth despite rising clinical demand.
Opportunity – Expansion of Point-of-Care, Ambulatory, and Digitally Connected Bronchoscopy Solutions
Decentralized respiratory diagnostics are creating significant opportunities for single-use bronchoscopes. Increasing demand for point-of-care bronchoscopy in hospitals, intensive care units, and ambulatory surgical centers supports adoption of portable and compact disposable devices. These systems facilitate quicker procedures, reduce patient transfers, and enhance workflow efficiency, particularly in high-volume or urgent care settings. Growing interest in outpatient and home-based respiratory monitoring is also extending the scope of single-use bronchoscopes, especially for chronic conditions that require frequent airway assessments or follow-up interventions.
Technological integration is driving additional growth potential. Connectivity features, including cloud-based data storage, digital imaging platforms, and real-time teleconsultation capabilities, enable seamless sharing of procedural data with remote specialists. Advancements in high-resolution imaging, flexible maneuverability, and ergonomic design improve diagnostic accuracy while minimizing clinician fatigue. Emerging markets offer untapped potential due to expanding healthcare infrastructure, rising awareness of pulmonary health, and increasing physician preference for disposable devices. Government initiatives promoting infection control, preventive respiratory care, and outpatient service expansion further strengthen the opportunity landscape. As hospitals and clinics adopt patient-centric and digitally integrated care models, innovative, portable, and connected single-use bronchoscopic solutions are positioned for sustained growth over the coming years.
Category-wise Analysis
By Product, Regular Leads Due to High Procedure Volumes and Point-of-Care Preference
The regular segment is projected to dominate the global single-use bronchoscopes market in 2026, capturing a revenue share of 34.8%. This leadership is driven by widespread use of regular-sized bronchoscopes across hospitals, specialty clinics, and diagnostic centers for routine and high-volume procedures. Regular scopes are favored for their portability, ease of use, and suitability for point-of-care settings, enabling quick diagnostics and patient throughput. They are extensively employed in bronchoscopy procedures for COPD, pulmonary infections, and interstitial lung disease, covering both adult and pediatric patients. Growing demand for minimally invasive diagnostics, expansion of outpatient and ambulatory care, and increasing preference for single-use devices to prevent cross-contamination further reinforce their dominance. Continuous product innovation, including enhanced imaging quality, ergonomic designs, digital result capture, and integrated sensor technology, is also contributing to sustained leadership of the regular product segment. The combination of convenience, safety, and adaptability ensures that this segment remains the most widely adopted in clinical practice.
By Indication, COPD Dominates Due to High Prevalence and Routine Screening
The COPD segment is expected to lead the global single-use bronchoscopes market in 2026, accounting for a 29.5% revenue share. This dominance is attributed to the high global prevalence of COPD, particularly in aging populations and regions with high smoking rates. Single-use bronchoscopes are routinely employed for diagnosis, monitoring, and intervention in COPD management due to their non-invasive nature, reduced infection risk, and suitability for both inpatient and outpatient procedures. Regular and repeat procedures, including bronchoalveolar sampling and airway evaluation, drive recurring utilization of disposable scopes. Increasing awareness of respiratory health, growing physician recommendations for early detection, and the need for accurate differentiation from other pulmonary disorders further reinforce this segment’s leading market position. Rising adoption of point-of-care procedures, integration with digital data platforms, and advancements in scope imaging and maneuverability enhance clinical efficiency, supporting sustained preference for COPD-related applications in hospitals, specialty clinics, and diagnostic centers globally.
By End User, Hospitals Lead Due to High Procedure Volumes and Specialized Respiratory Infrastructure
The hospitals segment is projected to dominate the global single-use bronchoscopes market in 2026, capturing a 48.2% revenue share. Hospitals lead due to their high volume of bronchoscopic procedures, presence of specialized pulmonary and respiratory departments, and access to trained clinicians capable of performing both routine and complex interventions. Inpatient and outpatient hospital services generate steady demand for single-use bronchoscopes, including applications in COPD, lung cancer, and pulmonary infections. Hospitals benefit from long-term procurement contracts, ensuring recurring purchases of disposable scopes and associated consumables. Adoption is reinforced by standardized diagnostic protocols, growing patient awareness, and increasing focus on infection control and single-patient usage workflows. The segment’s leadership is further strengthened by rising hospital admissions for respiratory conditions, increased integration of point-of-care diagnostics, and investment in advanced imaging technologies. Hospitals’ ability to perform high-throughput procedures with minimal cross-contamination risk ensures continued dominance in end-user adoption globally.
Region-wise Insights
North America Single-use Bronchoscopes Market Trends
North America is expected to dominate the global single-use bronchoscopes market with a value share of 46.7% in 2026, led primarily by the United States. The region benefits from a well-established healthcare infrastructure, high adoption of advanced patient monitoring technologies, and strong prevalence of cardiovascular and neurological disorders. Hospitals and diagnostic centers across North America routinely deploy ECG, EEG, and EMG systems, driving consistent demand for high-quality medical electrodes. The region also demonstrates early adoption of wearable health technologies and remote patient monitoring solutions, further expanding electrode utilization beyond traditional hospital settings.
Favorable reimbursement frameworks for diagnostic and monitoring procedures support widespread use of premium and disposable electrodes. Additionally, the strong presence of leading medical device manufacturers, continuous product innovation, and rigorous quality standards enhance market penetration. Ongoing investments in digital health, telemedicine expansion, and home healthcare services are further reinforcing market growth. Well-defined regulatory pathways and strong clinician awareness ensure sustained dominance of the North American market.
Europe Single-use Bronchoscopes Market Trends
The Europe single-use bronchoscopes market is expected to grow steadily, supported by an aging population, increasing prevalence of chronic cardiovascular and neurological conditions, and rising demand for diagnostic monitoring. Countries such as Germany, the U.K., France, Italy, and the Nordic nations exhibit consistent utilization of medical electrodes due to strong public healthcare systems and broad access to diagnostic services. Growing awareness of preventive healthcare and early disease detection is driving routine ECG and neurological monitoring across hospitals and outpatient settings.
Europe is also witnessing increased adoption of disposable electrodes to meet stringent infection control and patient safety standards. Technological advancements in electrode materials, including hypoallergenic and long-wear designs, are improving patient compliance and clinical outcomes. Supportive regulatory policies for medical device innovation, combined with expanding healthcare budgets, continue to facilitate market growth. Integration of digital monitoring platforms, standardized clinical protocols, and expanding home healthcare services further enhance adoption across the region.
Asia Pacific Single-use Bronchoscopes Market Trends
The Asia Pacific single-use bronchoscopes market is expected to register a relatively higher CAGR of around 8.7% between 2026 and 2033, driven by rapid expansion of healthcare infrastructure and increasing diagnostic volumes. Large patient populations, rising incidence of cardiovascular diseases, and growing awareness of neurological disorders are fueling demand across China, India, Japan, and South Korea. Improving access to hospital-based diagnostics, expanding private healthcare facilities, and rising penetration of diagnostic imaging and monitoring equipment are accelerating electrode adoption.
Government initiatives aimed at strengthening healthcare delivery, increasing insurance coverage, and modernizing hospitals are further supporting market growth. In addition, cost-sensitive markets are driving demand for affordable and locally manufactured electrode solutions. Growing adoption of telemedicine, remote patient monitoring, and wearable health devices is expanding use in home healthcare settings. Strategic expansion by global manufacturers, localization of production, and increasing clinician training are strengthening long-term growth prospects across the Asia Pacific region.
Market Competitive Landscape
The global single-use bronchoscopes market is highly competitive, with strong participation from AMBU A/S, Boston Scientific Corporation, Fujifilm Holdings Corporation, Karl Storz GmbH & Co. KG, and NeoScope Inc. These players leverage global distribution networks, strong brand presence, and continuous innovation in imaging technologies, scope flexibility, sensors, and device portability to serve diverse respiratory diagnostic and interventional applications.
Rising demand for minimally invasive procedures, higher prevalence of chronic respiratory diseases, and growing point-of-care adoption are driving innovation. Manufacturers focus on compact, portable bronchoscopes, disposable components, enhanced patient comfort, and digital connectivity, while prioritizing hospital partnerships, emerging market expansion, and sustained R&D for advanced, user-friendly solutions.
Key Industry Developments:
- In January 2026, FUJIFILM Healthcare Europe launched the EB-710US balloonless ultrasonic bronchoscope in Europe, the latest addition to its PulmoSolutions portfolio, featuring a compact ultrasonic transducer and CMOS sensor to provide enhanced imaging and endoscopic visualization for improved lung cancer detection.
- In October 2025, Olympus Corporation issued a voluntary global corrective action to provide additional guidance on the safe use of bronchoscopes with laser therapy, argon plasma coagulation, or high-frequency cauterization during therapeutic procedures in the tracheobronchial tree.
- In July 2022, Ambu Inc. announced that its Ambu® aScope™ 5 Broncho series of single-use, sterile bronchoscopes obtained 510(k) clearance from the U.S. Food and Drug Administration (FDA), enabling broader clinical adoption across hospitals and outpatient settings for safe, single-patient respiratory procedures.
Companies Covered in Single-use Bronchoscopes Market
- AMBU A/S
- Boston Scientific Corporation
- Fujifilm Holdings Corporation
- Karl Storz GmbH & Co. KG
- NeoScope Inc.
- Olympus Corporation
- Boston Scientific Corporation
- PENTAX Medical
- Karl Storz SE & Co.
- Endoso Life
- Innovex Medical Co., Ltd.
- Hunan Vathin Medical Instrument Co., Ltd.
- Zhejiang Geyi Medical Instrument Co., Ltd.
- Others
Frequently Asked Questions
The global single-use bronchoscopes market is projected to be valued at US$ 534.8 Mn in 2026.
The primary drivers are the rising prevalence of chronic respiratory diseases (e.g., COPD, lung cancer, infections) and the increasing focus on infection control to reduce cross-contamination risks, coupled with technological advancements and the shift toward minimally invasive procedures.
The global single-use bronchoscopes market is poised to witness a CAGR of 5.5%between 2026 and 2033.
Growing healthcare infrastructure in emerging markets and innovations like biodegradable/recyclable devices and AI-enhanced diagnostics present major opportunities.
AMBU A/S, Boston Scientific Corporation, Fujifilm Holdings Corporation, Karl Storz GmbH & Co. KG, and NeoScope Inc., are some of the key players in the single-use bronchoscopes market.


