

- Executive Summary
- Global Renal Anemia Treatment Market Snapshot, 2026 and 2033
- Market Opportunity Assessment, 2026 - 2033, US$ Bn
- Key Market Trends
- Future Market Projections
- Premium Market Insights
- Industry Developments and Key Market Events
- PMR Analysis and Recommendations
- Market Overview
- Market Scope and Definition
- Market Dynamics
- Drivers
- Restraints
- Opportunity
- Key Trends
- Macro-Economic Factors
- Global Sectorial Outlook
- Global GDP Growth Outlook
- COVID-19 Impact Analysis
- Forecast Factors - Relevance and Impact
- Value Added Insights
- Product Adoption Analysis
- Recent Product Launches
- Regulatory Landscape
- Value Chain Analysis
- Key Deals and Mergers
- PESTLE Analysis
- Porter’s Five Force Analysis
- Price Trend Analysis, 2020 - 2033
- Key Highlights
- Key Factors Impacting Test Type Prices
- Pricing Analysis, By Treatment Type Type
- Regional Prices and Test Type Preferences
- Global Renal Anemia Treatment Market Outlook:
- Key Highlights
- Market Size (US$ Bn) and Y-o-Y Growth
- Absolute $ Opportunity
- Market Size (US$ Bn) Analysis and Forecast
- Historical Market Size (US$ Bn) Analysis, 2020-2025
- Market Size (US$ Bn) Analysis and Forecast, 2026-2033
- Global Renal Anemia Treatment Market Outlook: Treatment Type
- Introduction / Key Findings
- Historical Market Size (US$ Bn) Analysis and Volume (Units) Analysis, By Treatment Type, 2020 - 2025
- Market Size (US$ Bn) Analysis and Volume (Units) Analysis and Forecast, By Treatment Type, 2026 - 2033
- Erythropoiesis-Stimulating Agents (ESAs)
- HIF-PH inhibitors
- Iron Supplements
- Others
- Market Attractiveness Analysis: By Treatment Type
- Global Renal Anemia Treatment Market Outlook: Disease Type
- Introduction / Key Findings
- Historical Market Size (US$ Bn) Analysis and Volume (Units) Analysis, By Disease Type, 2020 - 2025
- Market Size (US$ Bn) Analysis and Volume (Units) Analysis and Forecast, By Disease Type, 2026 - 2033
- Normocytic Anemia
- Microcytic Anemia
- Macrocytic Anemia
- Market Attractiveness Analysis: By Disease Type
- Global Renal Anemia Treatment Market Outlook: Route of Administration
- Introduction / Key Findings
- Historical Market Size (US$ Bn) Analysis and Volume (Units) Analysis, By Route of Administration, 2020 - 2025
- Market Size (US$ Bn) Analysis and Volume (Units) Analysis and Forecast, By Route of Administration, 2026 - 2033
- Oral
- Injectable
- Market Attractiveness Analysis: By Route of Administration
- Global Renal Anemia Treatment Market Outlook: End User
- Introduction / Key Findings
- Historical Market Size (US$ Bn) Analysis, By End User, 2020 - 2025
- Market Size (US$ Bn) Analysis and Forecast, By End User, 2026 - 2033
- Hospitals
- Specialty Clinics
- Others
- Market Attractiveness Analysis: End User
- Key Highlights
- Global Renal Anemia Treatment Market Outlook: Region
- Key Highlights
- Historical Market Size (US$ Bn) Analysis, By Region, 2020 - 2025
- Market Size (US$ Bn) Analysis and Forecast, By Region, 2026 - 2033
- North America
- Europe
- East Asia
- South Asia and Oceania
- Latin America
- Middle East & Africa
- Market Attractiveness Analysis: Region
- North America Renal Anemia Treatment Market Outlook:
- Key Highlights
- Historical Market Size (US$ Bn) Analysis, By Market, 2020 - 2025
- By Country
- By Treatment Type
- By Disease Type
- By Route of Administration
- By End User
- Market Size (US$ Bn) Analysis and Forecast, By Country, 2026 - 2033
- U.S.
- Canada
- Market Size (US$ Bn) Analysis and Volume (Units) Analysis and Forecast, By Treatment Type, 2026 - 2033
- Erythropoiesis-Stimulating Agents (ESAs)
- HIF-PH inhibitors
- Iron Supplements
- Others
- Market Size (US$ Bn) Analysis and Forecast, By Disease Type, 2026 - 2033
- Normocytic Anemia
- Microcytic Anemia
- Macrocytic Anemia
- Market Size (US$ Bn) Analysis and Forecast, By Route of Administration, 2026 - 2033
- Oral
- Injectable
- Market Size (US$ Bn) Analysis and Forecast, By End User, 2026 - 2033
- Hospitals
- Specialty Clinics
- Others
- Market Attractiveness Analysis
- Europe Renal Anemia Treatment Market Outlook:
- Key Highlights
- Historical Market Size (US$ Bn) Analysis, By Market, 2020 - 2025
- By Country
- By Treatment Type
- By Disease Type
- By Route of Administration
- By End User
- Market Size (US$ Bn) Analysis and Forecast, By Country, 2026 - 2033
- Germany
- France
- U.K.
- Italy
- Spain
- Russia
- Rest of Europe
- Market Size (US$ Bn) Analysis and Volume (Units) Analysis and Forecast, By Treatment Type, 2026 - 2033
- Erythropoiesis-Stimulating Agents (ESAs)
- HIF-PH inhibitors
- Iron Supplements
- Others
- Market Size (US$ Bn) Analysis and Forecast, By Disease Type, 2026 - 2033
- Normocytic Anemia
- Microcytic Anemia
- Macrocytic Anemia
- Market Size (US$ Bn) Analysis and Forecast, By Route of Administration, 2026 - 2033
- Oral
- Injectable
- Market Size (US$ Bn) Analysis and Forecast, By End User, 2026 - 2033
- Hospitals
- Specialty Clinics
- Others
- Market Attractiveness Analysis
- East Asia Renal Anemia Treatment Market Outlook:
- Key Highlights
- Historical Market Size (US$ Bn) Analysis, By Market, 2020 - 2025
- By Country
- By Treatment Type
- By Disease Type
- By Route of Administration
- By End User
- Market Size (US$ Bn) Analysis and Forecast, By Country, 2026 - 2033
- China
- Japan
- South Korea
- Market Size (US$ Bn) Analysis and Volume (Units) Analysis and Forecast, By Treatment Type, 2026 - 2033
- Erythropoiesis-Stimulating Agents (ESAs)
- HIF-PH inhibitors
- Iron Supplements
- Others
- Market Size (US$ Bn) Analysis and Forecast, By Disease Type, 2026 - 2033
- Normocytic Anemia
- Microcytic Anemia
- Macrocytic Anemia
- Market Size (US$ Bn) Analysis and Forecast, By Route of Administration, 2026 - 2033
- Oral
- Injectable
- Market Size (US$ Bn) Analysis and Forecast, By End User, 2026 - 2033
- Hospitals
- Specialty Clinics
- Others
- Market Attractiveness Analysis
- South Asia & Oceania Renal Anemia Treatment Market Outlook:
- Key Highlights
- Historical Market Size (US$ Bn) Analysis, By Market, 2020 - 2025
- By Country
- By Treatment Type
- By Disease Type
- By Route of Administration
- By End User
- Market Size (US$ Bn) Analysis and Forecast, By Country, 2026 - 2033
- India
- Southeast Asia
- ANZ
- Rest of South Asia & Oceania
- Market Size (US$ Bn) Analysis and Volume (Units) Analysis and Forecast, By Treatment Type, 2026 - 2033
- Erythropoiesis-Stimulating Agents (ESAs)
- HIF-PH inhibitors
- Iron Supplements
- Others
- Market Size (US$ Bn) Analysis and Forecast, By Disease Type, 2026 - 2033
- Normocytic Anemia
- Microcytic Anemia
- Macrocytic Anemia
- Market Size (US$ Bn) Analysis and Forecast, By Route of Administration, 2026 - 2033
- Oral
- Injectable
- Market Size (US$ Bn) Analysis and Forecast, By End User, 2026 - 2033
- Hospitals
- Specialty Clinics
- Others
- Market Attractiveness Analysis
- Latin America Renal Anemia Treatment Market Outlook:
- Key Highlights
- Historical Market Size (US$ Bn) Analysis, By Market, 2020 - 2025
- By Country
- By Treatment Type
- By Disease Type
- By Route of Administration
- By End User
- Market Size (US$ Bn) Analysis and Forecast, By Country, 2026 - 2033
- Brazil
- Mexico
- Rest of Latin America
- Market Size (US$ Bn) Analysis and Volume (Units) Analysis and Forecast, By Treatment Type, 2026 - 2033
- Erythropoiesis-Stimulating Agents (ESAs)
- HIF-PH inhibitors
- Iron Supplements
- Others
- Market Size (US$ Bn) Analysis and Forecast, By Disease Type, 2026 - 2033
- Normocytic Anemia
- Microcytic Anemia
- Macrocytic Anemia
- Market Size (US$ Bn) Analysis and Forecast, By Route of Administration, 2026 - 2033
- Oral
- Injectable
- Market Size (US$ Bn) Analysis and Forecast, By End User, 2026 - 2033
- Hospitals
- Specialty Clinics
- Others
- Market Attractiveness Analysis
- Middle East & Africa Renal Anemia Treatment Market Outlook:
- Key Highlights
- Historical Market Size (US$ Bn) Analysis, By Market, 2020 - 2025
- By Country
- By Treatment Type
- By Disease Type
- By Route of Administration
- By End User
- Market Size (US$ Bn) Analysis and Volume (Units) Analysis and Forecast, By Treatment Type, 2026 - 2033
- Erythropoiesis-Stimulating Agents (ESAs)
- HIF-PH inhibitors
- Iron Supplements
- Others
- Market Size (US$ Bn) Analysis and Forecast, By Disease Type, 2026 - 2033
- Normocytic Anemia
- Microcytic Anemia
- Macrocytic Anemia
- Market Size (US$ Bn) Analysis and Forecast, By Route of Administration, 2026 - 2033
- Oral
- Injectable
- Market Size (US$ Bn) Analysis and Forecast, By End User, 2026 - 2033
- Hospitals
- Specialty Clinics
- Others
- Market Attractiveness Analysis
- Competition Landscape
- Market Structure
- Competition Intensity Mapping By Market
- Competition Dashboard
- Company Profiles (Details - Overview, Recent Developments)
- Johnson & Johnson
- Overview
- Segments and Test Type & End User
- Key Financials
- Market Developments
- Market Strategy
- AstraZeneca
- Amgen Inc.
- GSK plc.
- Pfizer Inc.
- F. Hoffmann-La Roche Ltd
- Sanofi
- Fresenius Medical Care AG
- PHARMACOSMOS A/S
- Kyowa Kirin Co., Ltd.
- Rockwell Medical, Inc.
- Akebia Therapeutics.
- Azurity Pharmaceuticals, Inc.
- Others
- Johnson & Johnson
- Market Structure
- Appendix
- Research Methodology
- Research Assumptions
- Acronyms and Abbreviations


- Pharmaceuticals
- Renal Anemia Treatment Market
Renal Anemia Treatment Market Size, Share, Growth, and Regional Forecast, 2026 to 2033
Renal Anemia Treatment Market by Test Type (Treponemal Serology, and Non-Treponemal Serology), by End User (Hospitals, Specialty Clinics, Diagnostic Laboratories, Academic & Research Institutes), and Regional Analysis from 2026 to 2033
Key Industry Highlights
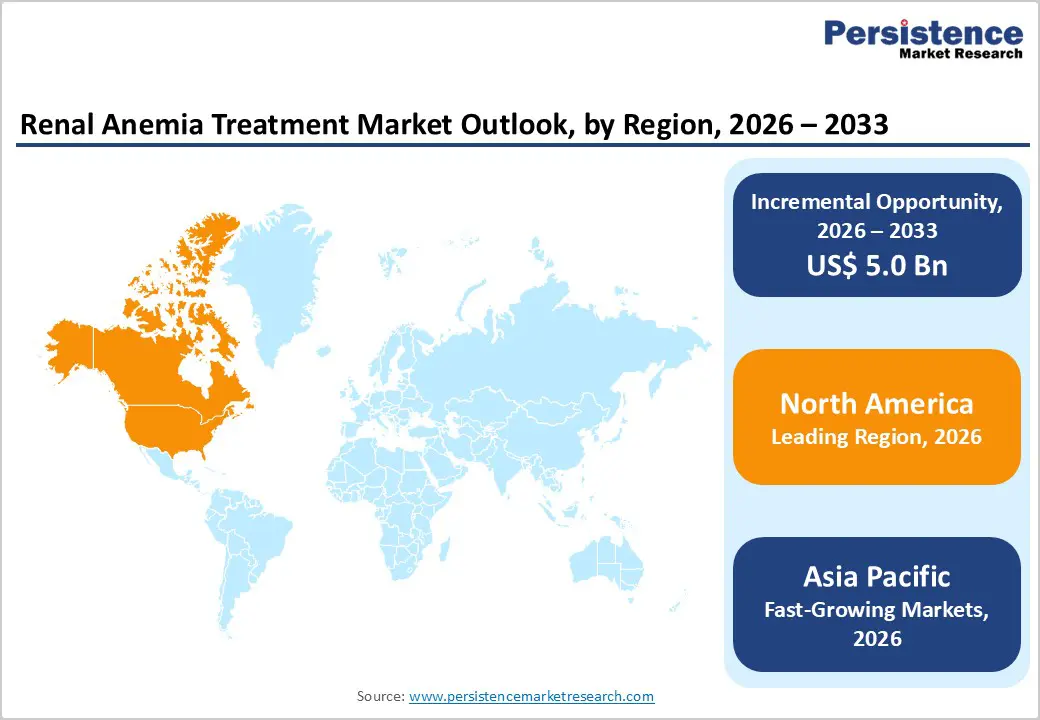
- Leading Region: North America holds the largest share at 46.3%, supported by advanced renal-care infrastructure, strong adoption of ESAs and IV iron therapies, high healthcare expenditure, and early access to FDA-approved renal anemia treatment technologies.
- Fastest-Growing Region: Asia Pacific is expanding the fastest due to a large CKD patient pool, rapid modernization of dialysis facilities, increasing medical tourism, and growing investments in renal-care capacity.
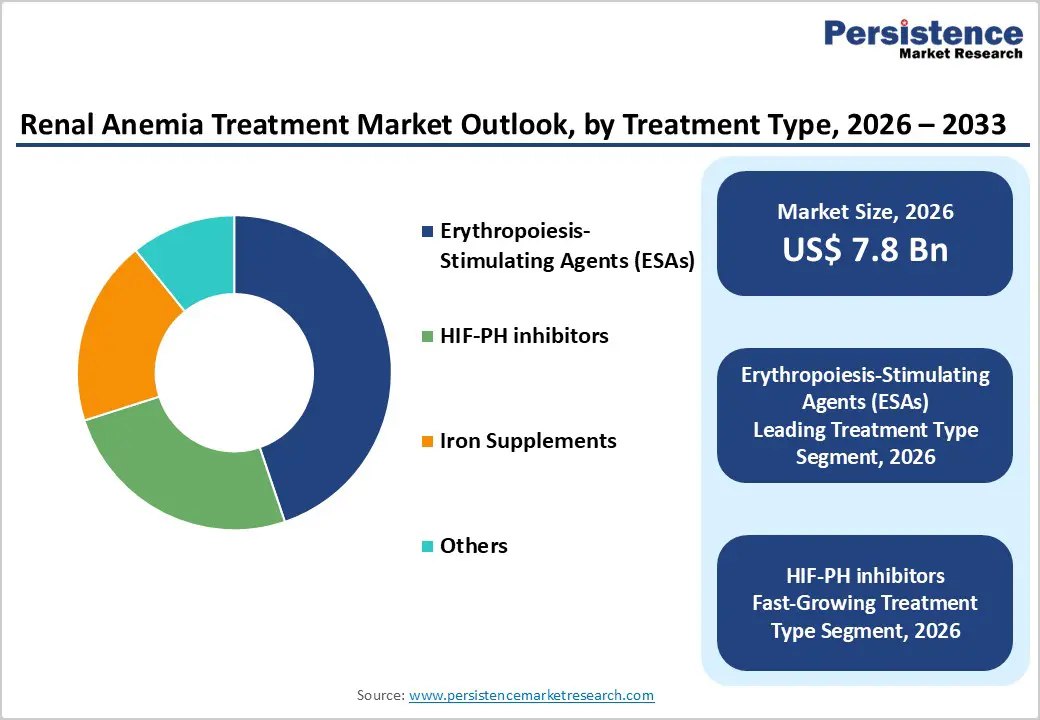
- Leading Treatment Type Segment: Erythropoiesis-stimulating agents (ESAs) dominate the market due to their extensive use in screening and confirmatory algorithms, offering high specificity and long-term serological sensitivity.
- Fastest-Growing Treatment Type Segment: HIF-PH inhibitors grow rapidly as rising CKD prevalence supports broader use of oral, non-injectable alternatives for anemia correction and improved patient adherence.
- Leading Route of Administration Segment: Oral remains the top application, driven by rising use of oral HIF-PH inhibitors, strong preference for non-invasive treatment, and expanding integration into early-stage CKD management.
- Fastest-Growing Route of Administration Segment: Injectable therapies are scaling quickly as demand increases for IV iron products, biologic ESAs, dialysis-center administration, and advanced treatment for moderate-to-severe anemia.
| Global Market Attributes | Key Insights |
|---|---|
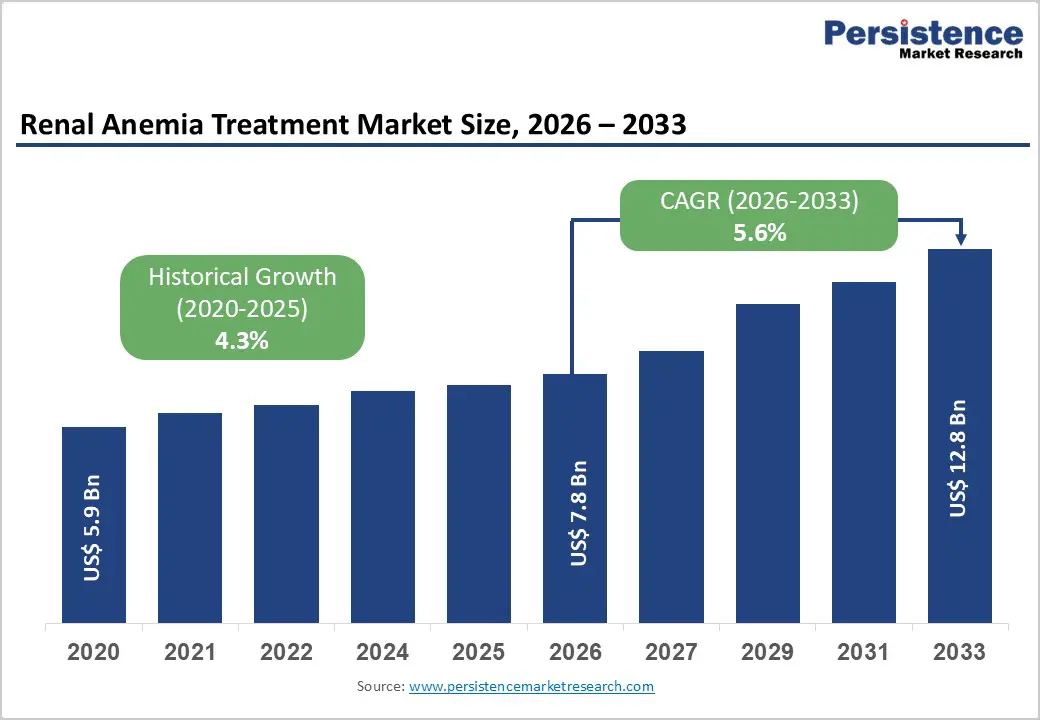
| Renal Anemia Treatment Market Size (2026E) | US$ 7.8 Bn |
| Market Value Forecast (2033F) | US$ 12.8 Bn |
| Projected Growth (CAGR 2026 to 2033) | 5.6% |
| Historical Market Growth (CAGR 2020 to 2025) | 4.3% |
Market Dynamics
Driver - Rising CKD Burden and Advancements in Anemia Therapeutics
The renal anemia treatment market is strongly propelled by the dual impact of the rising global chronic kidney disease (CKD) burden and rapid advancements in anemia therapeutics, particularly ESAs and HIF-PH inhibitors. CKD prevalence continues to climb due to escalating rates of diabetes, hypertension, obesity, and aging populations, significantly expanding the pool of patients requiring anemia management across stages 3-5 and dialysis settings. For instance, in 2023, the Institute for Health Metrics and Evaluation (IHME) estimated that global cases of kidney failure requiring treatment (KFRT) reached 4.59 million across all ages and both sexes, corresponding to an age-standardized prevalence of 50.7 cases per 100,000 population. As impaired erythropoietin production becomes more pronounced with CKD progression, demand for clinically effective correction therapies has intensified. In parallel, therapeutic innovation is reshaping treatment paradigms. Long-acting erythropoiesis-stimulating agents (ESAs) are improving dosing convenience, enhancing hemoglobin stability, and reducing the need for frequent injections in dialysis patients.
Additionally, orally administered hypoxia-inducible factor prolyl hydroxylase (HIF-PH) inhibitors are transforming treatment accessibility for non-dialysis CKD populations by offering an alternative to injectable ESAs, supporting better adherence and reduced transfusion dependency. Their mechanisms promote endogenous erythropoietin production, improve iron utilization, and address inflammation-associated anemia. Together, the accelerating CKD epidemic and expanding therapeutic landscape are driving sustained demand for advanced renal anemia interventions across global healthcare systems.
Restraints - High Therapy Costs and Safety Concerns Limiting Optimal ESA Utilization
The renal anemia treatment market faces significant restraints due to the combined impact of high therapy costs and safety-related limitations associated with erythropoiesis-stimulating agents (ESAs). The premium pricing of biologic ESAs and newer oral HIF-PH inhibitors places a substantial financial burden on healthcare systems, particularly in low- and middle-income countries where reimbursement mechanisms are limited. As CKD prevalence rises, the cumulative cost of long-term anemia management often requiring lifelong therapy further strains budgets, reducing accessibility among underserved populations.
Moreover, concerns over cardiovascular risks linked to aggressive ESA dosing constrain clinical decision-making. Evidence suggesting heightened risks of stroke, thromboembolic events, and hypertension at higher hemoglobin targets has led to more conservative dosing protocols. These safety considerations limit physicians’ ability to escalate therapy, particularly in elderly patients and those with multiple comorbidities. As a result, many CKD patients remain undertreated or require therapy modifications that slow hemoglobin correction. Together, the dual challenge of high treatment costs and stringent safety constraints creates barriers to widespread adoption, particularly in resource-limited settings, and underscores the need for cost-effective alternatives and improved risk-stratified treatment algorithms.
Opportunity - Emerging Therapeutic, Infrastructure, and Technology-Driven Opportunities Expanding Market Potential
The renal anemia treatment market is poised for strong growth as multiple high-value opportunities converge across therapeutic innovation, healthcare infrastructure development, and digital transformation. The growing adoption of oral HIF-PH inhibitors represents one of the most significant opportunities, particularly as these therapies increasingly penetrate the large non-dialysis CKD population that historically faced limited treatment options. Their oral administration, improved tolerability, and ability to stimulate endogenous erythropoietin production position them as a major driver of future market expansion.
Furthermore, emerging economies are witnessing rapid investment in dialysis infrastructure, driven by rising CKD prevalence, public-private partnerships, and government-supported renal-care programs. This expansion is increasingly translating into strong demand for ESAs, IV iron formulations, and supportive anemia-management protocols across new dialysis facilities. Complementing these advancements, the development of personalized and AI-driven anemia management platforms is unlocking a new frontier in precision nephrology. AI-enabled hemoglobin monitoring, predictive modeling, and adaptive dosing algorithms enhance treatment accuracy, reduce variability in patient response, and optimize resource utilization. Together, these therapeutic, infrastructural, and digital opportunities create a multi-dimensional growth landscape that will significantly boost the global renal anemia treatment market.
Category-wise Analysis
By Treatment Type, Erythropoiesis-Stimulating Agents (ESAs) Dominate Globally Owing to Their Proven Clinical Efficacy and Widespread Use in CKD-Related Anemia
The erythropoiesis-stimulating agents (ESAs) segment is projected to dominate the global renal anemia treatment market in 2026, accounting for a significant revenue share of 44.80%. This leadership is driven by the widespread clinical adoption of ESAs as the standard of care for anemia associated with chronic kidney disease (CKD), particularly among dialysis and late-stage CKD patients. Their ability to effectively elevate hemoglobin levels, reduce transfusion requirements, and provide consistent dosing options supports broad utilization across hospital and outpatient nephrology settings. Continued innovation in long-acting ESA formulations, integration with dialysis workflows, and strong clinical guideline recommendations further accelerate adoption. Increasing CKD prevalence, expanding dialysis capacity, and long-term safety data continue to reinforce ESAs’ dominant position in global renal anemia management.
By Disease Type, Normocytic Anemia Dominates Globally Owing to High Prevalence in CKD and Strong Clinical Focus on Early Management
The normocytic anemia segment is projected to dominate the global renal anemia treatment market in 2026, accounting for a significant revenue share of 42.7%. This dominance stems from the fact that normocytic anemia is the most common anemia type associated with CKD, resulting from impaired erythropoietin production and chronic inflammation. Its widespread incidence across stages 3-5 CKD drives substantial clinical demand for ESAs, IV iron therapies, and emerging HIF-PH inhibitors. Consistent diagnosis through routine renal function testing, strong guideline-supported intervention strategies, and well-established treatment pathways further support higher adoption rates. Growing CKD patient populations, rising diabetes and hypertension prevalence, and early intervention emphasis in nephrology programs reinforce the strong market positioning of the normocytic anemia segment.
By End User, Hospitals Dominate Globally Due to Their Advanced Renal-Care Infrastructure and High Treatment Volume
The hospitals segment is projected to dominate the global renal anemia treatment market in 2026, capturing a revenue share of 56.7%. Hospitals particularly tertiary-care centers, nephrology units, and academic medical institutions serve as primary hubs for renal anemia diagnosis and treatment due to their ability to manage complex CKD cases, administer ESAs and IV iron therapies, and support comprehensive dialysis services. High patient inflow, availability of specialized nephrologists, and integration of advanced renal-care technologies contribute to strong hospital-based demand. Additionally, hospitals play a central role in CKD screening, guideline-based anemia management, and clinical research evaluating emerging HIF-PH inhibitors and iron formulations. Their extensive capacity, multidisciplinary care environment, and critical role in managing end-stage renal disease solidify hospitals as the leading end-user segment globally.
Region-wise Insights
North America Renal Anemia Treatment Market Trends
North America is expected to maintain global dominance in the renal anemia treatment market with a market share value of 46.3%, supported by its advanced healthcare infrastructure, strong CKD management programs, and widespread adoption of ESAs, IV iron therapies, and emerging HIF-PH inhibitors. The U.S. leads the region due to frequent FDA approvals of new renal anemia therapeutics, strong presence of leading biopharmaceutical manufacturers, and extensive collaborations between dialysis centers, hospitals, and academic research institutions. Major nephrology networks continuously evaluate new ESA formulations, IV iron products, and oral HIF-PH inhibitors, accelerating clinical integration. Rising demand for early CKD-stage anemia management and decentralized care delivery continues to drive investments from large healthcare systems.
The region also benefits from strong reimbursement frameworks for CKD and dialysis services, high clinician preference for long-acting ESAs and advanced iron therapies, and expanding adoption of oral HIF-PH inhibitors. Increasing investment in dialysis infrastructure, digital care coordination platforms, and AI-supported renal disease management tools is improving treatment efficiency. Additionally, rising public awareness of CKD progression and expanding nephrology research hubs continue to strengthen North America’s long-term leadership in the global renal anemia treatment market.
Europe Renal Anemia Treatment Market Trends
Europe shows steady and mature adoption of renal anemia treatment solutions, supported by strong public-health policies, well-established dialysis networks, and stringent clinical management guidelines across major markets such as Germany, the U.K., France, Italy, Switzerland, and the Nordic region. Robust epidemiological surveillance systems and consistent clinical validation of new therapies support the deployment of ESAs, IV iron formulations, and HIF-PH inhibitors across primary and specialty care. The region demonstrates high integration of automated drug delivery systems, standardized anemia protocols, and evidence-based CKD management pathways, driven by the need to improve hemoglobin stability and reduce transfusion dependency.
Europe’s favorable regulatory framework, emphasis on safety and efficacy, and strong contributions from clinical research centers support the evaluation of next-generation renal anemia therapeutics. Growing demand for cost-effective long-acting ESAs, improved iron therapies, and orally administered HIF-PH inhibitors continues to strengthen uptake. Regional pharmaceutical manufacturers are investing in formulation innovation, GMP-compliant production, and sustainable supply chains. Government initiatives supporting CKD screening, early anemia intervention, and digital treatment monitoring further drive Europe’s overall market growth.
Asia Pacific Renal Anemia Treatment Market Trends
Asia Pacific is projected to be the fastest-growing region for renal anemia treatment with a CAGR of 7.6%, driven by rising healthcare expenditure, increasing CKD burden, and rapid expansion of dialysis centers. Countries such as China, Japan, South Korea, Singapore, and India are increasing adoption of ESAs, IV iron therapies, and new HIF-PH inhibitors across hospitals, nephrology clinics, and government healthcare programs. Growing availability of cost-effective biologics and generic formulations, combined with strong participation from regional pharmaceutical manufacturers, is improving affordability and expanding access across mid-sized hospitals and community settings.
Government-supported CKD screening programs, investments in dialysis infrastructure, and partnerships with global biopharma firms for technology transfer are accelerating adoption. Increasing need for early anemia detection, streamlined CKD management, and oral therapy options is driving strong clinical uptake. Nephrologists across Asia Pacific are increasingly participating in global kidney disease research networks, adopting advanced treatment protocols to reduce disease progression. Expanding private healthcare networks, rising medical tourism, and the growth of specialized renal-care institutes continue to support robust market growth across the region.
Market Competitive Landscape
The global renal anemia treatment market is highly competitive, with active participation from Johnson & Johnson, AstraZeneca, Amgen Inc., GSK plc., and Pfizer Inc. These companies leverage strong nephrology portfolios and extensive biologics capabilities to expand their presence across dialysis centers and hospital networks. Growing CKD prevalence continues to drive the adoption of ESAs, HIF-PH inhibitors, and advanced iron therapies.
Manufacturers are prioritizing long-acting ESAs, oral HIF-PH inhibitors, and enhanced iron formulations, while focusing on regulatory approvals, scaled production, and partnerships with healthcare systems to improve treatment access and support market expansion.
Key Industry Developments:
- In August 2025, Akebia Therapeutics and Innovative Renal Care announced the broad rollout of Vafseo (vadadustat) across all IRC dialysis clinics in the U.S. for treating anemia in CKD patients. The partnership expands access to an oral HIF-PH inhibitor therapy, reinforcing the growing shift toward convenient, next-generation anemia management options in dialysis settings.
- In February 2023, GSK’s Jesduvroq (daprodustat) received U.S. FDA approval as the first oral HIF-PH inhibitor for CKD-related anemia in dialysis patients. It is the first new renal anemia therapy in over 30 years and offers a convenient once-daily oral alternative to injectable ESAs, strengthening the shift toward innovative, patient-friendly treatment options.
- In April 2023, Drogsan submitted both the Marketing Authorization and GMP applications for Triferic AVNU to the Turkish Medicines and Medical Devices Agency, receiving priority and high-priority review status. With accelerated evaluation in place, Rockwell expects approval in 2024. Drogsan remains responsible for all regulatory and commercialization activities in Turkey.
Companies Covered in Renal Anemia Treatment Market
- Johnson & Johnson
- AstraZeneca
- Amgen Inc.
- GSK plc.
- Pfizer Inc.
- F. Hoffmann-La Roche Ltd
- Sanofi
- Fresenius Medical Care AG
- PHARMACOSMOS A/S
- Kyowa Kirin Co., Ltd.
- Rockwell Medical, Inc.
- Akebia Therapeutics.
- Azurity Pharmaceuticals, Inc.
- Others
Frequently Asked Questions
The global renal anemia treatment market is projected to be valued at US$ 7.8 Bn in 2026.
Rising chronic kidney disease (CKD) prevalence, expanding dialysis population, and increasing adoption of ESAs and novel HIF-PH inhibitors. drive the global renal anemia treatment market.
The global renal anemia treatment market is poised to witness a CAGR of 5.6% between 2026 and 2033.
Growing uptake of oral HIF-PH inhibitors, emerging CKD patient pools in developing regions, and innovation in long-acting anemia therapeutics are creating opportunities in the market.
Johnson & Johnson, AstraZeneca, Amgen Inc., GSK plc. and Pfizer Inc. are some of the key players in the renal anemia treatment market.


