

- Executive Summary
- Global Refractive Optical Elements Market Snapshot 2026 and 2033
- Market Opportunity Assessment, 2026-2033, US$ Bn
- Key Market Trends
- Industry Developments and Key Market Events
- Demand Side and Supply Side Analysis
- PMR Analysis and Recommendations
- Market Overview
- Market Scope and Definitions
- Value Chain Analysis
- Macro-Economic Factors
- Global GDP Outlook
- Global Telecommunications Industry Overview
- Global Electronics & Semiconductor Industry Overview
- Global Consumer Electronics Industry Overview
- Forecast Factors – Relevance and Impact
- COVID-19 Impact Assessment
- PESTLE Analysis
- Porter's Five Forces Analysis
- Geopolitical Tensions: Market Impact
- Regulatory and Technology Landscape
- Market Dynamics
- Drivers
- Restraints
- Opportunities
- Trends
- Price Trend Analysis, 2020 – 2033
- Region-wise Price Analysis
- Price by Segments
- Price Impact Factors
- Global Refractive Optical Elements Market Outlook: Historical (2020 – 2025) and Forecast (2026 – 2033)
- Key Highlights
- Global Refractive Optical Elements Market Outlook: Product Type
- Introduction/Key Findings
- Historical Market Size (US$ Bn) Analysis by Product Type, 2020-2025
- Current Market Size (US$ Bn) Forecast, by Product Type, 2026-2033
- Micro Lens Array
- Refractive Homogenizer
- Market Attractiveness Analysis: Product Type
- Global Refractive Optical Elements Market Outlook: Industry
- Introduction/Key Findings
- Historical Market Size (US$ Bn) Analysis by Industry, 2020-2025
- Current Market Size (US$ Bn) Forecast, by Industry, 2026-2033
- Electronics and Semiconductor
- Telecommunication
- Healthcare
- Power and Energy
- Others
- Market Attractiveness Analysis: Industry
- Global Refractive Optical Elements Market Outlook: Application
- Introduction/Key Findings
- Historical Market Size (US$ Bn) Analysis by Application, 2020-2025
- Current Market Size (US$ Bn) Forecast, by Application, 2026-2033
- Semiconductor Manufacturing
- LIDAR
- Laser Material Processing
- Lighting
- Medicine (Laser Treatment)
- Displays & Projectors
- Metrology
- Fiber and Waveguide Coupler
- Others
- Market Attractiveness Analysis: Application
- Global Refractive Optical Elements Market Outlook: Region
- Key Highlights
- Historical Market Size (US$ Bn) Analysis by Region, 2020-2025
- Current Market Size (US$ Bn) Forecast, by Region, 2026-2033
- North America
- Europe
- East Asia
- South Asia & Oceania
- Latin America
- Middle East & Africa
- Market Attractiveness Analysis: Region
- North America Refractive Optical Elements Market Outlook: Historical (2020 – 2025) and Forecast (2026 – 2033)
- Key Highlights
- Pricing Analysis
- North America Market Size (US$ Bn) Forecast, by Country, 2026-2033
- U.S.
- Canada
- North America Market Size (US$ Bn) Forecast, by Product Type, 2026-2033
- Micro Lens Array
- Refractive Homogenizer
- North America Market Size (US$ Bn) Forecast, by Industry, 2026-2033
- Electronics and Semiconductor
- Telecommunication
- Healthcare
- Power and Energy
- Others
- North America Market Size (US$ Bn) Forecast, by Application, 2026-2033
- Semiconductor Manufacturing
- LIDAR
- Laser Material Processing
- Lighting
- Medicine (Laser Treatment)
- Displays & Projectors
- Metrology
- Fiber and Waveguide Coupler
- Others
- Europe Refractive Optical Elements Market Outlook: Historical (2020 – 2025) and Forecast (2026 – 2033)
- Key Highlights
- Pricing Analysis
- Europe Market Size (US$ Bn) Forecast, by Country, 2026-2033
- Germany
- Italy
- France
- U.K.
- Spain
- Russia
- Rest of Europe
- Europe Market Size (US$ Bn) Forecast, by Product Type, 2026-2033
- Micro Lens Array
- Refractive Homogenizer
- Europe Market Size (US$ Bn) Forecast, by Industry, 2026-2033
- Electronics and Semiconductor
- Telecommunication
- Healthcare
- Power and Energy
- Others
- Europe Market Size (US$ Bn) Forecast, by Application, 2026-2033
- Semiconductor Manufacturing
- LIDAR
- Laser Material Processing
- Lighting
- Medicine (Laser Treatment)
- Displays & Projectors
- Metrology
- Fiber and Waveguide Coupler
- Others
- East Asia Refractive Optical Elements Market Outlook: Historical (2020 – 2025) and Forecast (2026 – 2033)
- Key Highlights
- Pricing Analysis
- East Asia Market Size (US$ Bn) Forecast, by Country, 2026-2033
- China
- Japan
- South Korea
- East Asia Market Size (US$ Bn) Forecast, by Product Type, 2026-2033
- Micro Lens Array
- Refractive Homogenizer
- East Asia Market Size (US$ Bn) Forecast, by Industry, 2026-2033
- Electronics and Semiconductor
- Telecommunication
- Healthcare
- Power and Energy
- Others
- East Asia Market Size (US$ Bn) Forecast, by Application, 2026-2033
- Semiconductor Manufacturing
- LIDAR
- Laser Material Processing
- Lighting
- Medicine (Laser Treatment)
- Displays & Projectors
- Metrology
- Fiber and Waveguide Coupler
- Others
- South Asia & Oceania Refractive Optical Elements Market Outlook: Historical (2020 – 2025) and Forecast (2026 – 2033)
- Key Highlights
- Pricing Analysis
- South Asia & Oceania Market Size (US$ Bn) Forecast, by Country, 2026-2033
- India
- Southeast Asia
- ANZ
- Rest of SAO
- South Asia & Oceania Market Size (US$ Bn) Forecast, by Product Type, 2026-2033
- Micro Lens Array
- Refractive Homogenizer
- South Asia & Oceania Market Size (US$ Bn) Forecast, by Industry, 2026-2033
- Electronics and Semiconductor
- Telecommunication
- Healthcare
- Power and Energy
- Others
- South Asia & Oceania Market Size (US$ Bn) Forecast, by Application, 2026-2033
- Semiconductor Manufacturing
- LIDAR
- Laser Material Processing
- Lighting
- Medicine (Laser Treatment)
- Displays & Projectors
- Metrology
- Fiber and Waveguide Coupler
- Others
- Latin America Refractive Optical Elements Market Outlook: Historical (2020 – 2025) and Forecast (2026 – 2033)
- Key Highlights
- Pricing Analysis
- Latin America Market Size (US$ Bn) Forecast, by Country, 2026-2033
- Brazil
- Mexico
- Rest of LATAM
- Latin America Market Size (US$ Bn) Forecast, by Product Type, 2026-2033
- Micro Lens Array
- Refractive Homogenizer
- Latin America Market Size (US$ Bn) Forecast, by Industry, 2026-2033
- Electronics and Semiconductor
- Telecommunication
- Healthcare
- Power and Energy
- Others
- Latin America Market Size (US$ Bn) Forecast, by Application, 2026-2033
- Semiconductor Manufacturing
- LIDAR
- Laser Material Processing
- Lighting
- Medicine (Laser Treatment)
- Displays & Projectors
- Metrology
- Fiber and Waveguide Coupler
- Others
- Middle East & Africa Refractive Optical Elements Market Outlook: Historical (2020 – 2025) and Forecast (2026 – 2033)
- Key Highlights
- Pricing Analysis
- Middle East & Africa Market Size (US$ Bn) Forecast, by Country, 2026-2033
- GCC Countries
- South Africa
- Northern Africa
- Rest of MEA
- Middle East & Africa Market Size (US$ Bn) Forecast, by Product Type, 2026-2033
- Micro Lens Array
- Refractive Homogenizer
- Middle East & Africa Market Size (US$ Bn) Forecast, by Industry, 2026-2033
- Electronics and Semiconductor
- Telecommunication
- Healthcare
- Power and Energy
- Others
- Middle East & Africa Market Size (US$ Bn) Forecast, by Application, 2026-2033
- Semiconductor Manufacturing
- LIDAR
- Laser Material Processing
- Lighting
- Medicine (Laser Treatment)
- Displays & Projectors
- Metrology
- Fiber and Waveguide Coupler
- Others
- Competition Landscape
- Market Share Analysis, 2025
- Market Structure
- Competition Intensity Mapping
- Competition Dashboard
- Company Profiles
- Jenoptik AG
- Company Overview
- Product Portfolio/Offerings
- Key Financials
- SWOT Analysis
- Company Strategy and Key Developments
- SÜSS MicroTec SE
- HOLO/OR Ltd.
- Broadcom Inc.
- Sintec Optronics Pte Ltd.
- LightTrans GmbH
- RPC Photonics
- SILIOS Technologies
- Axetris AG
- Fraunhofer IOF
- Nalux Co., Ltd.
- Ricoh Company Ltd.
- Chineselens Optical Components
- Shanghai Optics Inc.
- Holographix LLC
- Jenoptik AG
- Appendix
- Research Methodology
- Research Assumptions
- Acronyms and Abbreviations


- Display Technologies
- Refractive Optical Elements Market
Refractive Optical Elements Market Size, Share, and Growth Forecast, 2026- 2033
Refractive Optical Elements Market by Product Type (Micro Lens Array, and Refractive Homogenizer), by Application (Semiconductor Manufacturing, LIDAR, Laser Material Processing, Lighting, Medicine (Laser Treatment), Displays & Projectors, Metrology Fiber and Waveguide Coupler, and Others) by Industry (Electronics and Semiconductor, Telecommunication, Healthcare, Power and Energy, and Others) and Regional Analysis for 2026 – 2033.
Refractive Optical Elements Market Size and Trends Analysis
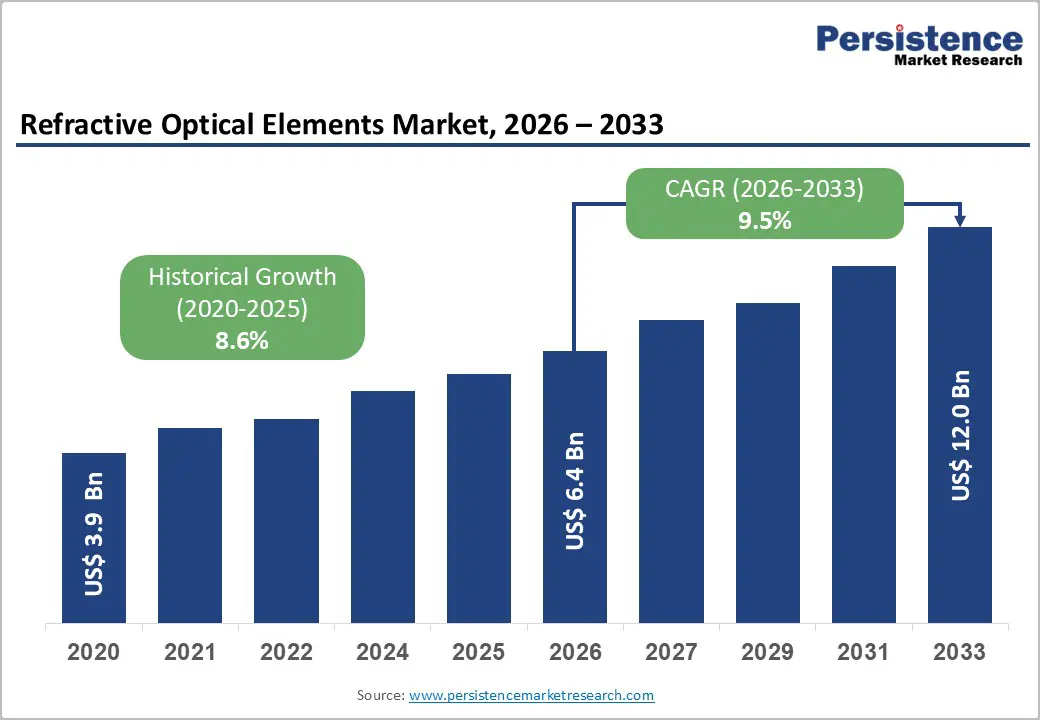
The global Refractive Optical Elements market size was valued at US$ 3.9 billion in 2020, reached US$ 6.4 billion by 2026, and is projected to reach US$ 12 billion by 2033, growing at a CAGR of 9.5% between 2026 and 2033. This robust expansion is driven by accelerating semiconductor manufacturing capabilities, the rapid proliferation of LiDAR technologies in autonomous vehicles, and increasing adoption of precision optical systems across telecommunications and healthcare sectors. The historical CAGR of 8.6% (2020-2026) demonstrates consistent market momentum, with growth acceleration expected through 2033 as emerging applications in advanced display technologies and industrial metrology mature. Market fundamentals reflect sustained capital investment in optical precision engineering and digital transformation initiatives across manufacturing ecosystems globally.
Key Industry Highlights:
- Product Type Analysis: Paper towels dominate product segmentation at 25%+ revenue share, while toilet paper emerges as the fastest-growing category at 23.2% CAGR, reflecting consumer preference diversification and emerging market consumption growth.
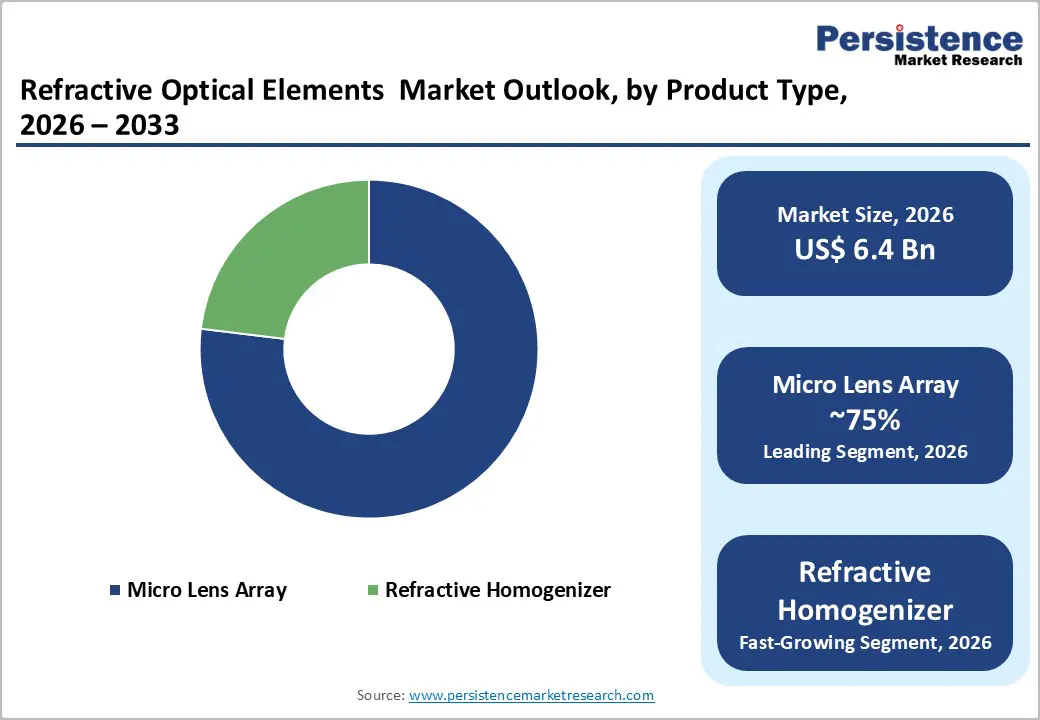
- Dominant Product and Application Segments: Micro-lens arrays command 75%+ revenue share as established market leader, while refractive homogenizers demonstrate fastest growth at 10.4% CAGR. Semiconductor manufacturing dominates application demand (30%+ share), with LiDAR technology emerging as fastest-growing segment at 10.6% CAGR driven by autonomous vehicle and robotics commercialization.
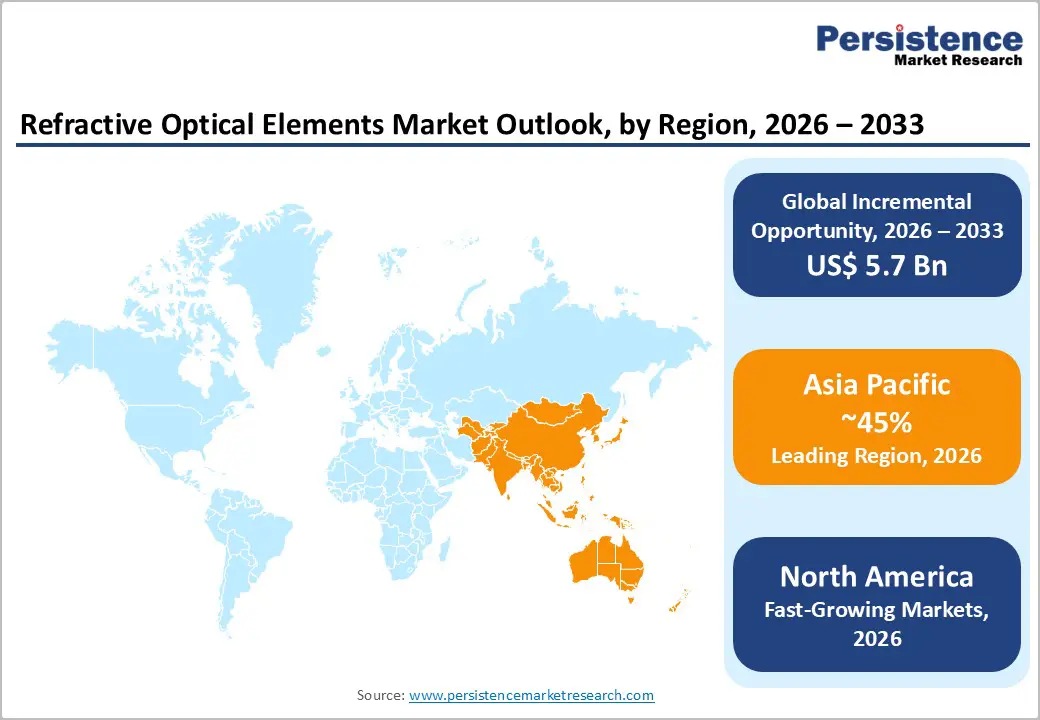
- Industry and Regional Leadership: Electronics and semiconductor industry commands 35%+ market share with sustained growth, while telecommunication sector emerges as fastest-growing industry (10.3% CAGR). Asia Pacific dominates regional market with 45%+ global revenue share, while North America demonstrates fastest regional growth at 10.7% CAGR through 2033.
- Strategic Growth Catalysts: Semiconductor manufacturing capacity expansion (US$ 200+ billion global capital investment), autonomous vehicle technology proliferation (10+ million cumulative units projected by 2033), and telecommunications infrastructure modernization (US$ 450+ billion annual capital expenditure) represent primary market growth drivers through 2033.
- Emerging Application Opportunities: Augmented reality and virtual reality display advancement, medical device laser technology innovation, and industrial metrology smart manufacturing integration represent combined addressable market opportunities exceeding US$ 1.8-2.2 billion through 2033, contingent on technology commercialization and regulatory approval advancement.
- Competitive and Strategic Developments: Market demonstrates moderate consolidation with leading manufacturers (Zeiss, Corning, Hamamatsu, Thorlabs) commanding 35-45% collective share, supported by significant recent capital investments (US$ 150+ million facility expansions), strategic acquisitions expanding application addressability, and technology partnerships supporting emerging market development.
| Key Insights | Details |
|---|---|
|
Refractive Optical Elements Market Size (2026E) |
US$ 6.4 Bn |
|
Market Value Forecast (2033F) |
US$ 12.0 Bn |
|
Projected Growth (CAGR 2026 to 2033) |
9.5% |
|
Historical Market Growth (CAGR 2020 to 2025) |
8.6% |
Key Growth Drivers
Semiconductor Manufacturing Expansion and Advanced Chip Production
The semiconductor industry's transition to sub-7nm process nodes represents the primary catalyst for refractive optical elements demand. Advanced chip fabrication requires precision optical systems for photolithography and laser processing, where micro-lens arrays and refractive homogenizers ensure precise beam shaping and uniformity. According to industry manufacturing reports, global semiconductor capital expenditure exceeded US$ 200 billion in 2024, with optical precision components representing 8-12% of process equipment costs. The semiconductor manufacturing segment currently commands over 30% of total market revenue and continues expanding as fabrication plants in Asia Pacific (Taiwan, South Korea, China) and North America (Arizona, Texas) invest heavily in next-generation capacity. This expansion directly correlates with refractive optical element adoption, as manufacturers require enhanced optical precision to achieve yield improvements and process uniformity on advanced wafers exceeding 300mm diameter specifications.
Market Restraining Factors
High Manufacturing Costs and Complex Production Processes
Manufacturing refractive optical elements requires advanced precision engineering capabilities and specialized equipment, resulting in significant capital investment and operational costs. Production of micro-lens arrays and refractive homogenizers involves precision molding, polishing, and coating processes with tolerance specifications measured in micrometers, limiting manufacturing accessibility to specialized vendors. High tooling costs (US$ 500,000-2 million per optical mold) and extended development timelines (12-18 months) create substantial barriers to entry for new manufacturers. Quality assurance requirements mandate rigorous testing protocols and metrology systems, increasing per-unit production costs by 15-25% compared to conventional optical elements. These structural cost barriers constrain price competitiveness, particularly in price-sensitive segments and developing market regions, potentially limiting market penetration in cost-conscious applications and emerging economies.
Refractive Optical Elements Market Trends and Opportunities
Augmented Reality (AR) and Virtual Reality (VR) Display Advancement
Consumer and enterprise AR/VR markets represent emerging application segments with substantial growth potential, estimated at 8-12% CAGR through 2033. Refractive optical elements enable advanced wavefront control, beam steering, and display optics essential for next-generation AR glasses and VR headsets targeting mass-market adoption. Current AR/VR market size approaches US$ 30 billion (2024), with projections exceeding US$ 100 billion by 2033.
Major technology companies (Meta, Apple, Microsoft, Sony) are investing US$ 5-10 billion annually in spatial computing initiatives requiring advanced optical components. Refractive optical elements enable reduced form factors, improved optical efficiency, and enhanced image quality critical for consumer acceptance of wearable AR/VR devices. This application segment represents untapped market potential of US$ 800 million-1.2 billion in incremental refractive optical element demand through 2033.
Refractive Optical Elements Market Insights and Trends
Product Type Insights
Micro Lens Arrays Dominate Market While Refractive Homogenizers Drive Accelerated Growth
Product type analysis indicates that micro lens arrays represent the dominant segment of the market, accounting for more than 75% of total revenue. Their leadership is supported by long-established applications across semiconductor manufacturing, LiDAR systems, and telecommunications infrastructure. Micro lens arrays play a critical role in enabling precise beam shaping, wavefront correction, and efficient optical signal distribution, particularly in high-volume manufacturing environments. The segment’s strong market position reflects its technological maturity, well-developed global supply chains, and widespread adoption by semiconductor device manufacturers and optical system integrators. In 2026, the market valuation for micro lens arrays is estimated at approximately US$ 4.8 billion, with future growth expected to closely track the overall market CAGR of 9.5% through 2033.
In contrast, refractive homogenizers constitute the fastest-growing product segment, recording a CAGR of 10.4%. Growth is driven by rising demand in advanced laser material processing, professional lighting systems, and emerging LiDAR and optical metrology applications. These products deliver superior beam uniformity and optimized intensity distribution, making them increasingly attractive for high-precision environments where conventional optics fall short. Ongoing technology maturation, declining production costs, and expanding application scope are accelerating adoption. The refractive homogenizer segment is valued at around US$ 1.6 billion in 2026 and is projected to reach US$ 3.2–3.5 billion by 2033 as commercialization and manufacturing scale improve.
Raw Material Insights
Semiconductor Leadership and Rapid LiDAR Expansion Reshape Refractive Optics Application Landscape
Semiconductor manufacturing represents the largest application segment, accounting for over 30% of total market revenue, underscoring the indispensable role of precision refractive optical systems in advanced chip fabrication. As the industry moves toward sub-7 nm and next-generation process nodes, semiconductor device manufacturers increasingly rely on high-performance refractive optics for photolithography, laser-based material processing, inspection, and metrology. These optical components are critical for achieving tighter feature resolution, higher yields, and improved process control. The segment’s dominance is further reinforced by the capital-intensive nature of semiconductor manufacturing, the high per-unit value of optical components, and a relatively concentrated customer base consisting of leading integrated device manufacturers and global foundries with long-term procurement commitments.
In contrast, LiDAR technology is emerging as the fastest-growing application, registering a CAGR of 10.6%. Growth is driven by rising adoption of autonomous and semi-autonomous vehicles, expanding robotics deployments, and increasing use of 3D sensing in consumer electronics. LiDAR manufacturers are specifying advanced refractive optics to optimize beam steering, enhance wavelength-specific performance, and enable compact system designs. The rapid expansion of LiDAR beyond premium automotive segments into mass-market vehicles, industrial automation, and consumer applications is expected to expand the addressable market by more than 500% by 2033, significantly reshaping demand dynamics.
Distribution Channel Insights
Electronics Dominance and Rapid Telecom Expansion Driving Advanced Optical Component Demand
The electronics and semiconductor industry accounts for more than 35% of total market revenue, highlighting its dominant role in driving demand for advanced optical components. This leadership stems from concentrated requirements among semiconductor device manufacturers, integrated circuit producers, and advanced electronics system integrators. These customers typically demand high-performance, precision-engineered optical components to support increasingly complex manufacturing processes and miniaturized electronic architectures. High capital intensity, stringent performance specifications, and continuous innovation cycles further reinforce the segment’s dominance, as optical systems play a critical role in lithography, inspection, sensing, and advanced packaging applications. Ongoing technological progress in electronics ensures sustained investment in next-generation optical solutions to enhance efficiency, accuracy, and production yields.
In contrast, the telecommunications industry represents the fastest-growing segment, registering a CAGR of 10.3%. Growth is driven by large-scale fiber-optic infrastructure upgrades, global 5G rollout, and early-stage 6G research initiatives. Telecom operators and equipment manufacturers are increasingly investing in optical technologies that enable data transmission speeds exceeding 800 Gbps per fiber pair. Achieving such performance requires highly precise refractive optics to maximize coupling efficiency and maintain signal integrity. This rapid expansion reflects a strategic shift toward fiber-based networks and emerging digital service models, positioning telecommunications as a key long-term growth engine for advanced optical components.
Regional Insights and Trends
Asia Pacific Leads Optical Components Through Semiconductor Strength and Expanding Technology Ecosystems
Asia Pacific holds a dominant position in the global market, accounting for more than 45% of total revenue, primarily due to its strong semiconductor manufacturing base and rapidly expanding optical component ecosystem. The region benefits from the concentration of advanced semiconductor fabrication capacity in countries such as Taiwan, South Korea, and China, where leading players including Taiwan Semiconductor Manufacturing Company, Samsung Semiconductor, and Intel together represent over 60% of global advanced-node production capacity. This manufacturing strength directly supports high-volume adoption of refractive optical elements in semiconductor equipment.
In parallel, Asia Pacific leads in LiDAR technology adoption, driven by autonomous vehicle programs in China and growing robotics applications across Japan and Singapore. Significant investments in telecommunications infrastructure further reinforce demand, as large-scale 5G rollouts across China, India, and ASEAN countries accelerate the need for fiber-optic components. Growth dynamics vary by sub-region, with China excelling in large-scale manufacturing, Japan advancing precision optical engineering, and India emerging as a key growth market through semiconductor initiatives and telecom modernization. Supportive regulations promoting technology self-sufficiency and localized supply chains, combined with sustained capital investment, underpin strong regional growth projections of 8–12% through 2033.
North America Optical Components Market Growth Driven by Semiconductors, Autonomy, Telecom Investments
North America represents the fastest-growing regional market, recording a robust CAGR of 10.7%, driven by a strong resurgence in semiconductor manufacturing, rapid commercialization of autonomous vehicle technologies, and continued modernization of advanced telecommunications infrastructure. Government-led initiatives such as the CHIPS Act have accelerated domestic semiconductor investments, with over US$200 billion committed toward new foundry and device manufacturing facilities. These developments, combined with the region’s mature innovation ecosystem and premium technology adoption, support strong demand for high-value optical components across multiple applications.
The region accounts for approximately 25–30% of the global market, supported by three core growth drivers. First, renewed semiconductor manufacturing capacity, led by large-scale investments from Intel, Samsung, and TSMC across Arizona, Ohio, and Texas, is driving demand for precision optical elements in lithography and metrology. Second, autonomous vehicle development is expanding rapidly, with OEMs and technology firms deploying LiDAR-enabled systems that rely heavily on advanced optical components. Third, telecom operators are investing in fiber-optic and 5G network optimization to meet rising data traffic and bandwidth requirements.
A regulatory focus on supply-chain resilience and technology security favors domestic suppliers, while sustained venture capital and R&D investments support emerging applications in AR/VR, medical devices, and precision measurement. The competitive landscape includes established players such as Carl Zeiss AG, Edmund Optics, and Thorlabs, alongside innovative startups, enabling broad product diversity and specialization.
Refractive Optical Elements Market Competitive Landscape
The refractive optical elements market exhibits moderate consolidation characteristics, with leading manufacturers (Zeiss, Corning, Hamamatsu, Thorlabs) collectively commanding approximately 35-45% global market share, while mid-tier suppliers and specialized optical component manufacturers address niche applications and regional markets. Market structure reflects capital intensity barriers, specialized manufacturing capabilities, and customer concentration among semiconductor, telecommunications, and automotive manufacturers, creating sustainability advantages for established players with comprehensive product portfolios and integrated manufacturing capabilities.
Market concentration analysis indicates fragmentation across emerging applications (LiDAR, AR/VR, medical devices), where specialized technology innovators compete alongside established optical component manufacturers. This segmented competitive structure creates market opportunities for focused suppliers addressing specific applications or customer segments while presenting consolidation risks for smaller manufacturers lacking scale economies or technological differentiation. Competitive positioning increasingly depends on: (1) technological innovation and product differentiation addressing emerging applications; (2) manufacturing scale and cost optimization supporting price competitiveness; (3) customer relationship management and application support capabilities.
Key Industry Developments
- In 2023, Zeiss announced expanded refractive optical elements portfolio targeting semiconductor manufacturing and LiDAR applications, including new micro-lens array designs optimized for advanced photolithography and autonomous vehicle sensor systems.
- In 2024, Hamamatsu announced US$ 150 million investment in Asian manufacturing facility expansion targeting LiDAR and advanced sensing applications.
Companies Covered in Refractive Optical Elements Market
- Jenoptik AG
- SÜSS MicroTec SE
- HOLO/OR Ltd.
- Broadcom Inc.
- Sintec Optronics Pte Ltd.
- LightTrans GmbH
- RPC Photonics
- SILIOS Technologies
- Axetris AG
- Fraunhofer IOF
- Nalux Co., Ltd.
- Ricoh Company Ltd.
- Chineselens Optical Components
- Shanghai Optics Inc.
- Holographix LLC
- Other Market Players
Frequently Asked Questions
The Refractive Optical Elements market is estimated to be valued at US$ 6.4 Bn in 2026.
The primary demand driver for the Refractive Optical Elements market is the rapid expansion of advanced photonics-based applications requiring high-precision light control.
In 2026, the Asia Pacific region will dominate the market with an exceeding 45% revenue share in the global Refractive Optical Elements market.
Among applications, semiconductor manufacturing has the highest preference, capturing beyond 35% of the market revenue share in 2026, surpassing other applications.
Jenoptik AG, SÜSS MicroTec SE, Broadcom Inc., Sintec Optronics Pte Ltd., LightTrans GmbH, RPC Photonics, SILIOS Technologies, and Axetris AG. There are a few leading players in the Refractive Optical Elements market.


