

- Executive Summary
- Global Recycled PET (rPET) Market Snapshot, 2026 and 2033
- Market Opportunity Assessment, 2026 - 2033, US$ Mn
- Key Market Trends
- Future Market Projections
- Premium Market Insights
- Industry Developments and Key Market Events
- PMR Analysis and Recommendations
- Market Overview
- Market Scope and Definition
- Market Dynamics
- Drivers
- Restraints
- Opportunity
- Challenges
- Key Trends
- Product Lifecycle Analysis
- Recycled PET (rPET) Market: Value Chain
- List of Raw Material Suppliers
- List of Manufacturers
- List of Distributors
- Profitability Analysis
- Forecast Factors - Relevance and Impact
- Covid-19 Impact Assessment
- PESTLE Analysis
- Porter Five Force’s Analysis
- Geopolitical Tensions: Market Impact
- Regulatory and Application Landscape
- Macro-Economic Factors
- Global Sectorial Outlook
- Global GDP Growth Outlook
- Global Parent Market Overview
- Price Trend Analysis, 2019 - 2032
- Key Highlights
- Key Factors Impacting Product Prices
- Prices By Product Type/Composition/Application
- Regional Prices and Product Preferences
- Global Recycled PET (rPET) Market Outlook: Historical (2020 - 2025) and Forecast (2026 - 2033)
- Key Highlights
- Market Size and Y-o-Y Growth
- Absolute $ Opportunity
- Market Size (US$ Mn) Analysis and Forecast
- Historical Market Size Analysis, 2019-2025
- Current Market Size Forecast, 2024-2031
- Global Recycled PET (rPET) Market Outlook: Product Type
- Introduction / Key Findings
- Historical Market Size (US$ Mn) and Volume (KT) Analysis By Product Type, 2020 - 2025
- Current Market Size (US$ Mn) and Volume (KT) Forecast By Product Type, 2026 - 2033
- Flakes
- Fibers
- Resins
- Market Attractiveness Analysis: Product Type
- Global Recycled PET (rPET) Market Outlook: Application
- Introduction / Key Findings
- Historical Market Size (US$ Mn) and Volume (KT) Analysis By Application, 2020 - 2025
- Current Market Size (US$ Mn) and Volume (KT) Forecast By Application, 2026 - 2033
- Packaging
- Food & Beverage
- Pharma
- Personal Care
- Misc. (Agrochemicals, etc.)
- Textiles
- Strapping
- Footwear
- Automotive
- Flooring Materials
- Misc. (Engineered Resins, etc.)
- Packaging
- Market Attractiveness Analysis: Application
- Key Highlights
- Global Recycled PET (rPET) Market Outlook: Region
- Key Highlights
- Historical Market Size (US$ Mn) and Volume (KT) Analysis By Region, 2020 - 2025
- Current Market Size (US$ Mn) and Volume (KT) Forecast By Region, 2026 - 2033
- North America
- Europe
- East Asia
- South Asia and Oceania
- Latin America
- Middle East & Africa
- Market Attractiveness Analysis: Region
- North America Recycled PET (rPET) Market Outlook: Historical (2020 - 2025) and Forecast (2026 - 2033)
- Key Highlights
- Pricing Analysis
- Historical Market Size (US$ Mn) and Volume (KT) Analysis By Market, 2020 - 2025
- By Country
- By Product Type
- By Application
- Current Market Size (US$ Mn) and Volume ( KT) Forecast By Country, 2026 - 2033
- U.S.
- Canada
- Current Market Size (US$ Mn) and Volume (KT) Forecast By Product Type, 2026 - 2033
- Flakes
- Fibers
- Resins
- Current Market Size (US$ Mn) and Volume ( KT) Forecast By Application, 2026 - 2033
- Packaging
- Food & Beverage
- Pharma
- Personal Care
- Misc. (Agrochemicals, etc.)
- Textiles
- Strapping
- Footwear
- Automotive
- Flooring Materials
- Misc. (Engineered Resins, etc.)
- Packaging
- Market Attractiveness Analysis
- Europe Recycled PET (rPET) Market Outlook: Historical (2020 - 2025) and Forecast (2026 - 2033)
- Key Highlights
- Pricing Analysis
- Historical Market Size (US$ Mn) and Volume (KT) Analysis By Market, 2020 - 2025
- By Country
- By Product Type
- By Application
- Current Market Size (US$ Mn) and Volume (KT) Forecast By Country, 2026 - 2033
- Germany
- France
- U.K.
- Italy
- Spain
- Russia
- Rest of Europe
- Current Market Size (US$ Mn) and Volume (KT) Forecast By Product Type, 2026 - 2033
- Flakes
- Fibers
- Resins
- Current Market Size (US$ Mn) and Volume ( KT) Forecast By Application, 2026 - 2033
- Packaging
- Food & Beverage
- Pharma
- Personal Care
- Misc. (Agrochemicals, etc.)
- Textiles
- Strapping
- Footwear
- Automotive
- Flooring Materials
- Misc. (Engineered Resins, etc.)
- Packaging
- Market Attractiveness Analysis
- East Asia Recycled PET (rPET) Market Outlook: Historical (2020 - 2025) and Forecast (2026 - 2033)
- Key Highlights
- Pricing Analysis
- Historical Market Size (US$ Mn) and Volume (KT) Analysis By Market, 2020 - 2025
- By Country
- By Product Type
- By Application
- Current Market Size (US$ Mn) and Volume ( KT) Forecast By Country, 2026 - 2033
- China
- Japan
- South Korea
- Current Market Size (US$ Mn) and Volume (KT) Forecast By Product Type, 2026 - 2033
- Flakes
- Fibers
- Resins
- Current Market Size (US$ Mn) and Volume ( KT) Forecast By Application, 2026 - 2033
- Packaging
- Food & Beverage
- Pharma
- Personal Care
- Misc. (Agrochemicals, etc.)
- Textiles
- Strapping
- Footwear
- Automotive
- Flooring Materials
- Misc. (Engineered Resins, etc.)
- Packaging
- Market Attractiveness Analysis
- South Asia & Oceania Recycled PET (rPET) Market Outlook: Historical (2020 - 2025) and Forecast (2026 - 2033)
- Key Highlights
- Pricing Analysis
- Historical Market Size (US$ Mn) and Volume (KT) Analysis By Market, 2020 - 2025
- By Country
- By Product Type
- By Application
- Current Market Size (US$ Mn) and Volume (KT) Forecast By Country, 2026 - 2033
- India
- Southeast Asia
- ANZ
- Rest of South Asia & Oceania
- Current Market Size (US$ Mn) and Volume (KT) Forecast By Product Type, 2026 - 2033
- Flakes
- Fibers
- Resins
- Current Market Size (US$ Mn) and Volume ( KT) Forecast By Application, 2026 - 2033
- Packaging
- Food & Beverage
- Pharma
- Personal Care
- Misc. (Agrochemicals, etc.)
- Textiles
- Strapping
- Footwear
- Automotive
- Flooring Materials
- Misc. (Engineered Resins, etc.)
- Packaging
- Market Attractiveness Analysis
- Latin America Recycled PET (rPET) Market Outlook: Historical (2020 - 2025) and Forecast (2026 - 2033)
- Key Highlights
- Pricing Analysis
- Historical Market Size (US$ Mn) and Volume (KT) Analysis By Market, 2020 - 2025
- By Country
- By Product Type
- By Application
- Current Market Size (US$ Mn) and Volume (KT) Forecast By Country, 2026 - 2033
- Brazil
- Mexico
- Rest of Latin America
- Current Market Size (US$ Mn) and Volume (KT) Forecast By Product Type, 2026 - 2033
- Flakes
- Fibers
- Resins
- Current Market Size (US$ Mn) and Volume ( KT) Forecast By Application, 2026 - 2033
- Packaging
- Food & Beverage
- Pharma
- Personal Care
- Misc. (Agrochemicals, etc.)
- Textiles
- Strapping
- Footwear
- Automotive
- Flooring Materials
- Misc. (Engineered Resins, etc.)
- Packaging
- Market Attractiveness Analysis
- Middle East & Africa Recycled PET (rPET) Market Outlook: Historical (2020 - 2025) and Forecast (2026 - 2033)
- Key Highlights
- Pricing Analysis
- Historical Market Size (US$ Mn) and Volume (KT) Analysis By Market, 2020 - 2025
- By Country
- By Product Type
- By Application
- Current Market Size (US$ Mn) and Volume (KT) Forecast By Country, 2026 - 2033
- GCC
- South Africa
- Northern Africa
- Rest of Middle East & Africa
- Current Market Size (US$ Mn) and Volume (KT) Forecast By Product Type, 2026 - 2033
- Flakes
- Fibers
- Resins
- Current Market Size (US$ Mn) and Volume ( KT) Forecast By Application, 2026 - 2033
- Packaging
- Food & Beverage
- Pharma
- Personal Care
- Misc. (Agrochemicals, etc.)
- Textiles
- Strapping
- Footwear
- Automotive
- Flooring Materials
- Misc. (Engineered Resins, etc.)
- Packaging
- Market Attractiveness Analysis
- Competition Landscape
- Market Share Analysis, 2025
- Market Structure
- Competition Intensity Mapping By Market
- Competition Dashboard
- Apparent Production Capacity
- Company Profiles (Details - Overview, Financials, Strategy, Recent Developments)
- Indorama Ventures Public Company Limited
- Overview
- Segments and Products
- Key Financials
- Market Developments
- Market Strategy
- Phoenix Technologies International, LLC
- Biffa
- Alpek
- Plastipak Packaging
- Extrupet Group (Pty) Ltd
- Alpla
- JP Recycling Ltd
- Evergreen Plastics, Inc.
- PolyQuest
- Iterum (PET Baltija)
- Ganesha Ecosphere Ltd.
- Note: List of companies is not exhaustive. It is subject to further augmentation during course of research
- Indorama Ventures Public Company Limited
- Appendix
- Research Methodology
- Research Assumptions
- Acronyms and Abbreviations


- Plastics, Polymers & Resins
- Recycled PET (r-PET) Market
Recycled PET (r-PET) Market Size, Share, and Growth Forecast, 2026 - 2033
Recycled PET (r-PET) Market by Product type (Flakes, Fibers, Resins), Application (Food & Beverage, Pharma, Personal Care, Misc. (Agrochemicals, etc.)), Textiles, Strapping, Footwear, Automotive, Flooring Materials, and Misc. (Engineered Resins, etc.)) and Regional Analysis for 2026 - 2033
Recycled PET (r-PET) Market Size and Trends Analysis
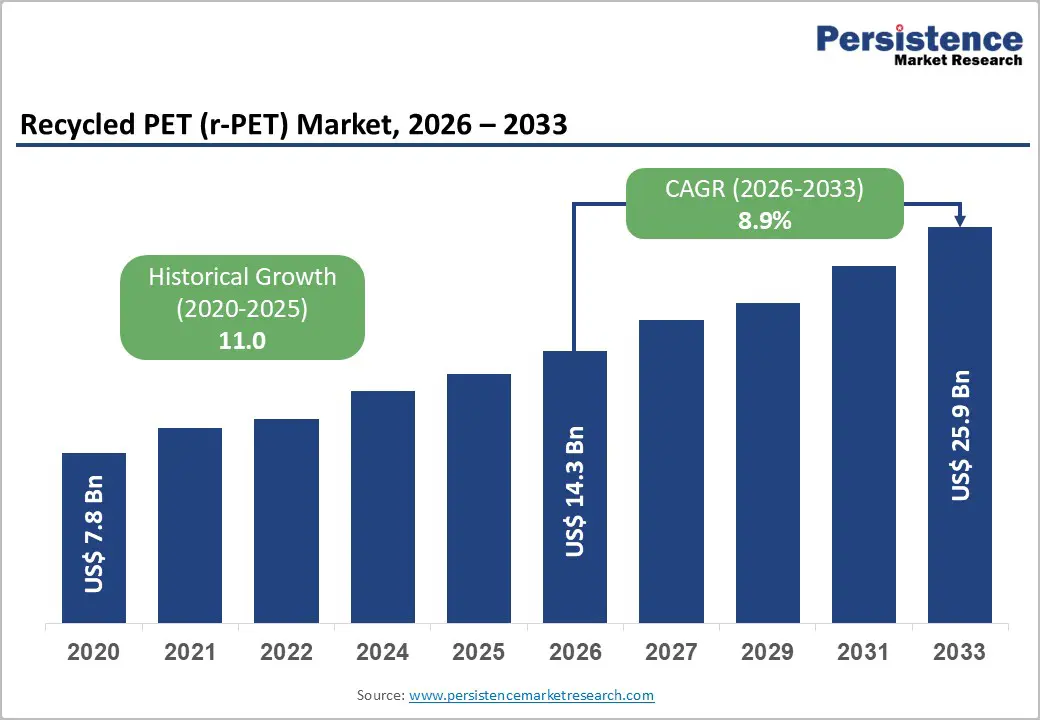
The global recycled PET (r-PET) market size is likely to be valued at US$ 14.3 billion in 2026 and is projected to reach US$ 25.9 billion by 2033, growing at a CAGR of 8.9% between 2026 and 2033. The market has demonstrated substantial expansion from its 2020 baseline of US$ 7.8 billion, reflecting a historical CAGR of 11.0% driven by intensifying regulatory mandates, corporate sustainability commitments, and technological advancements in recycling processes.
This growth trajectory is underpinned by the European Union's Single-Use Plastics Directive, requiring 25 percent recycled content in PET beverage bottles by 2025 and 30% by 2030, alongside similar regulatory frameworks emerging across Asia-Pacific and North America that collectively establish minimum post-consumer recycled content thresholds for packaging applications.
Key Industry Highlights:
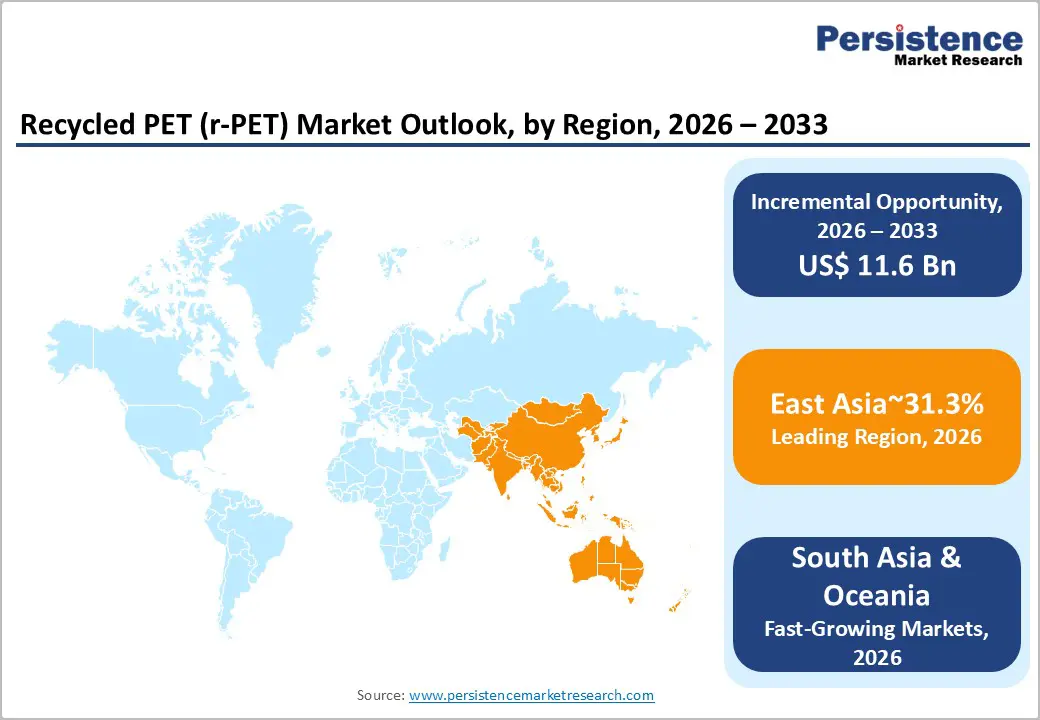
- Regional Leadership: East Asia leads the global Recycled PET (r-PET) market with 31.3% share, supported by strong manufacturing capacity, mandatory recycled content rules, and advanced mechanical and chemical recycling adoption.
- Second Largest Hub: Europe holds 26.5% market share, driven by strict packaging regulations, recycled content mandates, and multi-billion-euro investments in chemical recycling infrastructure for food-grade applications.
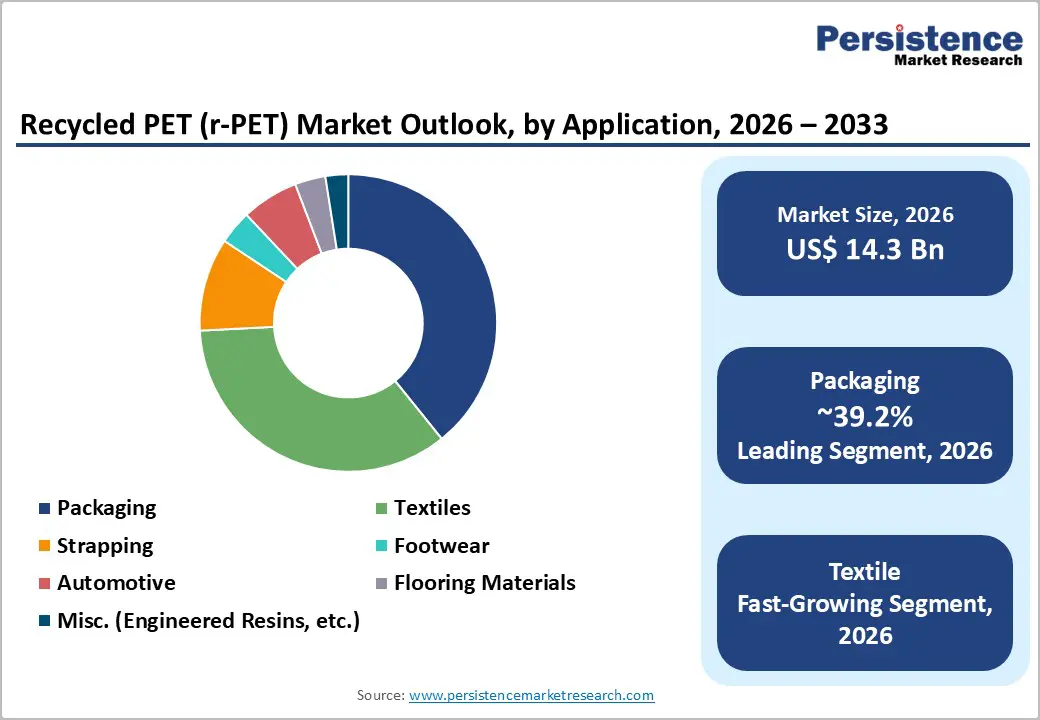
- Application Dominance: Packaging commands 39.2% share, remaining the primary demand center due to bottle-to-bottle recycling systems, food-contact compliance, and brand sustainability commitments.
- Fastest-Growing Segment: Textiles emerge as the fastest-growing end use, fueled by rising adoption of recycled polyester fibers across apparel, home furnishings, and industrial fabrics.
- Regulatory Driver: Mandatory recycled content laws and plastic taxes across the EU, UK, and Asia are establishing a predictable baseline demand, directly accelerating the shift from virgin Polyethylene Terephthalate to r-PET.
- Technology Development: Advances in glycolysis, depolymerisation, AI-enabled sorting, and food-grade pelletizing are expanding feedstock eligibility and enabling high-purity r-PET suitable for premium packaging applications.
| Key Insights | Details |
|---|---|
|
Recycled PET (r-PET) Market Size (2026E) |
US$ 14.3 Bn |
|
Market Value Forecast (2033F) |
US$ 25.9 Bn |
|
Projected Growth (CAGR 2026 to 2033) |
8.9% |
|
Historical Market Growth (CAGR 2020 to 2025) |
11.0% |
Market Dynamics
Drivers - Stringent Regulatory Frameworks Mandating Recycled Content Adoption
The Recycled PET (r-PET) market is witnessing sustained momentum as governments across major economies implement mandatory recycled content regulations that directly influence packaging design and material procurement decisions. The European Union’s Packaging and Packaging Waste Regulation requires minimum recycled content thresholds in contact-sensitive PET packaging and beverage bottles, progressively raising the share of r-PET permitted in food-grade applications to support long-term circularity goals. In the United Kingdom, the Plastic Packaging Tax places a financial levy on packaging containing less than 30% recycled content, creating clear cost incentives for manufacturers to substitute virgin resin with r-PET.
Across Asia, South Korea’s environmental mandates require beverage producers to incorporate defined percentages of r-PET in clear bottles, supported by certification systems that verify both recycled content and food-contact safety standards. Japan’s Green Procurement framework similarly promotes r-PET adoption by requiring minimum recycled content and design-for-recycling compliance, while offering preferential access to government purchasing programs for certified products. Collectively, these policy mechanisms establish a predictable baseline demand for recycled materials, compelling brand owners, converters, and recyclers to integrate r-PET into packaging portfolios and reshaping sourcing strategies, production specifications, and investment decisions throughout the global r-PET value chain.
Corporate Sustainability Commitments Driving Consistent Demand
The recycled PET (r-PET) market is increasingly shaped by formal sustainability commitments from multinational brand owners that have embedded recycled content targets into their packaging strategies, creating reliable and long-term demand for food-grade r-PET. Companies such as The Kraft Heinz Company have pledged to reduce virgin plastic use across global packaging portfolios by 20 percent, eliminating roughly 100 million pounds of virgin resin, while advancing goals for fully recyclable, reusable, or compostable packaging formats. Otsuka Pharmaceutical Co., Ltd. has transitioned the majority of its beverage portfolio to 100 percent recycled PET bottles, delivering measurable greenhouse gas reductions and strengthening closed-loop bottle-to-bottle recycling through partnerships with local collection networks.
INEOS and PepsiCo have introduced snack packaging containing 50 percent recycled plastic, demonstrating that advanced recycling technologies can meet stringent food-contact and performance standards. These voluntary, time-bound commitments extend beyond regulatory compliance and translate into predictable procurement contracts that encourage investment in recycling capacity, feedstock sourcing, and processing infrastructure. Collectively, corporate sustainability programs reinforce market stability, enhance brand credibility, and accelerate the mainstream adoption of r-PET across the global packaging value chain.
Technological Innovation Enhanc ing Recycling Quality and Efficiency
The recycled PET (r-PET) market is advancing through continuous improvements in both mechanical and chemical recycling technologies that broaden acceptable feedstocks and deliver higher-purity, food-grade outputs. Companies such as revalyu have deployed glycolysis-based chemical recycling systems capable of processing over 20 million PET bottles per day, producing approximately 160 tonnes of high-quality PET chips and polymer daily, while achieving up to 75percent lower water use and 91 percent lower energy consumption compared with conventional virgin PET production. Meanwhile, AI-driven materials informatics solutions from firms like NEC Corporation and MARUKI SANGYO are improving operational efficiency by cutting compounding and colouring time for recycled plastics by around 50%, reducing costs and simplifying processing requirements.
Equipment innovations are also strengthening compliance for food-contact uses, with ACERETECH’s bottle-to-bottle pelletizing, detoxification, and solid-state polymerisation systems receiving regulatory food-grade recognition for 100% r-PET applications. These technologies enable recyclers to handle difficult streams such as dark or colored PET, multilayer trays, films, and polyester textiles through advanced depolymerisation and purification processes that yield virgin-quality resin or monomers. As a result, feedstock availability improves, recovery rates increase, and the economic viability of r-PET expands across packaging, textiles, and other end-use sectors.
Restraint - Significant Price Premium of Recycled PET Over Virgin Material
The Recycled PET (r-PET) Market confronts substantial economic headwinds stemming from persistent cost disadvantages relative to virgin PET production. As of June 2025, virgin PET was available in Europe for approximately €1,000 per tonne, while rPET commanded prices reaching €1,800 per tonne a differential of 80 percent driven by higher collection, cleaning, and reprocessing costs. Even accounting for Spain's virgin plastics tax of €450 per tonne, virgin PET remains more cost-effective than recycled alternatives, prompting European bottlers to revert to legally mandated minimum recycled content thresholds of 25 percent rather than pursuing higher voluntary targets. This price disparity is exacerbated by low global oil prices that reduce virgin PET production costs through cheaper fossil feedstocks and mature petrochemical supply chains, while simultaneously undermining rPET's economic competitiveness.
The cost disadvantage is particularly acute in Asia Pacific markets lacking mandatory recycled content regulations, where price-sensitive buyers prioritise virgin material despite corporate sustainability rhetoric, creating surplus rPET capacity and downward pressure on recycler margins that threaten long-term investment viability and infrastructure development.
Opportunities - Chemical Recycling Infrastructure Expansion Addressing Complex Waste Streams
The recycled PET (r-PET) Market presents substantial growth potential through the deployment of chemical recycling technologies capable of processing materials unsuitable for mechanical recycling. European plastics manufacturers have announced a dramatic investment surge from €2.6 billion in 2025 to a projected €8 billion by 2030 in chemical recycling infrastructure designed to handle mixed, contaminated, and multi-layer plastic packaging through depolymerisation processes that yield virgin-quality monomers. In May 2025, a consortium of nine Japanese companies, including Kao Corp., Kirin Holdings, JEPLAN, and TDK, launched Japan's first initiative to chemically recycle non-food PET materials, including industrial films and cosmetic bottles, into high-quality PET beverage bottles, leveraging JEPLAN's chemical recycling technology to expand feedstock sourcing beyond post-consumer beverage containers.
The technology addresses the fundamental limitation of mechanical recycling, which struggles with polymer degradation after multiple cycles, by breaking down PET into molecular building blocks that can be infinitely repolymerized without quality loss. This capability is particularly valuable for the Recycled PET Market as it unlocks utilisation of textile waste, carpet fibres, and complex packaging formats that currently flow to incineration or landfill, potentially expanding recoverable feedstock volumes by an estimated 40 to 60 percent while simultaneously meeting food contact safety standards that command premium pricing.
Government incentives, including the U.S. Department of Energy's Office of Clean Energy Demonstrations, providing up to US$ 375 million for Eastman's Longview, Texas, facility processing approximately 110,000 metric tons annually of hard-to-recycle plastic waste, demonstrate policy alignment supporting commercial-scale deployment across major economies.
Deposit Return Schemes and Collection Infrastructure Modernisation
Enhanced collection systems through deposit return schemes (DRS) present a significant structural opportunity for the Recycled Polyethylene Terephthalate (r-PET) market by improving both feedstock recovery rates and material quality. Evidence from established international programs shows that jurisdictions implementing deposits of at least US$ 0.15 consistently achieve median return rates above 90 percent, compared with approximately 69 percent in systems with lower deposit values. Mature markets such as Germany, Norway, Finland, and Denmark routinely maintain recovery rates exceeding 90 percent, demonstrating the effectiveness of well-designed incentive-based collection models.
Expanded deposit coverage and higher refund values have been shown to rapidly increase consumer participation, elevate collection volumes, and enhance bottle-to-bottle recyclability. Independent academic research further indicates that a nationwide deposit framework could raise PET bottle recycling rates above 80 percent, with a substantial share of recovered material suitable for closed-loop recycling into new food-grade packaging at minimal incremental system cost.
For the Recycled PET (r-PET) market, these systems deliver dual advantages such as larger, more reliable feedstock streams to support processing capacity and investment confidence, and cleaner, source-separated material that reduces contamination, lowers sorting and purification costs, and improves yield efficiency. This combination enables higher-value, food-contact-grade applications that command premium pricing compared with textile and industrial uses, strengthening overall profitability and accelerating the transition toward a circular plastics economy.
Category-wise Analysis
Product type Insights
The flakes segment maintains market leadership with 55.4% market share in 2026, driven by its versatility across diverse end-use applications and established processing infrastructure. PET flakes serve as intermediate feedstock for fiber production, bottle-to-bottle recycling, and sheet extrusion applications, benefiting from relatively lower capital intensity in mechanical recycling operations compared to pellet or chip production that requires additional compounding and solid-state polymerisation equipment. The segment's dominance reflects its compatibility with both textile and packaging end markets, providing recyclers operational flexibility to optimise product mix based on prevailing price dynamics and demand patterns across application categories.
Fibres represent the fastest-growing product type segment, propelled by expanding textile and apparel industry adoption of recycled polyester as brands pursue sustainability commitments. The accommodation and food services sector in the EU employed approximately 10.9 million people and accounted for 6.8 percent of total business economy employment in 2022, generating €280.7 billion in value added, creating substantial demand for uniforms, linens, and other textile applications increasingly specified with recycled content requirements.
Industry Insights
The packaging segment commands the largest market share at 39.2% in 2026, encompassing food and beverage containers, pharmaceutical packaging, personal care products, and agrochemical applications. This dominance is structurally supported by regulatory mandates specifically targeting packaging applications, corporate commitments concentrated in consumer-facing categories, and established bottle-to-bottle recycling infrastructure designed to meet food contact safety standards.
In the United States, the PET bottle recycling rate reached 33 percent in 2023, the highest since 1996, with the fraction of total rPET usage directed to bottle markets achieving a record 59 percent, representing five consecutive years of growth driven by California's legislated 15 percent minimum recycled content requirement escalating to 25 percent in 2025.
The textiles segment emerges as the fastest-growing end-use category, driven by apparel and home furnishing manufacturers' sustainability initiatives and consumer preference for recycled polyester products.
Regional Insights and Trends
East Asia Recycled PET (r-PET) Market Trend
East Asia accounts for 31.3% of the global recycled PET (r-PET) market, anchored by China, Japan, and South Korea’s strong manufacturing base, regulatory frameworks, and advanced recycling technologies. Japan is advancing chemical recycling capabilities, with facilities processing around 1,000 tonnes per annum of difficult-to-recycle PET, such as colored bottles, films, and textiles, into virgin-quality monomers suitable for food-grade applications. South Korea has introduced mandatory r-PET content requirements, starting at 10% and scaling to 30%, supported by strict process and food-contact certifications to ensure material safety and purity.
China’s significant virgin PET capacity additions of 2–3 million tonnes have created price pressure on recycled resin, affecting r-PET competitiveness. Despite this, the region benefits from well-established collection systems, combining formal municipal infrastructure with extensive informal recovery networks. Together, policy mandates technology adoption, and feedstock availability position East Asia as a key hub for both mechanical and chemical r-PET development.
North America Recycled PET (r-PET) Market Trends
North America accounts for 19.2% of the global recycled PET (r-PET) market, supported by state-level regulations, strong corporate sustainability commitments, and expanding bottle-to-bottle recycling infrastructure. The U.S. PET bottle recycling rate has improved to around one-third of total volumes, with reclamation capacity of nearly 3 billion pounds annually, indicating that collection efficiency rather than processing capacity remains the key constraint.
Private players such as Republic Services are investing in new bottle-to-flake facilities to strengthen domestic supply. Rising minimum recycled content mandates, particularly in California, have pushed average r-PET use in bottles to record levels. A large food and beverage manufacturing base and effective deposit return systems are further enhancing feedstock availability and supporting regional recycling clusters across the U.S.
Europe Recycled PET (r-PET) Market Trends
Europe commands 26.5% of the global recycled PET (r-PET) market, supported by stringent regulations and a well-established circular economy framework that prioritises food-grade and bottle-to-bottle recycling. Policy refinements under the Single-Use Plastics Directive and new HS codes for PET flakes and r-PET pellets are designed to strengthen domestic recyclers, improve traceability, and limit reliance on imports. The region maintains adequate capacity to meet 2030 recycled content targets, though recyclers continue to face elevated energy and collection costs.
Recent data shows total plastics output declining 8.3% to 54 million tonnes, with mechanically recycled volumes down 7.8% to 7.1 million tonnes, reflecting cost pressures and global competition. To reinforce supply chains, companies are pursuing strategic acquisitions and capacity upgrades, alongside stronger local sourcing. At the same time, chemical recycling investments are projected to rise from €2.6 billion to €8 billion by 2030, targeting recovery of complex PET waste streams. Together, these measures position Europe as a regulation-led yet investment-driven hub for high-quality r-PET production.
Competitive Landscape
The global recycled PET (r-PET) market exhibits a moderately consolidated yet competitive landscape, with a handful of large multinational recyclers and resin producers exerting significant influence. Numerous regional and niche players compete on price and technology. Indorama Ventures stands out as a clear leader with extensive, vertically integrated recycling operations and global scale, enabling it to supply high-quality r-PET to major beverage and packaging brands.
Alpek and Plastipak Packaging follow closely, leveraging strong regional footprints and closed-loop recycling systems to secure stable demand and expand food-grade r-PET capacity. Companies such as Biffa, ALPLA, Extrupet Group (Pty) Ltd, Phoenix Technologies International, LLC, JP Recycling Ltd, Evergreen Plastics, Inc., and PolyQuest contribute to market depth and innovation through specialised recycling solutions, niche product offerings, and localised feedstock networks. This environment reflects both consolidation among the top tier and fragmentation among smaller competitors, fostering continuous investment in technology, partnerships, and capacity expansions to meet rising sustainability mandates and customer requirements.
Key Industry Developments:
- In January 2026, Otsuka Pharmaceutical Co., Ltd. implemented a nationwide transition to beverage bottles manufactured from 100% recycled PET resin across the majority of its portfolio, including leading hydration brands, enabling an estimated 5,300 tonnes of annual greenhouse gas emission reductions while strengthening closed-loop bottle-to-bottle recycling through partnerships with multiple local governments, demonstrating large-scale commercial viability of food-grade r-PET adoption.
- On August 6, 2025, Indorama Ventures Public Company Limited has surpassed the milestone of recycling more than 150 billion post-consumer PET bottles through its global network of recycling operations spanning multiple countries, with facilities collectively processing hundreds of bottles per second to produce high-quality r-PET resins, reinforcing its position as one of the world’s largest integrated recyclers supporting circular economy supply chains across packaging, textiles, and industrial applications.
- In May, 2025, A Japanese multi-company consortium, including Kao, Kirin Holdings, JEPLAN, TDK, and other packaging and consumer goods manufacturers, has launched an advanced chemical recycling program that converts non-food PET waste streams and post-consumer bottles into food-grade Polyethylene Terephthalate (PET) for new beverage and cosmetic packaging, expanding usable feedstock beyond traditional bottle waste and improving resin purity to enable scalable, closed-loop, high-performance r-PET production.
Companies Covered in Recycled PET (r-PET) Market
- Indorama Ventures
- Phoenix Technologies International, LLC
- Biffa
- Alpek
- Plastipak Packaging
- Extrupet Group (Pty) Ltd
- Alpla
- JP Recycling Ltd
- Evergreen Plastics, Inc.
- PolyQuest
- Iterum (PET Baltija)
- Ganesha Ecosphere Ltd.
Frequently Asked Questions
The global recycled PET (r-PET) Market is projected to be valued at US$ 14.3 Bn in 2026.
The flakes segment is expected to account for approximately 55.4% of the Global Recycled PET (r-PET) Market by product type in 2026.
The market is expected to witness a CAGR of 8.9% from 2026 to 2033.
The Recycled PET (r-PET) market is driven by mandatory recycled-content regulations, strong corporate sustainability commitments, and continuous advancements in mechanical and chemical recycling technologies that improve quality, efficiency, and feedstock utilisation.
Key opportunities in the Recycled PET (r-PET) market stem from expanding chemical recycling capacity to process complex and previously unrecoverable waste streams and modernizing deposit return and collection systems that boost high-quality feedstock recovery, enabling higher recycling rates and premium food-grade applications.
Key players in the Recycled PET (r-PET) Market include Indorama Ventures, Biffa, ALPLA, Extrupet Group (Pty) Ltd, Phoenix Technologies International, LLC, JP Recycling Ltd, Evergreen Plastics, Inc., and PolyQuest.


