Professional Portable Battery Aftermarket Market

Global Market Study on Professional Portable Battery Aftermarket: Increasing Usage of Portable Electronic Devices and Miniaturization Trend to Drive Growth

Portable Battery Aftermarket Market Segmented By Alkaline Battery, Lithium Ion Battery, Nickel Based Battery Type in Healthcare, Hospitality, Residential Commercial and Government, Industrial Equipment and Automation, Automotive and Transportation

Report ID: PMRREP25828

Number of Pages: 389

Format: PPT*, PDF, EXCEL

Industry: Industrial Automation

Published Date: December-2018

Report Price

$4900*

Buy Now

Table of Content

1. Executive Summary

    1.1. Market Overview

    1.2. Market Analysis

    1.3. PMR Analysis and Recommendations

    1.4. Wheel of Fortune

    1.5. Product Life Cycle Analysis

2. Aftermarket Introduction

    2.1. Market Taxonomy

    2.2. Market Definition

3. Aftermarket Background

    3.1. Porter’s Analysis

    3.2. Macro-Economic Factors

    3.3. Forecast Factors: Relevance and Impact

    3.4. Value Chain Analysis

4. Aftermarket Dynamics

    4.1. Drivers

    4.2. Restraints

    4.3. Opportunities

    4.4. Trends

5. Aftermarket Forecast

6. Global Professional Portable Battery Aftermarket Analysis 2013–2017 and Forecast 2018–2026, By Battery Type

    6.1. Introduction

    6.2. Historical Market Size (US$ Mn) and Volume Analysis By Battery Type (2013-2017)

    6.3. Market Size (US$ Mn) and Volume Forecast By Battery Type (2018-2026)

        6.3.1. Alkaline Battery

        6.3.2. Lithium Ion Battery

        6.3.3. Nickel Based & Other Battery

    6.4. Market Attractiveness Analysis By Battery Type

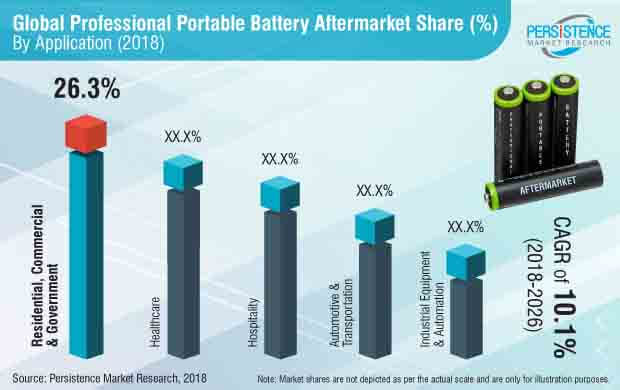
7. Global Professional Portable Battery Aftermarket Analysis 2013–2017 and Forecast 2018–2026, By Application

    7.1. Introduction

    7.2. Historical Market Size (US$ Mn) and Volume Analysis By Application (2013-2017)

    7.3. Market Size (US$ Mn) and Volume Forecast By Application (2018-2026)

        7.3.1. Healthcare

            7.3.1.1. Surgical Devices

            7.3.1.2. Weight Measuring & Fitness Devices

            7.3.1.3. Vitals

                7.3.1.3.1. Body Temperature

                7.3.1.3.2. Pulse & Respiration Monitoring

                7.3.1.3.3. Blood Pressure Monitoring

            7.3.1.4. Glucose Meter

        7.3.2. Hospitality

            7.3.2.1. Entertainment Devices

            7.3.2.2. Room Monitoring Devices

            7.3.2.3. Safety & Security Devices

            7.3.2.4. Remote Controls

            7.3.2.5. Bath Accessories

        7.3.3. Residential Commercial & Government

            7.3.3.1. Safety & Security Devices

            7.3.3.2. Hygienic Devices

            7.3.3.3. Beauty Care Products

            7.3.3.4. Bath Accessories

            7.3.3.5. Entertainment Devices

            7.3.3.6. IT & Supply Chain management

        7.3.4. Industrial Equipment & Automation

            7.3.4.1. afety & Security Devices

            7.3.4.2. PS Location Devices

            7.3.4.3. T & Supply Chain management

            7.3.4.4. emperature Devices

            7.3.4.5. FID & Other Tags

        7.3.5. Automotive & transportation

            7.3.5.1. Smart Keys

            7.3.5.2. TPMS

            7.3.5.3. Other Battery Operated Sensors

    7.4. Market Attractiveness Analysis By Application

8. Global Professional Portable Battery Aftermarket Analysis 2013–2017 and Forecast 2018–2026, By Distribution Channel

    8.1. Introduction

    8.2. Historical Market Size (US$ Mn) and Volume Analysis By Distribution Channel (2013-2017)

    8.3. Market Size (US$ Mn) and Volume Forecast By Distribution Channel (2018-2026)

        8.3.1. Online

        8.3.2. Offline

9. Global Professional Portable Battery Aftermarket Analysis 2013–2017 and Forecast 2018–2026, By End User

    9.1. Introduction

    9.2. Historical Market Size (US$ Mn) and Volume Analysis By End User (2013-2017)

    9.3. Market Size (US$ Mn) and Volume Forecast By End User (2018-2026)

        9.3.1. DiY (DO it Yourself)

        9.3.2. Service Providers

    9.4. Market Attractiveness Analysis By End User

10. Global Professional Portable Battery Aftermarket Analysis 2013–2017 and Forecast 2018–2026, By Region

    10.1. Introduction

    10.2. Historical Market Size (US$ Mn) and Volume Analysis By Country, 2013 – 2017

    10.3. Market Size (US$ Mn) and Volume Forecast By Country, 2018–2026

        10.3.1. North America

        10.3.2. Latin America

        10.3.3. Europe

        10.3.4. South East Asia & Pacific

        10.3.5. China

        10.3.6. Middle East & Africa

    10.4.Market Attractiveness Analysis By Country

11. North America Professional Portable Battery Aftermarket Analysis 2013–2017 and Forecast 2018–2026

    11.1. Introduction

    11.2. Historical Aftermarket Size (US$ Mn) and Volume Analysis by Aftermarket Segments (2013-2017)

    11.3. Aftermarket Size (US$ Mn) and Volume Forecast By Aftermarket Segments (2018-2026)

        11.3.1. By Country

            11.3.1.1. U.S.

            11.3.1.2. Canada

        11.3.2. By Battery Type

        11.3.3. By Application

        11.3.4. By Distributional Channel

        11.3.5. By End User

    11.5. Drivers and Restraints: Impact Analysis

    11.6. Aftermarket Attractiveness Analysis

        11.6.1. By Country

        11.6.2. By Battery Type

        11.6.3. By Application

        11.6.4. By Distributional Channel

        11.6.5. By End User

12. Latin America Professional Portable Battery Aftermarket Analysis 2013–2017 and Forecast 2018–2026

    12.1. Introduction

    12.2. Historical Aftermarket Size (US$ Mn) and Volume Analysis by Aftermarket Segments (2013-2017)

    12.3. Aftermarket Size (US$ Mn) and Volume Forecast By Aftermarket Segments (2018-2026)

        12.3.1. By Country

            12.3.1.1. Brazil

            12.3.1.2. Mexico

            12.3.1.3. Rest of Latin America

        12.3.2. By Battery Type

        12.3.3. By Application

        12.3.4. By Distributional Channel

        12.3.5. By End User

    12.4. Drivers and Restraints: Impact Analysis

    12.5. Aftermarket Attractiveness Analysis

        12.5.1. By Country

        12.5.2. By Battery Type

        12.5.3. By Application

        12.5.4. By Distributional Channel

        12.5.5. By End User

13. Europe Professional Portable Battery Aftermarket Analysis 2013–2017 and Forecast 2018–2026

    13.1. Introduction

    13.2. Historical Aftermarket Size (US$ Mn) and Volume Analysis by Aftermarket Segments (2013-2017)

    13.3. Aftermarket Size (US$ Mn) and Volume Forecast By Aftermarket Segments (2018-2026)

        13.3.1. By Country

            13.3.1.1. Germany

            13.3.1.2. Italy

            13.3.1.3. France

            13.3.1.4. U.K.

            13.3.1.5. Spain

            13.3.1.6. Nordic

            13.3.1.7. BENELUX

            13.3.1.8. Russia

            13.3.1.9. Rest of Europe

        13.3.2. By Battery Type

        13.3.3. By Application

        13.3.4. By Distributional Channel

        13.3.5. By End User

    13.4. Drivers and Restraints: Impact Analysis

    13.5. Aftermarket Attractiveness Analysis

        13.5.1. By Country

        13.5.2. By Battery Type

        13.5.3. By Application

        13.5.4. By Distributional Channel

        13.5.5. By End User

14. SEA & Pacific Professional Portable Battery Aftermarket Analysis 2013–2017 and Forecast 2018–2026

    14.1. Introduction

    14.2. Historical Aftermarket Size (US$ Mn) and Volume Analysis by Aftermarket Segments (2013-2017)

    14.3. Aftermarket Size (US$ Mn) and Volume Forecast By Aftermarket Segments (2018-2026)

        14.3.1. By Country

            14.3.1.1. India

            14.3.1.2. ASEAN

            14.3.1.3. Japan

            14.3.1.4. Rest of SEA & Pacific

        14.3.2. By Battery Type

        14.3.3. By Application

        14.3.4. By Distributional Channel

        14.3.5. By End User

    14.4. Drivers and Restraints: Impact Analysis

    14.5. Aftermarket Attractiveness Analysis

        14.5.1. By Country

        14.5.2. By Battery Type

        14.5.3. By Application

        14.5.4. By Distributional Channel

        14.5.5. By End User

15. China Professional Portable Battery Aftermarket Analysis 2013–2017 and Forecast 2018–2026

    15.1. Introduction

    15.2. Historical Aftermarket Size (US$ Mn) and Volume Analysis By Aftermarket Segments (2013-2017)

    15.3. Aftermarket Size (US$ Mn) and Volume Forecast By Aftermarket Segments (2018-2026)

        15.3.1. By Battery Type

        15.3.2. By Application

        15.3.3. By Distributional Channel

        15.3.4. By End User

    15.4. Drivers and Restraints: Impact Analysis

    15.5. Aftermarket Attractiveness Analysis

        15.5.1. By Battery Type

        15.5.2. By Application

        15.5.3. By Distributional Channel

        15.5.4. By End User

16. Middle East & Africa Professional Portable Battery Aftermarket Analysis 2013–2017 and Forecast 2018–2026

    16.1. Introduction

    16.2. Historical Aftermarket Size (US$ Mn) and Volume Analysis by Aftermarket Segments (2013-2017)

    16.3. Aftermarket Size (US$ Mn) and Volume Forecast By Aftermarket Segments (2018-2026)

        16.3.1. By Country

            16.3.1.1. Turkey

            16.3.1.2. South Africa

            16.3.1.3. Rest of MEA

        16.3.2. By Battery Type

        16.3.3. By Application

        16.3.4. By Distributional Channel

        16.3.5. By End User

    16.4. Drivers and Restraints: Impact Analysis

    16.5. Aftermarket Attractiveness Analysis

        16.5.1. By Country

        16.5.2. By Battery Type

        16.5.3. By Application

        16.5.4. By Distributional Channel

        16.5.5. By End User

17. Professional Portable Battery Aftermarket Industry Structure

    17.1. Market Share Analysis of Top Players

    17.2. Market Presence Analysis

18. Competition Landscape (Manufactures/Suppliers)

    18.1. Product Channel Market Strategy Analysis

    18.2. Competitive Benchmarking

    18.3. Competition Developments Analysis

    18.4. Competition Dashboard

    18.5. Competition Deep dive

        18.5.1. Energizer Holding Inc.

        18.5.2. Varta AG

        18.5.3. Toshiba Corporation

        18.5.4. Murata Manufacturing Co., Ltd.

        18.5.5. Panasonic Corporation

        18.5.6. The Swatch Group

        18.5.7. BE Power GmbH

        18.5.8. Maxell Holding, Ltd.

        18.5.9. Duracell Inc.

        18.5.10. EVE Energy Co., Ltd.

        18.5.11. Guangzhou MaiSheng Energy Technology Co., Ltd.

        18.5.12. Suzhou South Large Battery Co., Ltd.

        18.5.13. Shenzhen Pkcell Battery Co., Ltd.

19. Assumptions and Acronyms Used

20. Research Methodology

Sample Report

Report Sample is Available

In-depth report coverage is now just a few seconds away

Download PDF Get FREE Report Sample

List Of Table

List of Tables

Table 01: Global Professional Portable Battery Aftermarket Value (US$ Mn) and Volume (Mn Units) Forecast by Battery Type, 2013–2026

Table 02: Global Professional Portable Battery Aftermarket Value (US$ Mn) and Volume (Mn Units) Forecast by Application, 2013–2026

Table 03: Global Professional Portable Battery Aftermarket Value (US$ Mn) and Volume (Mn Units) Forecast by Healthcare, 2013–2026

Table 04: Global Professional Portable Battery Aftermarket Value (US$ Mn) and Volume (Mn Units) Forecast by Hospitality, 2013–2026

Table 05: Global Professional Portable Battery Aftermarket Value (US$ Mn) and Volume (Mn Units) Forecast by Residential Commercial & Government, 2013–2026

Table 06: Global Professional Portable Battery Aftermarket Value (US$ Mn) and Volume (Mn Units) Forecast by Industrial Equipment & Automation, 2013–2026

Table 07: Global Professional Portable Battery Aftermarket Value (US$ Mn) and Volume (Mn Units) Forecast by Automation & Transportation, 2013–2026

Table 08: Global Professional Portable Battery Aftermarket Value (US$ Mn) and Volume (Mn Units) Forecast by Distribution Channel, 2013–2026

Table 09: Global Professional Portable Battery Aftermarket Value (US$ Mn) and Volume (Mn Units) Forecast by End User, 2013–2026

Table 10: Global Professional Portable Battery Aftermarket Value (US$ Mn) and Volume (Mn Units) Forecast by Region, 2013 – 2026

Table 11: North America Professional Portable Battery Aftermarket Value (US$ Mn) and Volume (Mn Units) Forecast by Country, 2013 – 2026

Table 12: North America Professional Portable Battery Aftermarket Value (US$ Mn) and Volume (Mn Units) Forecast by Battery Type, 2013–2026

Table 13: North America Professional Portable Battery Aftermarket Value (US$ Mn) and Volume (Mn Units) Forecast by Application, 2013–2026

Table 14: North America Professional Portable Battery Aftermarket Value (US$ Mn) and Volume (Mn Units) Forecast by Healthcare, 2013–2026

Table 15: North America Professional Portable Battery Aftermarket Value (US$ Mn) and Volume (Mn Units) Forecast by Hospitality, 2013–2026

Table 16: North America Professional Portable Battery Aftermarket Value (US$ Mn) and Volume (Mn Units) Forecast by Residential Commercial & Government, 2013–2026

Table 17: North America Professional Portable Battery Aftermarket Value (US$ Mn) and Volume (Mn Units) Forecast by Industrial Equipment & Automation, 2013–2026

Table 18: North America Professional Portable Battery Aftermarket Value (US$ Mn) and Volume (Mn Units) Forecast by Automation & Transportation, 2013–2026

Table 19: North America Professional Portable Battery Aftermarket Value (US$ Mn) and Volume (Mn Units) Forecast by Distribution Channel, 2013–2026

Table 20: North America Professional Portable Battery Aftermarket Value (US$ Mn) and Volume (Mn Units) Forecast by End User, 2013–2026

Table 21: Latin America Professional Portable Battery Aftermarket Value (US$ Mn) and Volume (Mn Units) Forecast by Region, 2013–2026

Table 22: Latin America Professional Portable Battery Aftermarket Value (US$ Mn) and Volume (Mn Units) Forecast by Battery Type, 2013–2026

Table 23: Latin America Professional Portable Battery Aftermarket Value (US$ Mn) and Volume (Mn Units) Forecast by Application, 2013–2026

Table 24: Latin America Professional Portable Battery Aftermarket Value (US$ Mn) and Volume (Mn Units) Forecast by Healthcare, 2013–2026

Table 25: Latin America Professional Portable Battery Aftermarket Value (US$ Mn) and Volume (Mn Units) Forecast by Hospitality, 2013–2026

Table 26: Latin America Professional Portable Battery Aftermarket Value (US$ Mn) and Volume (Mn Units) Forecast by Residential Commercial & Government, 2013–2026

Table 27: Latin America Professional Portable Battery Aftermarket Value (US$ Mn) and Volume (Mn Units) Forecast by Industrial Equipment & Automation, 2013–2026

Table 28: Latin America Professional Portable Battery Aftermarket Value (US$ Mn) and Volume (Mn Units) Forecast by Automation & Transportation, 2013–2026

Table 29: Latin America Professional Portable Battery Aftermarket Value (US$ Mn) and Volume (Mn Units) Forecast by Distribution Channel, 2013–2026

Table 30: Latin America Professional Portable Battery Aftermarket Value (US$ Mn) and Volume (Mn Units) Forecast by End User, 2013–2026

Table 31: Europe Professional Portable Battery Aftermarket Value (US$ Mn) and Volume (Mn Units) Forecast by Region, 2013–2026

Table 32: Europe Professional Portable Battery Aftermarket Value (US$ Mn) and Volume (Mn Units) Forecast by Battery Type, 2013–2026

Table 33: Europe Professional Portable Battery Aftermarket Value (US$ Mn) and Volume (Mn Units) Forecast by Application, 2013–2026

Table 34: Europe Professional Portable Battery Aftermarket Value (US$ Mn) and Volume (Mn Units) Forecast by Healthcare, 2013–2026

Table 35: Europe Professional Portable Battery Aftermarket Value (US$ Mn) and Volume (Mn Units) Forecast by Hospitality, 2013–2026

Table 36: Europe Professional Portable Battery Aftermarket Value (US$ Mn) and Volume (Mn Units) Forecast by Residential Commercial & Government, 2013–2026

Table 37: Europe Professional Portable Battery Aftermarket Value (US$ Mn) and Volume (Mn Units) Forecast by Industrial Equipment & Automation, 2013–2026

Table 38: Europe Professional Portable Battery Aftermarket Value (US$ Mn) and Volume (Mn Units) Forecast by Automation & Transportation, 2013–2026

Table 39: Europe Professional Portable Battery Aftermarket Value (US$ Mn) and Volume (Mn Units) Forecast by Distribution Channel, 2013–2026

Table 40: Europe Professional Portable Battery Aftermarket Value (US$ Mn) and Volume (Mn Units) Forecast by End User, 2013–2026

Table 41: SEA & Pacific Professional Portable Battery Aftermarket Value (US$ Mn) and Volume (Mn Units) Forecast by Region, 2013–2026

Table 42: SEA & Pacific Professional Portable Battery Aftermarket Value (US$ Mn) and Volume (Mn Units) Forecast by Battery Type, 2013–2026

Table 43: SEA & Pacific Professional Portable Battery Aftermarket Value (US$ Mn) and Volume (Mn Units) Forecast by Application, 2013–2026

Table 44: SEA & Pacific Professional Portable Battery Aftermarket Value (US$ Mn) and Volume (Mn Units) Forecast by Healthcare, 2013–2026

Table 45: SEA & Pacific Professional Portable Battery Aftermarket Value (US$ Mn) and Volume (Mn Units) Forecast by Hospitality, 2013–2026

Table 46: SEA & Pacific Professional Portable Battery Aftermarket Value (US$ Mn) and Volume (Mn Units) Forecast by Residential Commercial & Government, 2013–2026

Table 47: SEA & Pacific Professional Portable Battery Aftermarket Value (US$ Mn) and Volume (Mn Units) Forecast by Industrial Equipment & Automation, 2013–2026

Table 48: SEA & Pacific Professional Portable Battery Aftermarket Value (US$ Mn) and Volume (Mn Units) Forecast by Automation & Transportation, 2013–2026

Table 49: SEA & Pacific Professional Portable Battery Aftermarket Value (US$ Mn) and Volume (Mn Units) Forecast by Distribution Channel, 2013–2026

Table 50: SEA & Pacific Professional Portable Battery Aftermarket Value (US$ Mn) and Volume (Mn Units) Forecast by End User, 2013–2026

Table 51: China Professional Portable Battery Aftermarket Value (US$ Mn) and Volume (Mn Units) Forecast by Battery Type, 2013–2026

Table 52: China Professional Portable Battery Aftermarket Value (US$ Mn) and Volume (Mn Units) Forecast by Application, 2013–2026

Table 53: China Professional Portable Battery Aftermarket Value (US$ Mn) and Volume (Mn Units) Forecast by Healthcare, 2013–2026

Table 54: China Professional Portable Battery Aftermarket Value (US$ Mn) and Volume (Mn Units) Forecast by Hospitality, 2013–2026

Table 55: China Professional Portable Battery Aftermarket Value (US$ Mn) and Volume (Mn Units) Forecast by Residential Commercial & Government, 2013–2026

Table 56: China Professional Portable Battery Aftermarket Value (US$ Mn) and Volume (Mn Units) Forecast by Industrial Equipment & Automation, 2013–2026

Table 57: China Professional Portable Battery Aftermarket Value (US$ Mn) and Volume (Mn Units) Forecast by Automation & Transportation, 2013–2026

Table 58: China Professional Portable Battery Aftermarket Value (US$ Mn) and Volume (Mn Units) Forecast by Distribution Channel, 2013–2026

Table 59: China Professional Portable Battery Aftermarket Value (US$ Mn) and Volume (Mn Units) Forecast by End User, 2013–2026

Table 60: MEA Professional Portable Battery Aftermarket Value (US$ Mn) and Volume (Mn Units) Forecast by Region, 2013–2026

Table 61: MEA Professional Portable Battery Aftermarket Value (US$ Mn) and Volume (Mn Units) Forecast by Battery Type, 2013–2026

Table 62: MEA Professional Portable Battery Aftermarket Value (US$ Mn) and Volume (Mn Units) Forecast by Application, 2013–2026

Table 63: MEA Professional Portable Battery Aftermarket Value (US$ Mn) and Volume (Mn Units) Forecast by Healthcare, 2013–2026

Table 64: MEA Professional Portable Battery Aftermarket Value (US$ Mn) and Volume (Mn Units) Forecast by Hospitality, 2013–2026

Table 65: MEA Professional Portable Battery Aftermarket Value (US$ Mn) and Volume (Mn Units) Forecast by Residential Commercial & Government, 2013–2026

Table 66: MEA Professional Portable Battery Aftermarket Value (US$ Mn) and Volume (Mn Units) Forecast by Industrial Equipment & Automation, 2013–2026

Table 67: MEA Professional Portable Battery Aftermarket Value (US$ Mn) and Volume (Mn Units) Forecast by Automation & Transportation, 2013–2026

Table 68: MEA Professional Portable Battery Aftermarket Value (US$ Mn) and Volume (Mn Units) Forecast by Distribution Channel, 2013–2026

Table 69: MEA Professional Portable Battery Aftermarket Value (US$ Mn) and Volume (Mn Units) Forecast by End User, 2013–2026

Custom Report Cover

Make This Report Your Own

Take Advantage of Intelligence Tailored to your Business Objective

> Get a Customized Version

- List Of Chart -

List of Figures

Figure 01: Electronic Production by Region

Figure 02: Electrical and Electronic Industry Market Analysis

Figure 03: Electrical and Electronic Industry Market Share by Region, 2016

Figure 04: Production by the global electronics and IT industries composition ratio by field, 2017

Figure 05: Semiconductor Industry Market Analysis

Figure 06: Semiconductor Industry Market Share by Region, 2017

Figure 07: Global Construction Industry Outlook (Y-o-Y Change) V/S professional portable battery market (Y-o-Y Change)

Figure 08: Urbanization Outlook (Y-o-Y Change) V/S professional portable battery market (Y-o-Y Change)

Figure 09: GDP Per Capita (US$) by Country, 2016 & 2017

Figure 10: Global Smart Home Growth Y-o-Y (%) and Professional Portable Battery Sales In Aftermarket Forecast Comparison, 2017 – 2026

Figure 11: North America GDP Growth Y-o-Y (%) and Professional Portable Battery Sales In Aftermarket Forecast Comparison, 2017 – 2026

Figure 12: Latin America GDP Growth Y-o-Y (%) and Professional Portable Battery Sales In Aftermarket Forecast Comparison, 2017 – 2026

Figure 13: Europe GDP Growth Y-o-Y (%) and Professional Portable Battery Sales In Aftermarket Forecast Comparison, 2017 – 2026

Figure 14: APAC GDP Growth Y-o-Y (%) and Professional Portable Battery Sales In Aftermarket Outlook Forecast Comparison, 2017 – 2026

Figure 15: MEA GDP Growth Y-o-Y (%) and Professional Portable Battery Sales In Aftermarket Forecast Comparison, 2017 – 2026

Figure 16: Healthcare sector growth rates through 2020

Figure 17: Global Stainless Steel Production Share, by Region (2017)

Figure 18: Global Stainless Steel Production Volume (Mn Tons), 2013–2017

Figure 19: Global Professional Portable Battery Aftermarket Historical Volume (Mn Units), 2013 – 2017

Figure 20: Global Professional Portable Battery Aftermarket Volume ( Mn Units) Forecast, 2018 – 2026

Figure 21: Global Professional Portable Battery Aftermarket Value (US$ Mn) Forecast, 2013 – 2026

Figure 22: Global Professional Portable Battery Aftermarket Absolute $ Opportunity, 2018 – 2026

Figure 23: Global Professional Portable Battery Aftermarket Share and BPS Analysis by Battery Type – 2018 & 2026

Figure 24: Global Professional Portable Battery Aftermarket Y-o-Y Growth Projections by Battery Type, 2017-2026

Figure 25: Global Professional Portable Battery Aftermarket Attractiveness by Battery Type, 2018-2026

Figure 26: Global Professional Portable Battery Aftermarket Absolute $ Opportunity by Alkaline Battery Segment, 2018 – 2026

Figure 27: Global Professional Portable Battery Aftermarket Absolute $ Opportunity by Lithium Ion Battery Segment, 2018 – 2026

Figure 28: Global Professional Portable Battery Aftermarket Absolute $ Opportunity by Nickel Based & Other Battery Segment, 2018 – 2026

Figure 29: Global Professional Portable Battery Aftermarket Share and BPS Analysis by Application – 2018 & 2026

Figure 30: Global Professional Portable Battery Aftermarket Y-o-Y Growth Projections by Application, 2017-2026

Figure 31: Global Professional Portable Battery Aftermarket Attractiveness by Application, 2018-2026

Figure 32: Global Professional Portable Battery Aftermarket Absolute $ Opportunity by Healthcare Segment, 2018 – 2026

Figure 33: Global Professional Portable Battery Aftermarket Absolute $ Opportunity by Hospitality Segment, 2018 – 2026

Figure 34: Global Professional Portable Battery Aftermarket Absolute $ Opportunity by Residential Commercial & Government Segment, 2018 – 2026

Figure 35: Global Professional Portable Battery Aftermarket Absolute $ Opportunity by Industrial Equipment & Automation Segment, 2018 – 2026

Figure 36: Global Professional Portable Battery Aftermarket Absolute $ Opportunity by Automotive & Transportation Segment, 2018 – 2026

Figure 37: Global Professional Portable Battery Aftermarket Value Y-o-Y (%) Growth Projections by Healthcare, 2017 – 2026

Figure 38: Global Professional Portable Battery Aftermarket Value Share Analysis By Healthcare, 2018 - 2026

Figure 39: Global Professional Portable Battery Aftermarket BPS Analysis By Healthcare, 2018 - 2026

Figure 40: Global Professional Portable Battery Aftermarket Value Y-o-Y (%) Growth Projections by Hospitality, 2017 – 2026

Figure 41: Global Professional Portable Battery Aftermarket Value Share Analysis By Hospitality, 2018 - 2026

Figure 42: Global Professional Portable Battery Aftermarket BPS Analysis By Hospitality, 2018 - 2026

Figure 43: Global Professional Portable Battery Aftermarket Value Y-o-Y (%) Growth Projections by Res. Comm. & Gov., 2017 – 2026

Figure 44: Global Professional Portable Battery Aftermarket Value Share Analysis By Res. Comm. & Gov., 2018 - 2026

Figure 45: Global Professional Portable Battery Aftermarket BPS Analysis By Res. Comm. & Gov., 2018 - 2026

Figure 46: Global Professional Portable Battery Aftermarket Value Y-o-Y (%) Growth Projections by IE & A, 2017 – 2026

Figure 47: Global Professional Portable Battery Aftermarket Value Share Analysis By IE & A, 2018 - 2026

Figure 48: Global Professional Portable Battery Aftermarket BPS Analysis By IE & A, 2018 - 2026

Figure 49: Global Professional Portable Battery Aftermarket Value Y-o-Y (%) Growth Projections by A & T, 2017 – 2026

Figure 50: Global Professional Portable Battery Aftermarket Value Share Analysis By A & T, 2018 - 2026

Figure 51: Global Professional Portable Battery Aftermarket BPS Analysis By A & T, 2018 - 2026

Figure 52: Global Professional Portable Battery Aftermarket Share and BPS Analysis by Distribution Channel – 2018 & 2026

Figure 53: Global Professional Portable Battery Aftermarket Y-o-Y Growth Projections by Distribution Channel, 2017-2026

Figure 54: Global Professional Portable Battery Aftermarket Attractiveness by Distribution Channel, 2018-2026

Figure 55: Global Professional Portable Battery Aftermarket Absolute $ Opportunity by Online Segment, 2018 – 2026

Figure 56: Global Professional Portable Battery Aftermarket Absolute $ Opportunity by Offline Segment, 2018 – 2026

Figure 57: Global Professional Portable Battery Aftermarket Share and BPS Analysis by End User – 2018 & 2026

Figure 58: Global Professional Portable Battery Aftermarket Y-o-Y Growth Projections by End User, 2017-2026

Figure 59: Global Professional Portable Battery Aftermarket Attractiveness by End User, 2018-2026

Figure 60: Global Professional Portable Battery Aftermarket Absolute $ Opportunity by D-i-Y Segment, 2018 – 2026

Figure 61: Global Professional Portable Battery Aftermarket Absolute $ Opportunity by Service Provider Segment, 2018 – 2026

Figure 62: Global Professional Portable Battery Aftermarket Share and BPS Analysis by Region– 2018 & 2026

Figure 63: Global Professional Portable Battery Aftermarket Y-o-Y Growth Projections by Region, 2017 – 2026

Figure 64: Global Professional Portable Battery Aftermarket Attractiveness by Region, 2018 – 2026

Figure 65: North America Professional Portable Battery Aftermarket Absolute $ Opportunity, 2018 – 2026

Figure 66: Latin America Professional Portable Battery Aftermarket Absolute $ Opportunity, 2018 – 2026

Figure 67: Europe Professional Portable Battery Aftermarket Absolute $ Opportunity, 2018 – 2026

Figure 68: SEA & Pacific Professional Portable Battery Aftermarket Absolute $ Opportunity, 2018 – 2026

Figure 69: China Professional Portable Battery Aftermarket Absolute $ Opportunity, 2018 – 2026

Figure 70: MEA Professional Portable Battery Aftermarket Absolute $ Opportunity, 2018 – 2026

Figure 71: North America Professional Portable Battery Aftermarket Share and BPS Analysis by Country –2018 & 2026

Figure 72: North America Professional Portable Battery Aftermarket Y-o-Y Growth Projections by Country, 2017 – 2026

Figure 73: North America Professional Portable Battery Aftermarket Attractiveness by Country, 2018 – 2026

Figure 74: U.S. Professional Portable Battery Aftermarket Absolute $ Opportunity, 2018 – 2026

Figure 75: Canada Professional Portable Battery Aftermarket Absolute $ Opportunity, 2018 – 2026

Figure 76: North America Professional Portable Battery Aftermarket Share and BPS Analysis by Battery Type – 2018 & 2026

Figure 77: North America Professional Portable Battery Aftermarket Y-o-Y Growth Projections by Battery Type, 2017-2026

Figure 78: North America Professional Portable Battery Aftermarket Attractiveness by Battery Type, 2018-2026

Figure 79: North America Professional Portable Battery Aftermarket Share and BPS Analysis by Application – 2018 & 2026

Figure 80: North America Professional Portable Battery Aftermarket Y-o-Y Growth Projections by Application, 2017-2026

Figure 81: North America Professional Portable Battery Aftermarket Attractiveness by Application, 2018-2026

Figure 82: North America Professional Portable Battery Aftermarket Value Y-o-Y (%) Growth Projections by Healthcare, 2017 – 2026

Figure 83: North America Professional Portable Battery Aftermarket Value Share Analysis By Healthcare, 2018 - 2026

Figure 84: North America Professional Portable Battery Aftermarket Value Y-o-Y (%) Growth Projections by Hospitality, 2017 – 2026

Figure 85: North America Professional Portable Battery Aftermarket Value Share Analysis By Hospitality, 2018 - 2026

Figure 86: North America Professional Portable Battery Aftermarket Value Y-o-Y (%) Growth Projections by Residential Commercial & Gov., 2017 – 2026

Figure 87: North America Professional Portable Battery Aftermarket Value Share Analysis By Residential Commercial & Gov., 2018 - 2026

Figure 88: North America Professional Portable Battery Aftermarket Value Y-o-Y (%) Growth Projections by IE & A, 2017 – 2026

Figure 89: North America Professional Portable Battery Aftermarket Value Share Analysis By IE & A, 2018 - 2026

Figure 90: North America Professional Portable Battery Aftermarket Value Y-o-Y (%) Growth Projections by A & T, 2017 – 2026

Figure 91: North America Professional Portable Battery Aftermarket Value Share Analysis By A & T, 2018 - 2026

Figure 92: North America Professional Portable Battery Aftermarket Share and BPS Analysis by Distribution Channel – 2018 & 2026

Figure 93: North America Professional Portable Battery Aftermarket Y-o-Y Growth Projections by Distribution Channel, 2017-2026

Figure 94: North America Professional Portable Battery Aftermarket Attractiveness by Distribution Channel, 2018-2026

Figure 95: North America Professional Portable Battery Aftermarket Share and BPS Analysis by End User – 2018 & 2026

Figure 96: North America Professional Portable Battery Aftermarket Y-o-Y Growth Projections by End User, 2017-2026

Figure 97: North America Professional Portable Battery Aftermarket Attractiveness by End User, 2018-2026

Figure 98: Latin America Professional Portable Battery Aftermarket Share and BPS Analysis by Country– 2018 & 2026

Figure 99: Latin America Professional Portable Battery Aftermarket Y-o-Y Growth Projections by Country, 2018-2026

Figure 100: Latin America Professional Portable Battery Aftermarket Attractiveness by Country, 2013-2026

Figure 101: Mexico Professional Portable Battery Aftermarket Absolute $ Opportunity, 2018-2026

Figure 102: Brazil Professional Portable Battery Aftermarket Absolute $ Opportunity, 2018-2026

Figure 103: Rest of Latin America Professional Portable Battery Aftermarket Absolute $ Opportunity, 2018-2026

Figure 104: Latin America Professional Portable Battery Aftermarket Share and BPS Analysis by Battery Type – 2018 & 2026

Figure 105: Latin America Professional Portable Battery Aftermarket Y-o-Y Growth Projections by Battery Type, 2017-2026

Figure 106: Latin America Professional Portable Battery Aftermarket Attractiveness by Battery Type, 2018-2026

Figure 107: Latin America Professional Portable Battery Aftermarket Share and BPS Analysis by Application – 2018 & 2026

Figure 108: Latin America Professional Portable Battery Aftermarket Y-o-Y Growth Projections by Application, 2017-2026

Figure 109: Latin America Professional Portable Battery Aftermarket Attractiveness by Application, 2018-2026

Figure 110: Latin America Professional Portable Battery Aftermarket Value Y-o-Y (%) Growth Projections by Healthcare, 2017 – 2026

Figure 111: Latin America Professional Portable Battery Aftermarket Value Share Analysis By Healthcare, 2018 - 2026

Figure 112: Latin America Professional Portable Battery Aftermarket Value Y-o-Y (%) Growth Projections by Hospitality, 2017 – 2026

Figure 113: Latin America Professional Portable Battery Aftermarket Value Share Analysis By Hospitality, 2018 - 2026

Figure 114: Latin America Professional Portable Battery Aftermarket Value Y-o-Y (%) Growth Projections by Residential Commercial & Gov., 2017 – 2026

Figure 115: Latin America Professional Portable Battery Aftermarket Value Share Analysis By Residential Commercial & Gov., 2018 - 2026

Figure 116: Latin America Professional Portable Battery Aftermarket Value Y-o-Y (%) Growth Projections by IE & A, 2017 – 2026

Figure 117: Latin America Professional Portable Battery Aftermarket Value Share Analysis By IE & A, 2018 - 2026

Figure 118: Latin America Professional Portable Battery Aftermarket Value Y-o-Y (%) Growth Projections by A & T, 2017 – 2026

Figure 119: Latin America Professional Portable Battery Aftermarket Value Share Analysis By A & T, 2018 - 2026

Figure 120: Latin America Professional Portable Battery Aftermarket Share and BPS Analysis by Distribution Channel – 2018 & 2026

Figure 121: Latin America Professional Portable Battery Aftermarket Y-o-Y Growth Projections by Distribution Channel, 2017-2026

Figure 122: Latin America Professional Portable Battery Aftermarket Attractiveness by Distribution Channel, 2018-2026

Figure 123: Latin America Professional Portable Battery Aftermarket Share and BPS Analysis by End User – 2018 & 2026

Figure 124: Latin America Professional Portable Battery Aftermarket Y-o-Y Growth Projections by End User, 2017-2026

Figure 125: Latin America Professional Portable Battery Aftermarket Attractiveness by End User, 2018-2026

Figure 126: Europe Professional Portable Battery Aftermarket Share and BPS Analysis by Country– 2018 & 2026

Figure 127: Europe Professional Portable Battery Aftermarket Y-o-Y Growth Projections by Country, 2018-2026

Figure 128: Europe Professional Portable Battery Aftermarket Attractiveness by Country, 2013-2026

Figure 129: Germany Professional Portable Battery Aftermarket Absolute $ Opportunity, 2018-2026

Figure 130: France Professional Portable Battery Aftermarket Absolute $ Opportunity, 2018-2026

Figure 131: U.K. Professional Portable Battery Aftermarket Absolute $ Opportunity, 2018-2026

Figure 132: Italy Professional Portable Battery Aftermarket Absolute $ Opportunity, 2018-2026

Figure 133: Spain Professional Portable Battery Aftermarket Absolute $ Opportunity, 2018-2026

Figure 134: Nordic Professional Portable Battery Aftermarket Absolute $ Opportunity, 2018-2026

Figure 135: BENELUX Professional Portable Battery Aftermarket Absolute $ Opportunity, 2018-2026

Figure 136: Russia Professional Portable Battery Aftermarket Absolute $ Opportunity, 2018-2026

Figure 137: Rest of Europe Professional Portable Battery Aftermarket Absolute $ Opportunity, 2018-2026

Figure 138: Europe Professional Portable Battery Aftermarket Share and BPS Analysis by Battery Type – 2018 & 2026

Figure 139: Europe Professional Portable Battery Aftermarket Y-o-Y Growth Projections by Battery Type, 2017-2026

Figure 140: Europe Professional Portable Battery Aftermarket Attractiveness by Battery Type, 2018-2026

Figure 141: Europe Professional Portable Battery Aftermarket Share and BPS Analysis by Application – 2018 & 2026

Figure 142: Europe Professional Portable Battery Aftermarket Y-o-Y Growth Projections by Application, 2017-2026

Figure 143: Europe Professional Portable Battery Aftermarket Attractiveness by Application, 2018-2026

Figure 144: Europe Professional Portable Battery Aftermarket Value Y-o-Y (%) Growth Projections by Healthcare, 2017 – 2026

Figure 145: Europe Professional Portable Battery Aftermarket Value Share Analysis By Healthcare, 2018 - 2026

Figure 146: Europe Professional Portable Battery Aftermarket Value Y-o-Y (%) Growth Projections by Hospitality, 2017 – 2026

Figure 147: Europe Professional Portable Battery Aftermarket Value Share Analysis By Hospitality, 2018 - 2026

Figure 148: Europe Professional Portable Battery Aftermarket Value Y-o-Y (%) Growth Projections by Residential Commercial & Gov., 2017 – 2026

Figure 149: Europe Professional Portable Battery Aftermarket Value Share Analysis By Residential Commercial & Gov., 2018 - 2026

Figure 150: Europe Professional Portable Battery Aftermarket Value Y-o-Y (%) Growth Projections by IE & A, 2017 – 2026

Figure 151: Europe Professional Portable Battery Aftermarket Value Share Analysis By IE & A, 2018 - 2026

Figure 152: Europe Professional Portable Battery Aftermarket Value Y-o-Y (%) Growth Projections by A & T, 2017 – 2026

Figure 153: Europe Professional Portable Battery Aftermarket Value Share Analysis By A & T, 2018 - 2026

Figure 154: Europe Professional Portable Battery Aftermarket Share and BPS Analysis by Distribution Channel – 2018 & 2026

Figure 155: Europe Professional Portable Battery Aftermarket Y-o-Y Growth Projections by Distribution Channel, 2017-2026

Figure 156: Europe Professional Portable Battery Aftermarket Attractiveness by Distribution Channel, 2018-2026

Figure 157: Europe Professional Portable Battery Aftermarket Share and BPS Analysis by End User – 2018 & 2026

Figure 158: Europe Professional Portable Battery Aftermarket Y-o-Y Growth Projections by End User, 2017-2026

Figure 159: Europe Professional Portable Battery Aftermarket Attractiveness by End User, 2018-2026

Figure 160: SEA & Pacific Professional Portable Battery Aftermarket Share and BPS Analysis by Country– 2018 & 2026

Figure 161: SEA & Pacific Professional Portable Battery Aftermarket Y-o-Y Growth Projections by Country, 2017-2026

Figure 162: SEA & Pacific Professional Portable Battery Aftermarket Attractiveness by Country, 2013-2026

Figure 163: India Professional Portable Battery Aftermarket Absolute $ Opportunity, 2018-2026

Figure 164: ASEAN Professional Portable Battery Aftermarket Absolute $ Opportunity, 2018-2026

Figure 165: Japan Professional Portable Battery Aftermarket Absolute $ Opportunity, 2018-2026

Figure 166: Rest of SEA & Pacific Professional Portable Battery Aftermarket Absolute $ Opportunity, 2018-2026

Figure 167: SEA & Pacific Professional Portable Battery Aftermarket Share and BPS Analysis by Battery Type – 2018 & 2026

Figure 168: SEA & Pacific Professional Portable Battery Aftermarket Y-o-Y Growth Projections by Battery Type, 2017-2026

Figure 169: SEA & Pacific Professional Portable Battery Aftermarket Attractiveness by Battery Type, 2018-2026

Figure 170: SEA & Pacific Professional Portable Battery Aftermarket Share and BPS Analysis by Application – 2018 & 2026

Figure 171: SEA & Pacific Professional Portable Battery Aftermarket Y-o-Y Growth Projections by Application, 2017-2026

Figure 172: SEA & Pacific Professional Portable Battery Aftermarket Attractiveness by Application, 2018-2026

Figure 173: SEA & Pacific Professional Portable Battery Aftermarket Value Y-o-Y (%) Growth Projections by Healthcare, 2017 – 2026

Figure 174: SEA & Pacific Professional Portable Battery Aftermarket Value Share Analysis By Healthcare, 2018 - 2026

Figure 175: SEA & Pacific Professional Portable Battery Aftermarket Value Y-o-Y (%) Growth Projections by Hospitality, 2017 – 2026

Figure 176: SEA & Pacific Professional Portable Battery Aftermarket Value Share Analysis By Hospitality, 2018 - 2026

Figure 177: SEA & Pacific Professional Portable Battery Aftermarket Value Y-o-Y (%) Growth Projections by Residential Commercial & Gov., 2017 – 2026

Figure 178: SEA & Pacific Professional Portable Battery Aftermarket Value Share Analysis By Residential Commercial & Gov., 2018 - 2026

Figure 179: SEA & Pacific Professional Portable Battery Aftermarket Value Y-o-Y (%) Growth Projections by IE & A, 2017 – 2026

Figure 180: SEA & Pacific Professional Portable Battery Aftermarket Value Share Analysis By IE & A, 2018 - 2026

Figure 181: SEA & Pacific Professional Portable Battery Aftermarket Value Y-o-Y (%) Growth Projections by A & T, 2017 – 2026

Figure 182: SEA & Pacific Professional Portable Battery Aftermarket Value Share Analysis By A & T, 2018 - 2026

Figure 183: SEA & Pacific Professional Portable Battery Aftermarket Share and BPS Analysis by Distribution Channel – 2018 & 2026

Figure 184: SEA & Pacific Professional Portable Battery Aftermarket Y-o-Y Growth Projections by Distribution Channel, 2017-2026

Figure 185: SEA & Pacific Professional Portable Battery Aftermarket Attractiveness by Distribution Channel, 2018-2026

Figure 186: SEA & Pacific Professional Portable Battery Aftermarket Share and BPS Analysis by End User – 2018 & 2026

Figure 187: SEA & Pacific Professional Portable Battery Aftermarket Y-o-Y Growth Projections by End User, 2017-2026

Figure 188: SEA & Pacific Professional Portable Battery Aftermarket Attractiveness by End User, 2018-2026

Figure 189: China Professional Portable Battery Aftermarket Share and BPS Analysis by Battery Type – 2018 & 2026

Figure 190: China Professional Portable Battery Aftermarket Y-o-Y Growth Projections by Battery Type, 2017-2026

Figure 191: China Professional Portable Battery Aftermarket Attractiveness by Battery Type, 2018-2026

Figure 192: China Professional Portable Battery Aftermarket Share and BPS Analysis by Application – 2018 & 2026

Figure 193: China Professional Portable Battery Aftermarket Y-o-Y Growth Projections by Application, 2017-2026

Figure 194: China Professional Portable Battery Aftermarket Attractiveness by Application, 2018-2026

Figure 195: China Professional Portable Battery Aftermarket Value Y-o-Y (%) Growth Projections by Healthcare, 2017 – 2026

Figure 196: China Professional Portable Battery Aftermarket Value Share Analysis By Healthcare, 2018 - 2026

Figure 197: China Professional Portable Battery Aftermarket Value Y-o-Y (%) Growth Projections by Hospitality, 2017 – 2026

Figure 198: China Professional Portable Battery Aftermarket Value Share Analysis By Hospitality, 2018 - 2026

Figure 199: China Professional Portable Battery Aftermarket Value Y-o-Y (%) Growth Projections by Residential Commercial & Gov., 2017 – 2026

Figure 200: China Professional Portable Battery Aftermarket Value Share Analysis By Residential Commercial & Gov., 2018 - 2026

Figure 201: China Professional Portable Battery Aftermarket Value Y-o-Y (%) Growth Projections by IE & A, 2017 – 2026

Figure 202: China Professional Portable Battery Aftermarket Value Share Analysis By IE & A, 2018 - 2026

Figure 203: China Professional Portable Battery Aftermarket Value Y-o-Y (%) Growth Projections by A & T, 2017 – 2026

Figure 204: China Professional Portable Battery Aftermarket Value Share Analysis By A & T, 2018 - 2026

Figure 205: China Professional Portable Battery Aftermarket Share and BPS Analysis by Distribution Channel – 2018 & 2026

Figure 206: China Professional Portable Battery Aftermarket Y-o-Y Growth Projections by Distribution Channel, 2017-2026

Figure 207: China Professional Portable Battery Aftermarket Attractiveness by Distribution Channel, 2018-2026

Figure 208: China Professional Portable Battery Aftermarket Share and BPS Analysis by End User – 2018 & 2026

Figure 209: China Professional Portable Battery Aftermarket Y-o-Y Growth Projections by End User, 2017-2026

Figure 210: China Professional Portable Battery Aftermarket Attractiveness by End User, 2018-2026

Figure 211: MEA Professional Portable Battery Aftermarket Share and BPS Analysis by Country– 2018 & 2026

Figure 212: MEA Professional Portable Battery Aftermarket Y-o-Y Growth Projections by Country, 2018-2026

Figure 213: MEA Professional Portable Battery Aftermarket Attractiveness by Country, 2013-2026

Figure 214: Turkey Professional Portable Battery Aftermarket Absolute $ Opportunity, 2018-2026

Figure 215: South Africa Professional Portable Battery Aftermarket Absolute $ Opportunity, 2018-2026

Figure 216: Rest of MEA Professional Portable Battery Aftermarket Absolute $ Opportunity, 2018-2026

Figure 217: MEA Professional Portable Battery Aftermarket Share and BPS Analysis by Battery Type – 2018 & 2026

Figure 218: MEA Professional Portable Battery Aftermarket Y-o-Y Growth Projections by Battery Type, 2017-2026

Figure 219: MEA Professional Portable Battery Aftermarket Attractiveness by Battery Type, 2018-2026

Figure 220: MEA Professional Portable Battery Aftermarket Share and BPS Analysis by Application – 2018 & 2026

Figure 221: MEA Professional Portable Battery Aftermarket Y-o-Y Growth Projections by Application, 2017-2026

Figure 222: MEA Professional Portable Battery Aftermarket Attractiveness by Application, 2018-2026

Figure 223: MEA Professional Portable Battery Aftermarket Value Y-o-Y (%) Growth Projections by Healthcare, 2017 – 2026

Figure 224: MEA Professional Portable Battery Aftermarket Value Share Analysis By Healthcare, 2018 - 2026

Figure 225: MEA Professional Portable Battery Aftermarket Value Y-o-Y (%) Growth Projections by Hospitality, 2017 – 2026

Figure 226: MEA Professional Portable Battery Aftermarket Value Share Analysis By Hospitality, 2018 - 2026

Figure 227: MEA Professional Portable Battery Aftermarket Value Y-o-Y (%) Growth Projections by Residential Commercial & Gov., 2017 – 2026

Figure 228: MEA Professional Portable Battery Aftermarket Value Share Analysis By Residential Commercial & Gov., 2018 - 2026

Figure 229: MEA Professional Portable Battery Aftermarket Value Y-o-Y (%) Growth Projections by IE & A, 2017 – 2026

Figure 230: MEA Professional Portable Battery Aftermarket Value Share Analysis By IE & A, 2018 - 2026

Figure 231: MEA Professional Portable Battery Aftermarket Value Y-o-Y (%) Growth Projections by A & T, 2017 – 2026

Figure 232: MEA Professional Portable Battery Aftermarket Value Share Analysis By A & T, 2018 - 2026

Figure 233: MEA Professional Portable Battery Aftermarket Share and BPS Analysis by Distribution Channel – 2018 & 2026

Figure 234: MEA Professional Portable Battery Aftermarket Y-o-Y Growth Projections by Distribution Channel, 2017-2026

Figure 235: MEA Professional Portable Battery Aftermarket Attractiveness by Distribution Channel, 2018-2026

Figure 236: MEA Professional Portable Battery Aftermarket Share and BPS Analysis by End User – 2018 & 2026

Figure 237: MEA Professional Portable Battery Aftermarket Y-o-Y Growth Projections by End User, 2017-2026

Figure 238: MEA Professional Portable Battery Aftermarket Attractiveness by End User, 2018-2026

This site uses cookies, including third-party cookies, that help us to provide and improve our services. Privacy Policy
Google translate