

- Executive Summary
- Global Post Herpetic Neuralgia Treatment Market Snapshot, 2026 and 2033
- Market Opportunity Assessment, 2026 - 2033, US$ Mn
- Key Market Trends
- Future Market Projections
- Premium Market Insights
- Industry Developments and Key Market Events
- PMR Analysis and Recommendations
- Market Overview
- Market Scope and Definition
- Market Dynamics
- Drivers
- Restraints
- Opportunity
- Challenges
- Key Trends
- Macro-Economic Factors
- Global Sectorial Outlook
- Global GDP Growth Outlook
- COVID-19 Impact Analysis
- Forecast Factors - Relevance and Impact
- Value Added Insights
- Regulatory Landscape
- Disease Epidemiology
- Product Adoption Analysis
- Value Chain Analysis
- Key Deals and Mergers
- PESTLE Analysis
- Porter’s Five Force Analysis
- Global Post Herpetic Neuralgia Treatment Market Outlook:
- Key Highlights
- Market Size (US$ Mn) and Y-o-Y Growth
- Absolute $ Opportunity
- Market Size (US$ Mn) Analysis and Forecast
- Historical Market Size (US$ Mn) Analysis, 2020-2025
- Market Size (US$ Mn) Analysis and Forecast, 2026-2033
- Global Post Herpetic Neuralgia Treatment Market Outlook: Treatment Type
- Introduction / Key Findings
- Historical Market Size (US$ Mn) Analysis, By Treatment Type, 2020 - 2025
- Market Size (US$ Mn) Analysis and Forecast, By Treatment Type, 2026 - 2033
- Drugs
- Patches
- Steroid Injectables
- Market Attractiveness Analysis: Treatment Type
- Global Post Herpetic Neuralgia Treatment Market Outlook: Distribution Channel
- Introduction / Key Findings
- Historical Market Size (US$ Mn) Analysis, By Distribution Channel, 2020 - 2025
- Market Size (US$ Mn) Analysis and Forecast, By Distribution Channel, 2026 - 2033
- Institutional Sales
- Retail Sales
- Market Attractiveness Analysis: Distribution Channel
- Key Highlights
- Global Post Herpetic Neuralgia Treatment Market Outlook: Region
- Key Highlights
- Historical Market Size (US$ Mn) Analysis, By Region, 2020 - 2025
- Market Size (US$ Mn) Analysis and Forecast, By Region, 2026 - 2033
- North America
- Europe
- East Asia
- South Asia and Oceania
- Latin America
- Middle East & Africa
- Market Attractiveness Analysis: Region
- North America Post Herpetic Neuralgia Treatment Market Outlook:
- Key Highlights
- Historical Market Size (US$ Mn) Analysis, By Market, 2020 - 2025
- By Country
- By Treatment Type
- By Distribution Channel
- Market Size (US$ Mn) Analysis and Forecast, By Country, 2026 - 2033
- U.S.
- Canada
- Market Size (US$ Mn) Analysis and Forecast, By Treatment Type, 2026 - 2033
- Drugs
- Patches
- Steroid Injectables
- Market Size (US$ Mn) Analysis and Forecast, By Distribution Channel, 2026 - 2033
- Institutional Sales
- Retail Sales
- Market Attractiveness Analysis
- Europe Post Herpetic Neuralgia Treatment Market Outlook:
- Key Highlights
- Historical Market Size (US$ Mn) Analysis, By Market, 2020 - 2025
- By Country
- By Treatment Type
- By Distribution Channel
- Market Size (US$ Mn) Analysis and Forecast, By Country, 2026 - 2033
- Germany
- France
- U.K.
- Italy
- Spain
- Russia
- Rest of Europe
- Market Size (US$ Mn) Analysis and Forecast, By Treatment Type, 2026 - 2033
- Drugs
- Patches
- Steroid Injectables
- Market Size (US$ Mn) Analysis and Forecast, By Distribution Channel, 2026 - 2033
- Institutional Sales
- Retail Sales
- Market Attractiveness Analysis
- East Asia Post Herpetic Neuralgia Treatment Market Outlook:
- Key Highlights
- Historical Market Size (US$ Mn) Analysis, By Market, 2020 - 2025
- By Country
- By Treatment Type
- By Distribution Channel
- Market Size (US$ Mn) Analysis and Forecast, By Country, 2026 - 2033
- China
- Japan
- South Korea
- Market Size (US$ Mn) Analysis and Forecast, By Treatment Type, 2026 - 2033
- Drugs
- Patches
- Steroid Injectables
- Market Size (US$ Mn) Analysis and Forecast, By Distribution Channel, 2026 - 2033
- Institutional Sales
- Retail Sales
- Market Attractiveness Analysis
- South Asia & Oceania Post Herpetic Neuralgia Treatment Market Outlook:
- Key Highlights
- Historical Market Size (US$ Mn) Analysis, By Market, 2020 - 2025
- By Country
- By Treatment Type
- By Distribution Channel
- Market Size (US$ Mn) Analysis and Forecast, By Country, 2026 - 2033
- India
- Southeast Asia
- ANZ
- Rest of South Asia & Oceania
- Market Size (US$ Mn) Analysis and Forecast, By Treatment Type, 2026 - 2033
- Drugs
- Patches
- Steroid Injectables
- Market Size (US$ Mn) Analysis and Forecast, By Distribution Channel, 2026 - 2033
- Institutional Sales
- Retail Sales
- Market Attractiveness Analysis
- Latin America Post Herpetic Neuralgia Treatment Market Outlook:
- Key Highlights
- Historical Market Size (US$ Mn) Analysis, By Market, 2020 - 2025
- By Country
- By Treatment Type
- By Distribution Channel
- Market Size (US$ Mn) Analysis and Forecast, By Country, 2026 - 2033
- Brazil
- Mexico
- Rest of Latin America
- Market Size (US$ Mn) Analysis and Forecast, By Treatment Type, 2026 - 2033
- Drugs
- Patches
- Steroid Injectables
- Market Size (US$ Mn) Analysis and Forecast, By Distribution Channel, 2026 - 2033
- Institutional Sales
- Retail Sales
- Market Attractiveness Analysis
- Middle East & Africa Post Herpetic Neuralgia Treatment Market Outlook:
- Key Highlights
- Historical Market Size (US$ Mn) Analysis, By Market, 2020 - 2025
- By Country
- By Treatment Type
- By Distribution Channel
- Market Size (US$ Mn) Analysis and Forecast, By Country, 2026 - 2033
- GCC Countries
- Egypt
- South Africa
- Northern Africa
- Rest of Middle East & Africa
- Market Size (US$ Mn) Analysis and Forecast, By Treatment Type, 2026 - 2033
- Drugs
- Patches
- Steroid Injectables
- Market Size (US$ Mn) Analysis and Forecast, By Distribution Channel, 2026 - 2033
- Institutional Sales
- Retail Sales
- Market Attractiveness Analysis
- Competition Landscape
- Market Share Analysis, 2025
- Market Structure
- Competition Intensity Mapping By Market
- Competition Dashboard
- Company Profiles (Details - Overview, Financials, Strategy, Recent Developments)
- Pfizer Inc.
- Overview
- Segments and Products
- Key Financials
- Market Developments
- Market Strategy
- Teva Pharmaceutical Industries Ltd.
- Mylan N.V.
- Endo Pharmaceuticals Inc.
- Daiichi Sankyo
- Acorda Therapeutics
- Purdue Pharma L.P
- Teikoku Pharma USA, Inc.
- Janssen Pharmaceuticals, Inc.
- Others
- Pfizer Inc.
- Appendix
- Research Methodology
- Research Assumptions
- Acronyms and Abbreviations


- Pharmaceuticals
- Post-Herpetic Neuralgia Treatment Market
Post-Herpetic Neuralgia Treatment Market Size, Trends, Share, Growth, and Regional Forecast, 2026 to 2033
Post-Herpetic Neuralgia Treatment Market by Treatment Type (Drugs, Patches, Steroid Injectables), Distribution Channel (Institutional Sales, Retail Sales), and Regional Analysis from 2026 to 2033
Key Industry Highlights
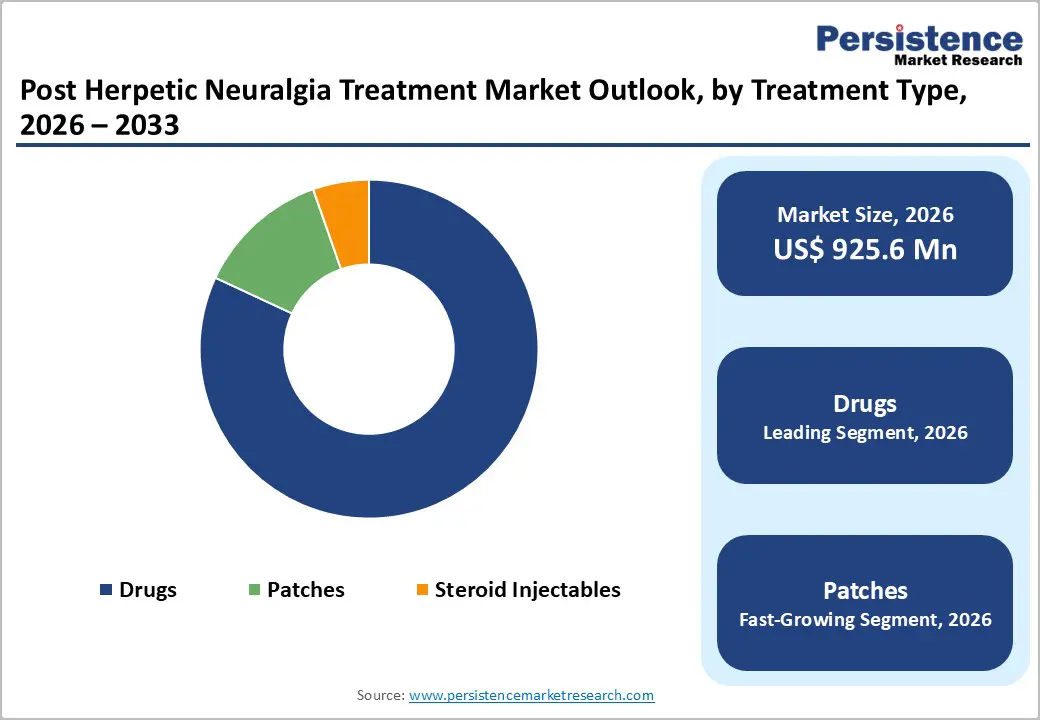
- Dominant Segment: Drugs dominate the PHN treatment market with 81.9% share in 2025, driven by the widespread use of anticonvulsants, antidepressants, opioids, and topical agents as first-line and maintenance therapies for neuropathic pain management.
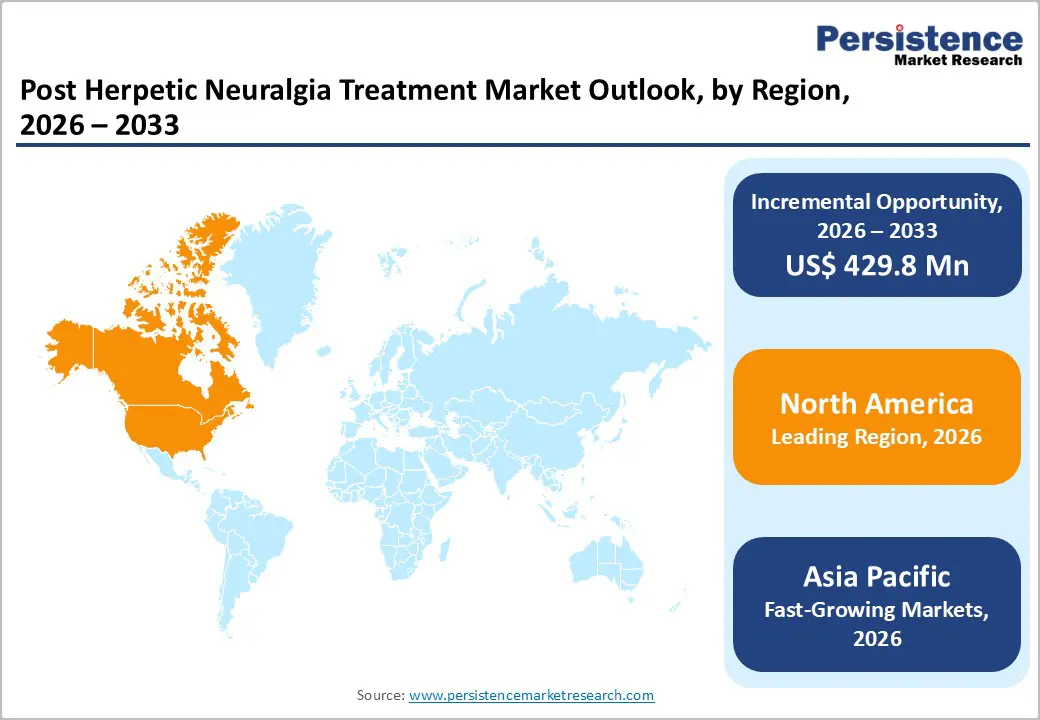
- Dominant Region: North America leads the market in 2025 with 43.0% share, supported by high diagnosis rates, strong pharmaceutical adoption, and favorable reimbursement. Asia Pacific is the fastest-growing region due to rising herpes zoster prevalence, improving healthcare access, and growing awareness of chronic pain management.
- Market Drivers: Growth is driven by an aging population, increasing shingles incidence, longer post-infection survival, improved diagnosis of neuropathic pain, and wider availability of both pharmacological and topical treatment options.
- Market Opportunity: Key opportunities include the development of long-acting topical patches, novel non-opioid pain therapies, combination regimens, improved patient adherence solutions, and market expansion in emerging economies with underserved pain management needs.
| Key Insights | Details |
|---|---|
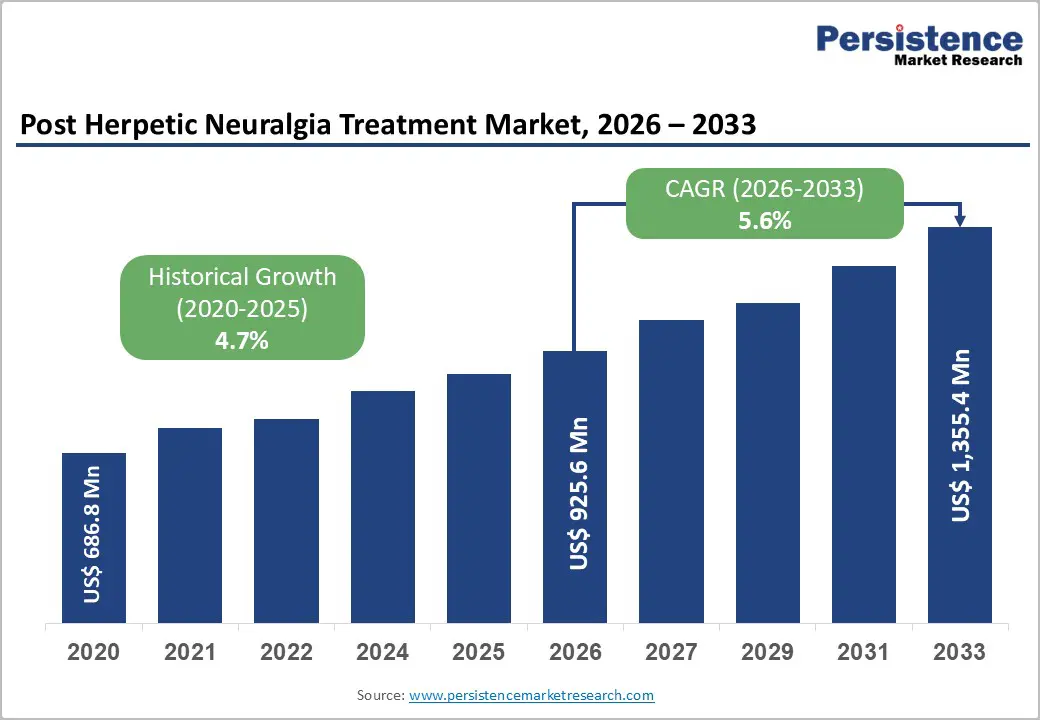
| Post-Herpetic Neuralgia Treatment Market Size (2026E) | US$ 925.6 Mn |
| Market Value Forecast (2033F) | US$ 1,355.4 Mn |
| Projected Growth (CAGR 2026 to 2033) | 5.6% |
| Historical Market Growth (CAGR 2020 to 2025) | 4.7% |
Market Dynamics
Driver - Rapid Global Aging, Increasing Vulnerability to Chronic Neuropathic Pain
The global population is aging rapidly, a trend that directly influences the burden of postherpetic neuralgia (PHN). In 2024, there were approximately 703 million people aged 65 and older worldwide, a figure projected to reach 1.5 billion by 2050. One in six people globally will be 65+ by mid-century. This demographic shift reflects longer life expectancy and declining fertility rates, resulting in a larger elderly population with increased susceptibility to age-related health conditions, including neuropathic pain following shingles infection. An aging population increases the overall pool of individuals at risk for herpes zoster and subsequent PHN.
Age is a well-established risk factor for both shingles and PHN. In the U.S., about one in three people will develop shingles during their lifetime, with risk increasing significantly with age, particularly after age 50. Among shingles patients, 10-18 percent develop PHN, and this complication increases with age; for example, individuals aged 71 and older exhibit far higher PHN incidence rates compared with younger cohorts. The median age of PHN patients is nearly 66 years, underscoring that elderly populations disproportionately experience chronic neuropathic pain following shingles. These age-associated risk patterns support the view that global aging is a key driver of the PHN treatment market.
Restraints - Side Effects and Tolerability Issues Associated with Long-Term Drug Use
A major restraint in the PHN treatment market is side effects and tolerability issues associated with long-term use of systemic medications. First-line drugs such as gabapentin and pregabalin, widely prescribed for PHN pain, are frequently linked to adverse effects like dizziness (up to 24-31 percent), somnolence (17-27 percent), and peripheral edema, which can limit dose escalation and long-term compliance. These central nervous system side effects also include dry mouth, ataxia, weight gain, and cognitive impairment, particularly problematic in elderly patients who represent a large portion of the PHN population. Such tolerability challenges constrain optimal therapy use and patient adherence.
Antidepressants and opioids used in PHN carry their own systemic risks that further restrict long-term use. Tricyclic antidepressants can cause sedation, cardiotoxicity, blurred vision, and urinary retention, making them difficult to tolerate for many patients. Opioid use, though effective for severe pain, is discouraged by the CDC due to the risk of dependence, sedation, and respiratory depression, and is recommended only when safer options fail. These side-effect profiles necessitate cautious prescribing and frequent monitoring, reducing effective treatment uptake and contributing to discontinuation or suboptimal dosing in clinical practice.
Opportunity - Development of Novel Non-Opioid and Disease-Modifying Pain Therapies
A significant opportunity in the PHN treatment market lies in developing novel non-opioid pain therapies that reduce reliance on traditional opioid medications. The 2022 CDC Clinical Practice Guideline strongly recommends maximizing non-opioid and nonpharmacologic options where appropriate because these therapies have lower risk profiles than opioids, which carry addiction and overdose risks. In the United States, prescription opioid use for chronic pain declined from 15.2 percent in 2019 to 13.5 percent in 2020, while nonopioid pharmacologic treatments were used more than twice as often as opioids among adults with chronic pain (31.3 percent nonopioids versus 13.5 percent opioids). This trend underscores the demand for safer, effective alternatives.
Emerging non-opioid analgesics represent an important advancement, with the FDA approving Journavx (suzetrigine) in 2025, the first new class of non-opioid pain medication in two decades, highlighting regulatory support for safer pain management alternatives to opioids. While currently indicated for acute pain, such innovations demonstrate progress toward targeted, non-addictive pain mechanisms that could be adapted for chronic neuropathic conditions like PHN. Given the high unmet need for effective long-term PHN pain relief without opioid risks, investment in disease-modifying and non-opioid therapies could significantly improve patient outcomes and expand market potential.
Category-wise Analysis
By Treatment Type, Drugs Dominate the Post-Herpetic Neuralgia Treatment Market
Drugs dominate with a 89.1% share in 2025, as they are the primary evidence-based first-line therapies recommended in clinical practice for neuropathic pain management. Guideline-supported medications such as tricyclic antidepressants (e.g., nortriptyline), gabapentin, and pregabalin target nerve excitability and conduction, addressing central mechanisms of PHN pain more effectively than localized treatments alone. These agents have demonstrated measurable pain reduction, with pregabalin and gabapentin showing significant benefit in randomized trials. In one large treatment pattern study, gabapentin was prescribed in approximately 15% of PHN patients and remained one of the most used systemic therapies, whereas topical patches like lidocaine were used in less than 10 percent of cases, and other options such as capsaicin patches were rare. This widespread clinical use reflects strong physician reliance on systemic drugs to achieve meaningful pain control across diverse PHN patient populations, particularly in older adults, where neuropathic pain is more severe and chronic.
By Distribution Channel, Retail Sales dominate due to easy access, chronic outpatient prescriptions, repeat refills, and pharmacist support
The retail sales channel dominates the post-herpetic neuralgia (PHN) treatment market because it provides widespread, convenient access to both prescription and over-the-counter therapies outside hospital settings. Retail pharmacies, including local drugstores and national chains, are readily accessible in urban and rural areas, enabling patients with chronic PHN to fill prescriptions for oral anticonvulsants, antidepressants, and topical analgesics without returning to a hospital. This accessibility supports ongoing pain management, particularly for long-term outpatient therapy, and enhances treatment adherence through pharmacist counseling and refill availability. Government and industry data show that retail pharmacies account for the largest share of pain management drug distribution because they dispense the majority of prescriptions in community settings. This broad presence, combined with direct patient interaction and medication counseling, reinforces retail as the dominant PHN distribution channel.
Regional Insights
North America Post-Herpetic Neuralgia Treatment Market Trends
North America dominates the post-herpetic neuralgia treatment market with a 43.0% share in 2025, driven by high disease prevalence, advanced healthcare infrastructure, and strong treatment accessibility. In the United States, approximately 1 million cases of shingles occur annually, with 10-18 percent progressing to PHN, particularly in individuals over 50, creating a substantial patient population requiring effective pain management. The region’s well-established healthcare systems, widespread availability of prescription medications, and strong physician awareness facilitate the broad adoption of both systemic drugs, such as gabapentin and pregabalin, and topical therapies, such as lidocaine patches. Moreover, favorable reimbursement policies and comprehensive insurance coverage support sustained treatment adherence. Consequently, North America accounts for the largest share of global PHN treatment utilization, reflecting both high demand and effective healthcare delivery.
Europe Post-Herpetic Neuralgia Treatment Market Trends
Europe is a key region in the post-herpetic neuralgia treatment market, driven by its significant disease burden and aging population. Across the continent, the annual incidence of herpes zoster ranges from 2.0 to 4.6 cases per 1,000 person-years, rising sharply with age and reaching up to 10 per 1,000 in individuals over 80 years. PHN develops in 10-20 percent of herpes zoster patients, with higher prevalence among older adults, increasing demand for effective chronic pain management. Europe’s rapidly aging population amplifies the public health impact, as older individuals are most susceptible to severe and prolonged PHN. Well-established healthcare systems ensure access to prescription therapies, supportive care, and long-term management, reinforcing Europe’s importance in the PHN treatment market.
Asia Pacific Post-Herpetic Neuralgia Treatment Market Trends
Asia Pacific is the fastest-growing region in the post-herpetic neuralgia treatment market due to rapid demographic change and rising disease burden. The region’s population aged 65 and over is expected to more than double by 2050, increasing demand for management of age-associated conditions such as herpes zoster and PHN. Asia Pacific reports herpes zoster incidence rates of approximately 3-10 cases per 1,000 person-years, with higher rates among older adults, and PHN risk ranging broadly across countries. This rising disease burden, coupled with underserved healthcare needs and growing clinical awareness, is elevating PHN diagnosis and treatment uptake. Improvements in healthcare infrastructure, expanded access to outpatient care, and enhanced chronic pain management capabilities further drive market momentum across the region.
Competitive Landscape
Leading PHN treatment providers focus on developing effective pharmacological therapies, topical formulations, and patient adherence solutions. By improving pain management, enhancing treatment tolerability, and supporting long-term therapy, they increase patient outcomes, facilitate early intervention, and integrate care with healthcare systems, driving adoption and fueling growth in the global market.
Key Industry Developments:
- In May 2024, Teikoku Pharma USA, Inc. received NMPA approval for Lidoderm® in China. This approval allows the company to commercialize its lidocaine patch in the Chinese market, providing patients with a localized pain management option for post-herpetic neuralgia. The move marks a significant expansion of Teikoku Pharma’s international footprint and strengthens access to effective neuropathic pain treatments in Asia.
Companies Covered in Post-Herpetic Neuralgia Treatment Market
- Pfizer Inc.
- Teva Pharmaceutical Industries Ltd.
- Mylan N.V.
- Endo Pharmaceuticals Inc.
- Daiichi Sankyo
- Acorda Therapeutics
- Purdue Pharma L.P
- Teikoku Pharma USA, Inc.
- Janssen Pharmaceuticals, Inc.
- Others
Frequently Asked Questions
The global post herpetic neuralgia treatment market is projected to be valued at US$ 925.6 Mn in 2026.
Rising herpes zoster incidence, aging population, chronic pain prevalence, improved diagnosis, and demand for effective neuropathic pain management drive growth.
The global post herpetic neuralgia treatment market is poised to witness a CAGR of 5.6% between 2026 and 2033.
Opportunities include novel non-opioid therapies, advanced topical formulations, long-acting patches, digital adherence tools, and expansion into emerging healthcare markets.
Pfizer Inc., Teva Pharmaceutical Industries Ltd., Mylan N.V., Endo Pharmaceuticals Inc., Daiichi Sankyo, Acorda Therapeutics.


