

- Executive Summary
- Global Polymerase Chain Reaction Market Snapshot, 2026 and 2033
- Market Opportunity Assessment, 2026 - 2033, US$ Bn
- Key Market Trends
- Future Market Projections
- Premium Market Insights
- Industry Developments and Key Market Events
- PMR Analysis and Recommendations
- Market Overview
- Market Scope and Definition
- Market Dynamics
- Drivers
- Restraints
- Opportunity
- Challenges
- Key Trends
- Macro-Economic Factors
- Global Sectorial Outlook
- Global GDP Growth Outlook
- COVID-19 Impact Analysis
- Forecast Factors - Relevance and Impact
- Value Added Insights
- Product Adoption Analysis
- Regulatory Landscape
- Value Chain Analysis
- Supply Chain Analysis
- Key Deals and Mergers
- PESTLE Analysis
- Porter’s Five Force Analysis
- Global Polymerase Chain Reaction Market Outlook:
- Key Highlights
- Market Size (US$ Bn) and Y-o-Y Growth
- Absolute $ Opportunity
- Market Size (US$ Bn) Analysis and Forecast
- Historical Market Size (US$ Bn) Analysis, 2020-2025
- Market Size (US$ Bn) Analysis and Forecast, 2026-2033
- Global Polymerase Chain Reaction Market Outlook: Product
- Introduction / Key Findings
- Historical Market Size (US$ Bn) Analysis, By Product, 2020 - 2025
- Market Size (US$ Bn) Analysis and Forecast, By Product, 2026 - 2033
- Instruments
- Reagents & Consumables
- Software & Services
- Market Attractiveness Analysis: Product
- Global Polymerase Chain Reaction Market Outlook: Technology
- Introduction / Key Findings
- Historical Market Size (US$ Bn) Analysis, By Technology, 2020 - 2025
- Market Size (US$ Bn) Analysis and Forecast, By Technology, 2026 - 2033
- Conventional PCR
- Real-Time PCR (qPCR)
- Others
- Market Attractiveness Analysis: Technology
- Global Polymerase Chain Reaction Market Outlook: Application
- Introduction / Key Findings
- Historical Market Size (US$ Bn) Analysis, By Application, 2020 - 2025
- Market Size (US$ Bn) Analysis and Forecast, By Application, 2026 - 2033
- Clinical Diagnostics
- Research & Academia
- Forensic Testing
- Food & Environmental Testing
- Market Attractiveness Analysis: Application
- Global Polymerase Chain Reaction Market Outlook: End User
- Introduction / Key Findings
- Historical Market Size (US$ Bn) Analysis, By End User, 2020 - 2025
- Market Size (US$ Bn) Analysis and Forecast, By End User, 2026 - 2033
- Hospitals & Diagnostic Laboratories
- Pharmaceutical & Biotechnology Companies
- Academic & Research Institutes
- Contract Research Organizations (CROs)
- Market Attractiveness Analysis: End User
- Key Highlights
- Global Polymerase Chain Reaction Market Outlook: Region
- Key Highlights
- Historical Market Size (US$ Bn) Analysis, By Region, 2020 - 2025
- Market Size (US$ Bn) Analysis and Forecast, By Region, 2026 - 2033
- North America
- Europe
- East Asia
- South Asia and Oceania
- Latin America
- Middle East & Africa
- Market Attractiveness Analysis: Region
- North America Polymerase Chain Reaction Market Outlook:
- Key Highlights
- Historical Market Size (US$ Bn) Analysis, By Market, 2020 - 2025
- By Country
- By Product
- By Technology
- By Application
- By End User
- Market Size (US$ Bn) Analysis and Forecast, By Country, 2026 - 2033
- U.S.
- Canada
- Market Size (US$ Bn) Analysis and Forecast, By Product, 2026 - 2033
- Instruments
- Reagents & Consumables
- Software & Services
- Market Size (US$ Bn) Analysis and Forecast, By Technology, 2026 - 2033
- Conventional PCR
- Real-Time PCR (qPCR)
- Others
- Market Size (US$ Bn) Analysis and Forecast, By Application, 2026 - 2033
- Clinical Diagnostics
- Research & Academia
- Forensic Testing
- Food & Environmental Testing
- Market Size (US$ Bn) Analysis and Forecast, By End User, 2026 - 2033
- Hospitals & Diagnostic Laboratories
- Pharmaceutical & Biotechnology Companies
- Academic & Research Institutes
- Contract Research Organizations (CROs)
- Market Attractiveness Analysis
- Europe Polymerase Chain Reaction Market Outlook:
- Key Highlights
- Historical Market Size (US$ Bn) Analysis, By Market, 2020 - 2025
- By Country
- By Product
- By Technology
- By Application
- By End User
- Market Size (US$ Bn) Analysis and Forecast, By Country, 2026 - 2033
- Germany
- France
- U.K.
- Italy
- Spain
- Russia
- Türkiye
- Rest of Europe
- Market Size (US$ Bn) Analysis and Forecast, By Product, 2026 - 2033
- Instruments
- Reagents & Consumables
- Software & Services
- Market Size (US$ Bn) Analysis and Forecast, By Technology, 2026 - 2033
- Conventional PCR
- Real-Time PCR (qPCR)
- Others
- Market Size (US$ Bn) Analysis and Forecast, By Application, 2026 - 2033
- Clinical Diagnostics
- Research & Academia
- Forensic Testing
- Food & Environmental Testing
- Market Size (US$ Bn) Analysis and Forecast, By End User, 2026 - 2033
- Hospitals & Diagnostic Laboratories
- Pharmaceutical & Biotechnology Companies
- Academic & Research Institutes
- Contract Research Organizations (CROs)
- Market Attractiveness Analysis
- East Asia Polymerase Chain Reaction Market Outlook:
- Key Highlights
- Historical Market Size (US$ Bn) Analysis, By Market, 2020 - 2025
- By Country
- By Product
- By Technology
- By Application
- By End User
- Market Size (US$ Bn) Analysis and Forecast, By Country, 2026 - 2033
- China
- Japan
- South Korea
- Market Size (US$ Bn) Analysis and Forecast, By Product, 2026 - 2033
- Instruments
- Reagents & Consumables
- Software & Services
- Market Size (US$ Bn) Analysis and Forecast, By Technology, 2026 - 2033
- Conventional PCR
- Real-Time PCR (qPCR)
- Others
- Market Size (US$ Bn) Analysis and Forecast, By Application, 2026 - 2033
- Clinical Diagnostics
- Research & Academia
- Forensic Testing
- Food & Environmental Testing
- Market Size (US$ Bn) Analysis and Forecast, By End User, 2026 - 2033
- Hospitals & Diagnostic Laboratories
- Pharmaceutical & Biotechnology Companies
- Academic & Research Institutes
- Contract Research Organizations (CROs)
- Market Attractiveness Analysis
- South Asia & Oceania Polymerase Chain Reaction Market Outlook:
- Key Highlights
- Historical Market Size (US$ Bn) Analysis, By Market, 2020 - 2025
- By Country
- By Product
- By Technology
- By Application
- By End User
- Market Size (US$ Bn) Analysis and Forecast, By Country, 2026 - 2033
- India
- Southeast Asia
- ANZ
- Rest of South Asia & Oceania
- Market Size (US$ Bn) Analysis and Forecast, By Product, 2026 - 2033
- Instruments
- Reagents & Consumables
- Software & Services
- Market Size (US$ Bn) Analysis and Forecast, By Technology, 2026 - 2033
- Conventional PCR
- Real-Time PCR (qPCR)
- Others
- Market Size (US$ Bn) Analysis and Forecast, By Application, 2026 - 2033
- Clinical Diagnostics
- Research & Academia
- Forensic Testing
- Food & Environmental Testing
- Market Size (US$ Bn) Analysis and Forecast, By End User, 2026 - 2033
- Hospitals & Diagnostic Laboratories
- Pharmaceutical & Biotechnology Companies
- Academic & Research Institutes
- Contract Research Organizations (CROs)
- Market Attractiveness Analysis
- Latin America Polymerase Chain Reaction Market Outlook:
- Key Highlights
- Historical Market Size (US$ Bn) Analysis, By Market, 2020 - 2025
- By Country
- By Product
- By Technology
- By Application
- By End User
- Market Size (US$ Bn) Analysis and Forecast, By Country, 2026 - 2033
- Brazil
- Mexico
- Rest of Latin America
- Market Size (US$ Bn) Analysis and Forecast, By Product, 2026 - 2033
- Instruments
- Reagents & Consumables
- Software & Services
- Market Size (US$ Bn) Analysis and Forecast, By Technology, 2026 - 2033
- Conventional PCR
- Real-Time PCR (qPCR)
- Others
- Market Size (US$ Bn) Analysis and Forecast, By Application, 2026 - 2033
- Clinical Diagnostics
- Research & Academia
- Forensic Testing
- Food & Environmental Testing
- Market Size (US$ Bn) Analysis and Forecast, By End User, 2026 - 2033
- Hospitals & Diagnostic Laboratories
- Pharmaceutical & Biotechnology Companies
- Academic & Research Institutes
- Contract Research Organizations (CROs)
- Market Attractiveness Analysis
- Middle East & Africa Polymerase Chain Reaction Market Outlook:
- Key Highlights
- Historical Market Size (US$ Bn) Analysis, By Market, 2020 - 2025
- By Country
- By Product
- By Technology
- By Application
- By End User
- Market Size (US$ Bn) Analysis and Forecast, By Country, 2026 - 2033
- GCC Countries
- Egypt
- South Africa
- Northern Africa
- Rest of Middle East & Africa
- Market Size (US$ Bn) Analysis and Forecast, By Product, 2026 - 2033
- Instruments
- Reagents & Consumables
- Software & Services
- Market Size (US$ Bn) Analysis and Forecast, By Technology, 2026 - 2033
- Conventional PCR
- Real-Time PCR (qPCR)
- Others
- Market Size (US$ Bn) Analysis and Forecast, By Application, 2026 - 2033
- Clinical Diagnostics
- Research & Academia
- Forensic Testing
- Food & Environmental Testing
- Market Size (US$ Bn) Analysis and Forecast, By End User, 2026 - 2033
- Hospitals & Diagnostic Laboratories
- Pharmaceutical & Biotechnology Companies
- Academic & Research Institutes
- Contract Research Organizations (CROs)
- Market Attractiveness Analysis
- Competition Landscape
- Market Share Analysis, 2025
- Market Structure
- Competition Intensity Mapping By Market
- Competition Dashboard
- Company Profiles (Details - Overview, Financials, Strategy, Recent Developments)
- Thermo Fisher Scientific
- Overview
- Segments and Products
- Key Financials
- Market Developments
- Market Strategy
- Roche Diagnostics
- Bio-Rad Laboratories
- QIAGEN
- Agilent Technologies
- Danaher Corporation (Cepheid, Beckman Coulter)
- Abbott Laboratories
- Siemens Healthineers
- Becton, Dickinson and Company (BD)
- Merck KGaA (MilliporeSigma)
- Takara Bio
- Promega Corporation
- Others
- Thermo Fisher Scientific
- Appendix
- Research Methodology
- Research Assumptions
- Acronyms and Abbreviations


- Biotechnology
- Polymerase Chain Reaction Market
Polymerase Chain Reaction Market Size, Share, Growth, and Regional Forecast, 2026 - 2033
Polymerase Chain Reaction Market by Product (Instruments, Reagents & Consumables, Software & Services), by Technology (Conventional PCR, Real-Time PCR (qPCR), Others), Service, Application, End-user, and Regional Analysis from 2026 - 2033
Key Industry Highlights:
- Rising infectious disease burden continues to fuel PCR demand, particularly for viral and bacterial detection across hospitals, public health labs, and reference diagnostic centers.
- Clinical diagnostics remains the largest application, driven by infectious disease testing, oncology diagnostics, genetic screening, and increasing adoption of molecular testing in routine clinical workflows.
- Real-time PCR (qPCR) dominates technology adoption, owing to its high sensitivity, rapid turnaround time, quantitative accuracy, and broad acceptance in clinical and research laboratories.
- Pharmaceutical and biotechnology companies increasingly use PCR, supporting drug discovery, clinical trials, quality control, and biomarker validation activities.
| Key Insights | Details |
|---|---|
|
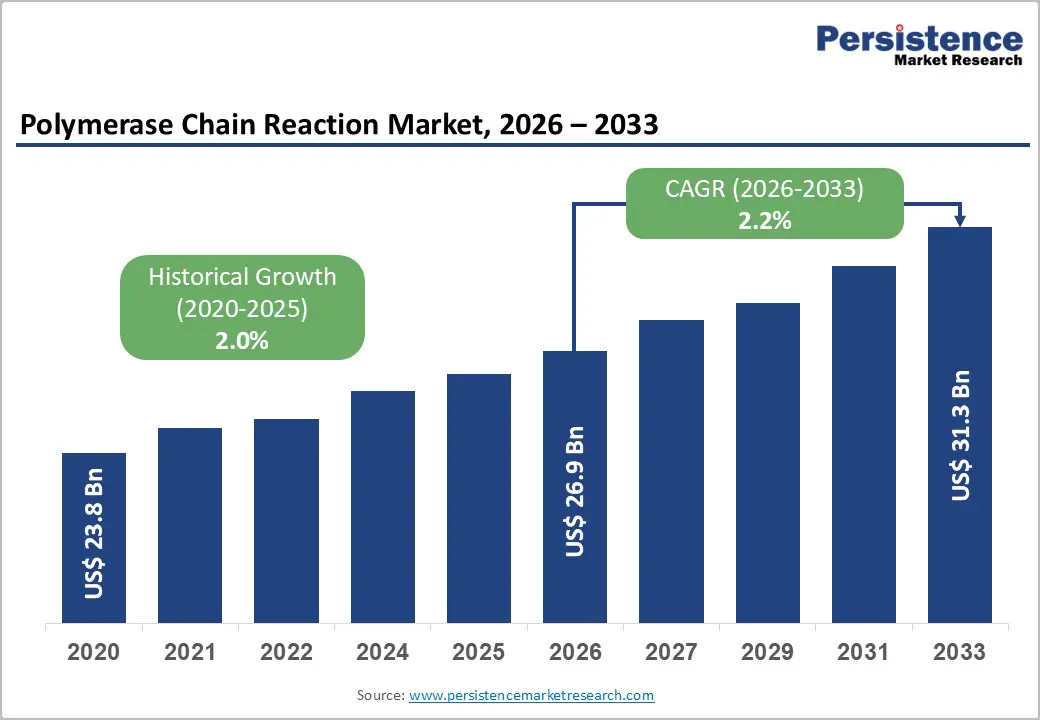
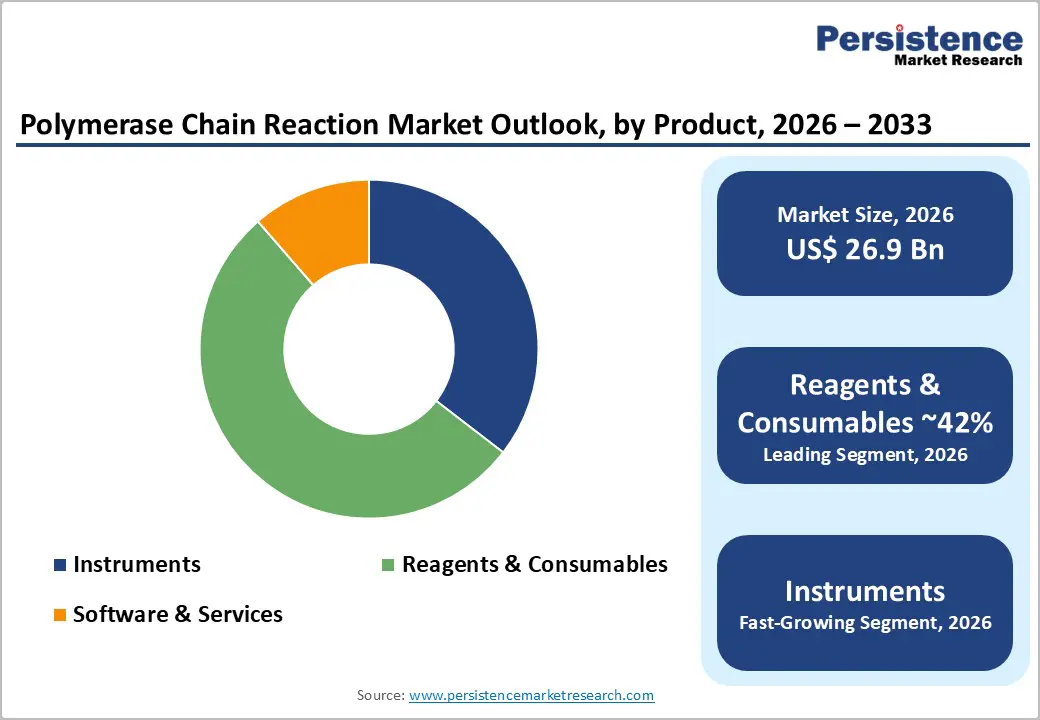
Polymerase Chain Reaction Market Size (2026E) |
US$26.9 Bn |
|
Market Value Forecast (2033F) |
US$31.3 Bn |
|
Projected Growth (CAGR 2026 to 2033) |
2.2% |
|
Historical Market Growth (CAGR 2020 to 2025) |
2.0% |
Market Dynamics
Driver - Shift Toward Precision and Personalized Medicine
The shift toward precision and personalized medicine is fundamentally transforming clinical decision-making, significantly increasing reliance on PCR-based technologies for molecular-level insights. Unlike conventional diagnostic approaches that apply uniform treatment strategies, precision medicine requires accurate identification of genetic mutations, gene expression patterns, and molecular biomarkers that define individual patient profiles. PCR plays a central role in this paradigm by enabling sensitive, rapid, and cost-effective detection of disease-specific genetic alterations.
In oncology, PCR is extensively used for identifying actionable mutations, monitoring minimal residual disease, and guiding targeted therapies, ensuring treatments are tailored to tumor biology rather than tumor location alone. Similarly, in rare genetic and inherited disorders, PCR supports early diagnosis, carrier screening, and confirmatory testing, often serving as the first-line molecular tool due to its high specificity and scalability. The ability of advanced PCR formats, such as real-time and digital PCR, to deliver quantitative and highly reproducible results further strengthens their clinical value. As healthcare systems increasingly prioritize outcome-driven, individualized treatment pathways, PCR continues to evolve from a supportive laboratory technique into a strategic enabler of personalized therapeutic decision-making, reinforcing its long-term importance in precision healthcare.
Restraints - High Dependence on Cold-chain Logistics for Reagents
High dependence on cold-chain logistics for PCR reagents remains a significant operational restraint for the PCR market, particularly in cost-sensitive and geographically diverse regions. Critical reagents such as enzymes, master mixes, probes, and primers require strict temperature control, typically between –20°C and 8°C, throughout manufacturing, transportation, storage, and end use. Maintaining this uninterrupted cold chain increases logistics complexity and cost, especially during long-distance shipping and cross-border distribution. In remote, rural, or low-infrastructure areas, unreliable electricity supply and limited cold-storage facilities further restrict reagent availability, directly impacting testing capacity and turnaround times.
Any temperature excursion during transit or storage can compromise reagent stability, leading to reduced assay performance, false results, or complete reagent wastage. This increases repeat testing, operational inefficiencies, and overall laboratory expenditure. Smaller diagnostic laboratories and emerging market facilities face higher barriers to adoption due to the need for specialized freezers, backup power systems, and validated storage protocols. Additionally, cold-chain dependency complicates emergency response testing and decentralized diagnostics, limiting PCR scalability compared to alternative molecular technologies with room-temperature-stable reagents.
Opportunity - Integration of PCR with AI-driven Data Analysis Platforms
The integration of PCR with AI-driven data analysis platforms represents a transformative opportunity in molecular diagnostics, extending PCR’s value beyond amplification into intelligent decision-making systems. Traditionally, PCR results require expert interpretation, manual threshold setting, and post-analysis validation, which can introduce variability and slow workflows. AI algorithms can automatically analyze amplification curves, detect anomalies, optimize cycle thresholds, and flag inconclusive or low-quality results in real time, significantly improving accuracy and reproducibility.
AI-enabled platforms also support assay optimization, using machine learning to analyze large datasets from previous PCR runs to recommend optimal primer designs, reagent concentrations, and thermal cycling conditions. This reduces trial-and-error experimentation, shortens assay development timelines, and lowers reagent wastage particularly valuable for diagnostic manufacturers and research laboratories.
At a broader level, AI enhances large-scale molecular data management by aggregating PCR results across instruments, laboratories, and geographies into unified dashboards. Pattern recognition models can identify emerging infection trends, mutation hotspots, or shifts in pathogen prevalence, enabling early warning systems for public health surveillance. In oncology and precision medicine, AI-driven PCR analytics can correlate molecular data with clinical outcomes, supporting treatment stratification and therapy monitoring.
For laboratories, AI-PCR integration enables predictive maintenance of instruments, workflow automation, and regulatory-ready audit trails. As testing volumes grow and multiplex assays become more complex, AI transforms PCR from a standalone laboratory technique into a connected, scalable, and intelligence-driven diagnostic ecosystem, creating long-term value for healthcare systems and diagnostics providers.
Category-wise Analysis
By Product Insights
In the Polymerase Chain Reaction (PCR) market, the Reagents & Consumables segment accounts for the largest share, driven by the recurring nature of PCR testing and the essential role these materials play in assay performance. Unlike PCR instruments, which are typically one-time capital investments for laboratories, reagents and consumables are required for every individual test, creating a continuous demand across clinical, research, forensic, and industrial applications. This segment includes DNA/RNA primers, probes, enzymes, buffers, master mixes, PCR tubes, plates, and other disposable components, all of which are indispensable for accurate amplification and reliable results.
The growth of real-time PCR (qPCR) and digital PCR (dPCR) further amplifies demand for high-quality, application-specific reagents. Multiplex assays, which detect multiple targets simultaneously, and specialized kits for infectious disease, oncology, or genetic testing, require sophisticated reagents tailored to each assay’s sensitivity and specificity requirements. Additionally, the increase in PCR-based diagnostics, including COVID-19 testing, cancer biomarker detection, and genetic screening, has significantly expanded the volume of reagents consumed worldwide.
Moreover, consumables like PCR plates, caps, and pipette tips are single-use by design, preventing contamination and ensuring test accuracy, which reinforces their recurring demand. In contrast, PCR instruments and software, while critical, are lower in revenue share because they are purchased less frequently and often have longer replacement cycles. Consequently, reagents and consumables dominate the PCR market, both in revenue contribution and volume usage, forming the backbone of sustained market growth.
By Application Insights
The Clinical Diagnostics segment dominates the PCR market due to its critical role in patient care and disease management. PCR has become a gold standard for molecular diagnostics, enabling rapid, accurate detection of infectious diseases, genetic disorders, and cancer biomarkers. Hospitals, diagnostic laboratories, and reference centers conduct high volumes of tests daily, creating sustained demand for PCR assays, instruments, and consumables. Unlike research or industrial applications, clinical diagnostics requires strict regulatory compliance and validated protocols, which reinforces the adoption of PCR as a reliable, standardized technology across healthcare settings.
Recent developments, such as the COVID-19 pandemic, have dramatically accelerated PCR adoption in clinical laboratories, highlighting its value in large-scale screening, outbreak monitoring, and early intervention. Additionally, the rise of personalized medicine and companion diagnostics drives PCR usage for treatment selection, biomarker monitoring, and minimal residual disease detection, further cementing its importance in patient-centric care.
Clinical diagnostics also generate recurring revenue streams due to the continuous need for reagents, kits, and consumables, which are required for every test, unlike instruments that are one-time investments. In comparison, research & academia, forensic, and food/environmental testing, while growing, operate on lower-volume, specialized workflows. Consequently, clinical diagnostics remains the largest application segment, both in market revenue and test volumes, driving innovation and sustained growth in the PCR market.
Regional Insights
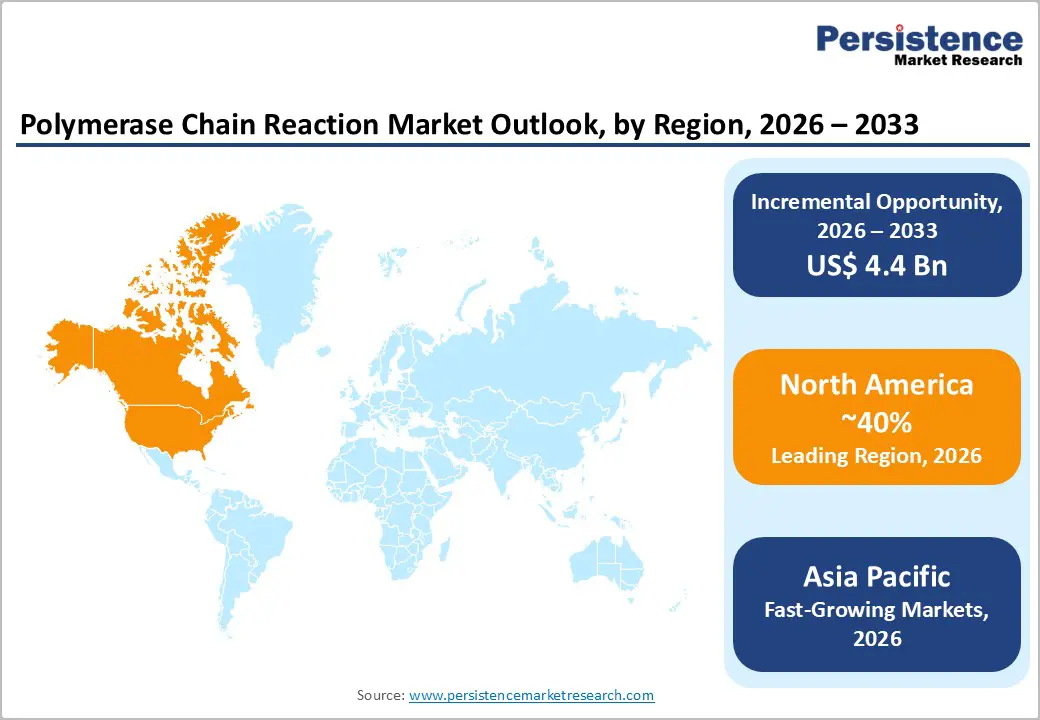
North America Polymerase Chain Reaction Market Trends
North America, particularly the U.S., continues to lead the Polymerase Chain Reaction (PCR) market, driven by advanced healthcare infrastructure, high adoption of molecular diagnostics, and robust research funding. The region has witnessed a rapid surge in PCR-based testing, especially after the COVID-19 pandemic, which highlighted the importance of accurate, high-throughput molecular diagnostics in hospitals, public health laboratories, and private diagnostic centers. The U.S. dominates clinical diagnostics, with widespread integration of real-time PCR (qPCR) and digital PCR (dPCR) in infectious disease detection, oncology, and genetic testing.
Technological innovation is a key trend, with AI-integrated PCR platforms, automation, and high-throughput instruments gaining traction to reduce turnaround times and improve assay accuracy. The U.S. market is also seeing growth in multiplex PCR panels for syndromic testing, liquid biopsy applications, and companion diagnostics, aligning with the expanding precision medicine landscape. Reagents and consumables remain high-revenue contributors, supported by frequent testing in clinical and research laboratories.
Emerging trends include point-of-care PCR devices, decentralized testing, and adoption in preventive healthcare programs. Additionally, collaborations between diagnostics companies and healthcare providers are fostering rapid assay development and deployment, further solidifying North America—and particularly the U.S.mas both a mature market and an innovation hub for PCR technologies.
Asia Pacific Polymerase Chain Reaction Market Trends
The Asia Pacific PCR market is emerging as one of the fastest-growing regions globally, driven by increasing healthcare infrastructure, rising awareness of molecular diagnostics, and expanding government initiatives for disease surveillance. Countries such as China, India, Japan, and South Korea are witnessing rapid adoption of PCR technologies across clinical diagnostics, research, and public health programs. The growing prevalence of infectious diseases, coupled with the need for early detection and personalized medicine, is fueling demand for real-time PCR (qPCR), digital PCR (dPCR), and multiplex PCR assays.
Significant investments in laboratory modernization and automation are enhancing testing efficiency, enabling high-throughput diagnostics and improved workflow integration. Reagents and consumables continue to dominate revenue due to recurring demand from hospitals, diagnostic labs, and research institutes. Additionally, emerging markets in Southeast Asia are adopting point-of-care PCR devices to address decentralized testing needs in rural and semi-urban regions, expanding access to molecular diagnostics.
Research and academia also play a vital role, with increasing government grants and private investments supporting genomic research, infectious disease studies, and biotechnology innovation. Collaborations between local diagnostic companies and global PCR manufacturers are accelerating technology transfer, localized assay development, and cost-effective solutions. Overall, the Asia Pacific region represents a high-growth opportunity in the PCR market, combining rising clinical adoption, research expansion, and technological innovation, positioning it as a strategic hub for future molecular diagnostics.
Competitive Landscape
The competitive landscape for polymerase chain reaction market is characterized by intense rivalry driven by technological innovation, product differentiation, and expanding applications across clinical diagnostics, research, and industrial sectors. Companies compete through the development of high-throughput, automated, and multiplex PCR platforms, along with specialized reagents and consumables to enhance accuracy and efficiency. Strategic collaborations, mergers, and partnerships are common to accelerate assay development and expand regional presence. Market players also focus on cost-effective solutions for emerging regions and point-of-care testing.
Key Industry Developments:
- In December 2025, Roche Diagnostics China released its first quantitative polymerase chain reaction system developed in China. The system was designed specifically for the Chinese market by Roche’s diagnostics unit, which specializes in diagnostic tests, instruments, and digital solutions.
- In August 2025, Bio-Rad Laboratories launched its EZ-Check Salmonella Kit, a rapid PCR-based solution designed for the qualitative detection of Salmonella across a wide range of food and environmental samples.
- In April 2025, Biocartis launched a fully automated, real-time quantitative PCR (qPCR) assay, Idylla, designed to detect the hypermutated phenotype associated with POLE and POLD1 mutations in endometrial cancer, according to a company news release.
Companies Covered in Polymerase Chain Reaction Market
- Thermo Fisher Scientific
- Roche Diagnostics
- Bio-Rad Laboratories
- QIAGEN
- Agilent Technologies
- Danaher Corporation (Cepheid, Beckman Coulter)
- Abbott Laboratories
- Siemens Healthineers
- Becton, Dickinson and Company (BD)
- Merck KGaA (MilliporeSigma)
- Takara Bio
- Promega Corporation
- Others
Frequently Asked Questions
The global polymerase chain reaction market is projected to be valued at US$26.9 Bn in 2026.
PCR is widely used for infectious disease detection, oncology, and genetic testing, making it a gold standard in molecular diagnostics.
The global market is poised to witness a CAGR of 2.2% between 2026 and 2033.
PCR can enable rapid detection of emerging pathogens, antimicrobial resistance, and outbreak monitoring.
Thermo Fisher Scientific, Roche Diagnostics, Bio-Rad Laboratories, QIAGEN, and others.


