

- Executive Summary
- Global Plastic Waste Management Market Snapshot, 2026 and 2033
- Market Opportunity Assessment, 2026 - 2033, US$ Mn
- Key Market Trends
- Future Market Projections
- Premium Market Insights
- Industry Developments and Key Market Events
- PMR Analysis and Recommendations
- Market Overview
- Market Scope and Definition
- Market Dynamics
- Drivers
- Restraints
- Opportunity
- Challenges
- Key Trends
- Product Lifecycle Analysis
- Global Parent Market Overview
- Plastic Waste Management Market: Value Chain
- List of Raw Polymer Type Supplier
- List of Manufacturers
- List of Distributors
- List of End Use Application Industries
- Profitability Analysis
- Forecast Factors - Relevance and Impact
- Covid-19 Impact Assessment
- PESTLE Analysis
- Porter Five Force’s Analysis
- Geopolitical Tensions: Market Impact
- Regulatory and Polymer Type Landscape
- Macro-Economic Factors
- Global Sectorial Outlook
- Global GDP Growth Outlook
- Other Macro-economic Factors
- Price Trend Analysis, 2020 - 2033
- Key Highlights
- Key Factors Impacting Product Prices
- Prices By Plastic Waste /Polymer Type/Organization Size
- Regional Prices and Product Preferences
- Global Plastic Waste Management Market Outlook: Historical (2020 - 2025) and Forecast (2026 - 2033)
- Key Highlights
- Market Size and Y-o-Y Growth
- Absolute $ Opportunity
- Market Size (US$ Mn) Analysis and Forecast
- Historical Market Size Analysis, 2020-2025
- Current Market Size Forecast, 2020-2033
- Global Plastic Waste Management Market Outlook: Type
- Introduction / Key Findings
- Historical Market Size (US$ Mn) Analysis By Plastic Waste , 2020 - 2025
- Current Market Size (US$ Mn) Forecast By Plastic Waste , 2026 - 2033
- Municipal Waste
- Industrial Waste
- Market Attractiveness Analysis: Plastic Waste
- Global Plastic Waste Management Market Outlook: Polymer Type
- Introduction / Key Findings
- Historical Market Size (US$ Mn) Analysis By Polymer Type, 2020 - 2025
- Current Market Size (US$ Mn) Forecast By Polymer Type, 2026 - 2033
- Polyethylene Terephthalate (PET)
- High-Density Polyethylene (HDPE)
- Low-Density Polyethylene (LDPE & LLDPE)
- Polypropylene (PP)
- Polyvinyl Chloride (PVC)
- Polystyrene (PS & EPS)
- Misc.
- Market Attractiveness Analysis: Polymer Type
- Global Plastic Waste Management Market Outlook Processing Treatment
- Introduction / Key Findings
- Historical Market Size (US$ Mn) Analysis By Processing Treatment, 2020 - 2025
- Current Market Size (US$ Mn) Forecast By Processing Treatment, 2026 - 2033
- Collection & Sorting
- Mechanical Recycling
- Chemical Recycling
- Energy Recovery (including Waste-to-Energy)
- Landfilling
- Misc.
- Market Attractiveness Analysis: Processing Treatment
- Global Plastic Waste Management Market Outlook End Use Application
- Introduction / Key Findings
- Historical Market Size (US$ Mn) Analysis By End Use Application, 2020 - 2025
- Current Market Size (US$ Mn) Forecast By End Use Application, 2026 - 2033
- Packaging
- Construction & Infrastructure
- Automotive & Transportation
- Textiles & Clothing
- Consumer Goods & Electronics
- Misc.
- Market Attractiveness Analysis: End Use Application
- Key Highlights
- Global Plastic Waste Management Market Outlook Region
- Key Highlights
- Historical Market Size (US$ Mn) Analysis By Region, 2020 - 2025
- Current Market Size (US$ Mn) Forecast By Region, 2026 - 2033
- North America
- Europe
- East Asia
- South Asia and Oceania
- Latin America
- Middle East & Africa
- Market Attractiveness Analysis: Region
- North America Plastic Waste Management Market Outlook: Historical (2020 - 2025) and Forecast (2026 - 2033)
- Key Highlights
- Pricing Analysis
- Historical Market Size (US$ Mn) Analysis By Market, 2020 - 2025
- By Country
- By Plastic Waste
- By Polymer Type
- By Processing Treatment
- By End Use Application
- Current Market Size (US$ Mn) Forecast By Country, 2026 - 2033
- U.S.
- Canada
- Current Market Size (US$ Mn) Forecast By Plastic Waste , 2026 - 2033
- Municipal Waste
- Industrial Waste
- Current Market Size (US$ Mn) Forecast By Polymer Type, 2026 - 2033
- Polyethylene Terephthalate (PET)
- High-Density Polyethylene (HDPE)
- Low-Density Polyethylene (LDPE & LLDPE)
- Polypropylene (PP)
- Polyvinyl Chloride (PVC)
- Polystyrene (PS & EPS)
- Misc.
- Current Market Size (US$ Mn) Forecast By Processing Treatment, 2026 - 2033
- Collection & Sorting
- Mechanical Recycling
- Chemical Recycling
- Energy Recovery (including Waste-to-Energy)
- Landfilling
- Misc.
- Current Market Size (US$ Mn) Forecast By End Use Application, 2026 - 2033
- Packaging
- Construction & Infrastructure
- Automotive & Transportation
- Textiles & Clothing
- Consumer Goods & Electronics
- Misc.
- Market Attractiveness Analysis
- Europe Plastic Waste Management Market Outlook: Historical (2020 - 2025) and Forecast (2026 - 2033)
- Key Highlights
- Pricing Analysis
- Historical Market Size (US$ Mn) Analysis By Market, 2020 - 2025
- By Country
- By Plastic Waste
- By Polymer Type
- By Processing Treatment
- By End Use Application
- By Current Market Size (US$ Mn) Forecast By Country, 2026 - 2033
- Germany
- Italy
- France
- U.K.
- Spain
- Russia
- Türkiye
- Rest of Europe
- Current Market Size (US$ Mn) Forecast By Plastic Waste , 2026 - 2033
- Municipal Waste
- Industrial Waste
- Current Market Size (US$ Mn) Forecast By Polymer Type, 2026 - 2033
- Polyethylene Terephthalate (PET)
- High-Density Polyethylene (HDPE)
- Low-Density Polyethylene (LDPE & LLDPE)
- Polypropylene (PP)
- Polyvinyl Chloride (PVC)
- Polystyrene (PS & EPS)
- Misc.
- Current Market Size (US$ Mn) Forecast By Processing Treatment, 2026 - 2033
- Collection & Sorting
- Mechanical Recycling
- Chemical Recycling
- Energy Recovery (including Waste-to-Energy)
- Landfilling
- Misc.
- Current Market Size (US$ Mn) Forecast By End Use Application, 2026 - 2033
- Packaging
- Construction & Infrastructure
- Automotive & Transportation
- Textiles & Clothing
- Consumer Goods & Electronics
- Misc.
- Market Attractiveness Analysis
- East Asia Plastic Waste Management Market Outlook: Historical (2020 - 2025) and Forecast (2026 - 2033)
- Key Highlights
- Pricing Analysis
- Historical Market Size (US$ Mn) Analysis By Market, 2020 - 2025
- By Country
- By Plastic Waste
- By Polymer Type
- By Processing Treatment
- By End Use Application
- Current Market Size (US$ Mn) Forecast By Country, 2026 - 2033
- China
- Japan
- South Korea
- Current Market Size (US$ Mn) Forecast By Plastic Waste , 2026 - 2033
- Municipal Waste
- Industrial Waste
- Current Market Size (US$ Mn) Forecast By Polymer Type, 2026 - 2033
- Polyethylene Terephthalate (PET)
- High-Density Polyethylene (HDPE)
- Low-Density Polyethylene (LDPE & LLDPE)
- Polypropylene (PP)
- Polyvinyl Chloride (PVC)
- Polystyrene (PS & EPS)
- Misc.
- Current Market Size (US$ Mn) Forecast By Processing Treatment, 2026 - 2033
- Collection & Sorting
- Mechanical Recycling
- Chemical Recycling
- Energy Recovery (including Waste-to-Energy)
- Landfilling
- Misc.
- Current Market Size (US$ Mn) Forecast By End Use Application, 2026 - 2033
- Packaging
- Construction & Infrastructure
- Automotive & Transportation
- Textiles & Clothing
- Consumer Goods & Electronics
- Misc.
- Market Attractiveness Analysis
- South Asia & Oceania Plastic Waste Management Market Outlook: Historical (2020 - 2025) and Forecast (2026 - 2033)
- Key Highlights
- Pricing Analysis
- Historical Market Size (US$ Mn) Analysis By Market, 2020 - 2025
- By Country
- By Plastic Waste
- By Polymer Type
- By Processing Treatment
- By End Use Application
- Current Market Size (US$ Mn) Forecast By Country, 2026 - 2033
- India
- Southeast Asia
- ANZ
- Rest of South Asia & Oceania
- Current Market Size (US$ Mn) Forecast By Plastic Waste , 2026 - 2033
- Municipal Waste
- Industrial Waste
- Current Market Size (US$ Mn) Forecast By Polymer Type, 2026 - 2033
- Polyethylene Terephthalate (PET)
- High-Density Polyethylene (HDPE)
- Low-Density Polyethylene (LDPE & LLDPE)
- Polypropylene (PP)
- Polyvinyl Chloride (PVC)
- Polystyrene (PS & EPS)
- Misc.
- Current Market Size (US$ Mn) Forecast By Processing Treatment, 2026 - 2033
- Collection & Sorting
- Mechanical Recycling
- Chemical Recycling
- Energy Recovery (including Waste-to-Energy)
- Landfilling
- Misc.
- Current Market Size (US$ Mn) Forecast By End Use Application, 2026 - 2033
- Packaging
- Construction & Infrastructure
- Automotive & Transportation
- Textiles & Clothing
- Consumer Goods & Electronics
- Misc.
- Market Attractiveness Analysis
- Latin America Plastic Waste Management Market Outlook: Historical (2020 - 2025) and Forecast (2026 - 2033)
- Key Highlights
- Pricing Analysis
- Historical Market Size (US$ Mn) Analysis By Market, 2020 - 2025
- By Country
- By Plastic Waste
- By Polymer Type
- By Processing Treatment
- By End Use Application
- Current Market Size (US$ Mn) Forecast By Country, 2026 - 2033
- Brazil
- Mexico
- Rest of Latin America
- Current Market Size (US$ Mn) Forecast By Plastic Waste , 2026 - 2033
- Municipal Waste
- Industrial Waste
- Current Market Size (US$ Mn) Forecast By Polymer Type, 2026 - 2033
- Polyethylene Terephthalate (PET)
- High-Density Polyethylene (HDPE)
- Low-Density Polyethylene (LDPE & LLDPE)
- Polypropylene (PP)
- Polyvinyl Chloride (PVC)
- Polystyrene (PS & EPS)
- Misc.
- Current Market Size (US$ Mn) Forecast By Processing Treatment, 2026 - 2033
- Collection & Sorting
- Mechanical Recycling
- Chemical Recycling
- Energy Recovery (including Waste-to-Energy)
- Landfilling
- Misc.
- Current Market Size (US$ Mn) Forecast By End Use Application, 2026 - 2033
- Packaging
- Construction & Infrastructure
- Automotive & Transportation
- Textiles & Clothing
- Consumer Goods & Electronics
- Misc.
- Market Attractiveness Analysis
- Middle East & Africa Plastic Waste Management Market Outlook: Historical (2020 - 2025) and Forecast (2026 - 2033)
- Key Highlights
- Pricing Analysis
- Historical Market Size (US$ Mn) Analysis By Market, 2020 - 2025
- By Country
- By Plastic Waste
- By Polymer Type
- By Processing Treatment
- By End Use Application
- Current Market Size (US$ Mn) Forecast By Country, 2026 - 2033
- GCC Countries
- South Africa
- Northern Africa
- Rest of MEA
- Current Market Size (US$ Mn) Forecast By Plastic Waste , 2026 - 2033
- Municipal Waste
- Industrial Waste
- Current Market Size (US$ Mn) Forecast By Polymer Type, 2026 - 2033
- Polyethylene Terephthalate (PET)
- High-Density Polyethylene (HDPE)
- Low-Density Polyethylene (LDPE & LLDPE)
- Polypropylene (PP)
- Polyvinyl Chloride (PVC)
- Polystyrene (PS & EPS)
- Misc.
- Current Market Size (US$ Mn) Forecast By Processing Treatment, 2026 - 2033
- Collection & Sorting
- Mechanical Recycling
- Chemical Recycling
- Energy Recovery (including Waste-to-Energy)
- Landfilling
- Misc.
- Current Market Size (US$ Mn) Forecast By End Use Application, 2026 - 2033
- Packaging
- Construction & Infrastructure
- Automotive & Transportation
- Textiles & Clothing
- Consumer Goods & Electronics
- Misc.
- Market Attractiveness Analysis
- Competition Landscape
- Market Share Analysis, 2025
- Market Structure
- Competition Intensity Mapping By Market
- Competition Dashboard
- Apparent Production Capacity
- Company Profiles (Details - Overview, Financials, Strategy, Recent Developments)
- Waste Management Inc.
- Overview
- Segments and Products
- Key Financials
- Market Developments
- Market Strategy
- SUEZ Group
- Veolia Environment S.A.
- Biffa PLC
- Clean Harbors Inc.
- Covanta Holdings Corporation
- Hitachi Zosen Corporation
- Remondis AG & Co. Kg
- Republic Services Inc.
- Stericycle Inc.
- ALBA Group
- Recology
- TANA Oy
- Envac Group
- Waste Management Inc.
- Appendix
- Research Methodology
- Research Assumptions
- Acronyms and Abbreviations


- Specialty & Fine Chemicals
- Plastic Waste Management Market
Plastic Waste Management Market Size, Share, and Growth Forecast, 2026 - 2033
Plastic Waste Management Market by Plastic Waste (Municipal Waste, Industrial Waste), Polymer Type (Collection & Sorting, Mechanical Recycling, Chemical Recycling, Energy Recovery, Landfilling, Misc.), Polymer Type (Polyethylene Terephthalate (PET), High-Density Polyethylene (HDPE), Low-Density Polyethylene (LDPE & LLDPE), Polypropylene (PP), Polyvinyl Chloride (PVC), Polystyrene (PS & EPS), Misc.), Application (Packaging, Construction & Infrastructure, Automotive & Transportation, Textiles & Clothing, Consumer Goods & Electronics, ), Hyperscale) and Regional Analysis for 2026 - 2033
Plastic Waste Management Market Size and Trends Analysis
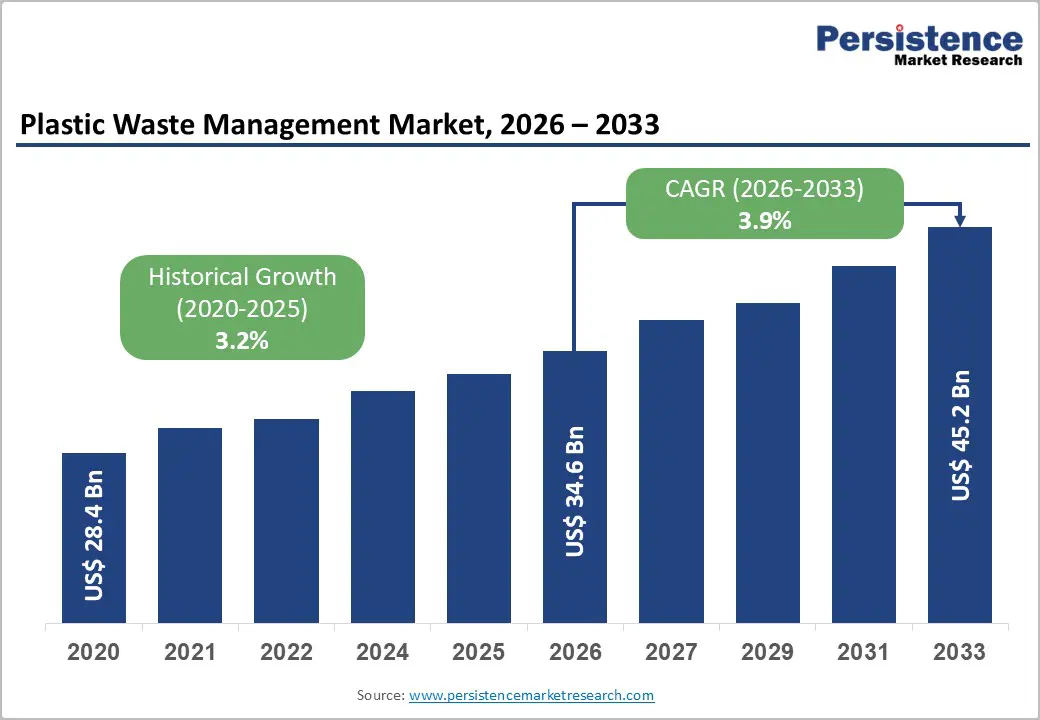
The global plastic waste management market size is likely to be valued at US$ 34.6 billion in 2026 and is projected to reach US$ 45.2 billion by 2033, growing at a CAGR of 3.9% during the forecast period 2026 - 2033.
This expansion reflects mounting regulatory pressures, technological advances in circular-economy solutions, and heightened environmental awareness. The market encompasses collection, sorting, mechanical and chemical recycling, energy recovery, and landfilling operations across municipal and industrial waste streams.
Rising urbanisation, extended producer responsibility (EPR) mandates, and the imperative to reduce plastic leakage into marine and terrestrial ecosystems are catalysing sustained demand for integrated plastic waste management services globally.
Key Industry Highlights:
- Leading Region: Europe holds 24% the Plastic Waste Management market, driven by strict circular economy and EPR legislation, with recycling targets rising toward 70 percent by 2030.
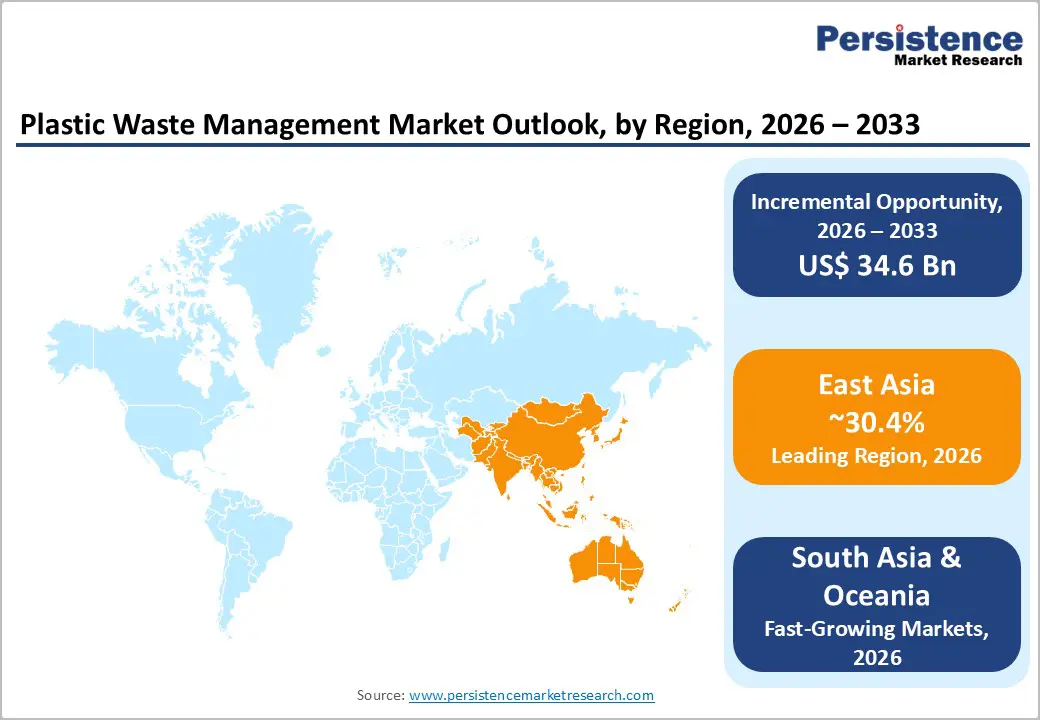
- Fast-growing Region: East Asia accounts for over 30.4% of global market value, supported by China’s circular-economy regulations and advanced waste-treatment infrastructure in Japan and South Korea.
- Dominant Waste Stream: Municipal plastic waste accounts for roughly two-thirds of the market, driven by high-volume consumer packaging and mature curbside collection systems.
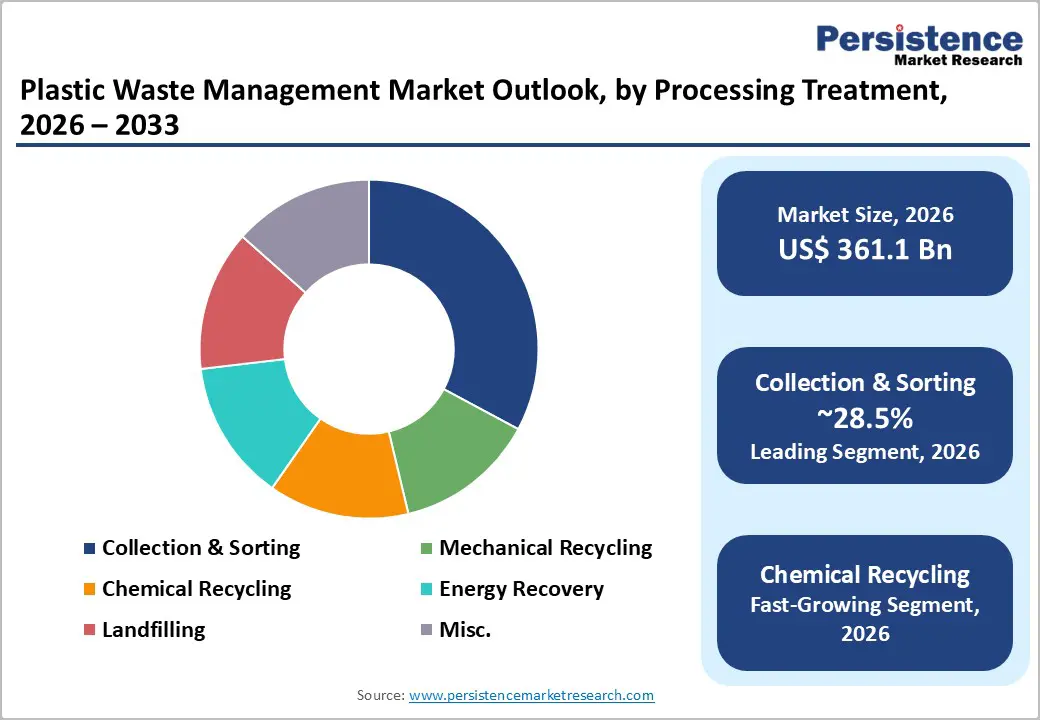
- Fastest-Growing Treatment Technology: Chemical recycling is the fastest-growing segment, with pyrolysis accounting for 45 percent of advanced capacity by 2025 amid multi-billion-dollar investments.
- Regulatory Growth Driver: Tightening EPR mandates and recycled-content regulations across the EU, U.S., Canada, and India are accelerating infrastructure build-out and driving demand for compulsory recycled polymer.
- Industrial Opportunity: Industrial plastic waste valorization is rising as automotive, manufacturing, and consumer goods sectors adopt closed-loop systems and Scope 3 emissions strategies.
- Energy Recovery Integration: Waste-to-Energy systems create circular revenue streams by converting contaminated mixed plastics via gasification, CHP, and pyrolysis-based energy recovery pathways.
| Key Insights | Details |
|---|---|
| Plastic Waste Management Market Size (2026E) | US$ 34.6 Bn |
| Market Value Forecast (2033F) | US$ 45.2 Bn |
| Projected Growth (CAGR 2026 to 2033) | 3.9% |
| Historical Market Growth (CAGR 2020 to 2025) | 3.2% |
Market Dynamics
Drivers - Tightening Extended Producer Responsibility (EPR) Regulations and Circular Economy Policy Mandates
Extended Producer Responsibility frameworks are fundamentally reshaping the Plastic Waste Management Market by shifting collection and processing costs upstream to producers, thereby incentivising packaging redesign and closed-loop material flows. The European Union's 2025 directive mandates 30 per cent recycled content in food-contact plastic packaging by 2030, whereas India's Plastic Waste Management Rules establish targets that escalate from 30 to 50 per cent recycling to 60 to 80 per cent by 2027-28. Canada's mature EPR schemes in British Columbia already achieve 79.6 percent recovery rates, demonstrating commercial viability at scale.
These regulatory instruments transform producer economics: compliance now requires multi-year investment in recycling infrastructure, closed-loop partnerships, and reverse-logistics networks. In the plastic waste management market, EPR-driven mandates have directly accelerated facility construction, with jurisdictions such as California, Minnesota, and Ontario launching state or provincial programs. This regulatory momentum increases addressable market demand by converting discretionary recycling into mandatory compliance obligations, thereby stabilising revenue streams for waste processors and creating premium pricing for certified recycled content.
Rapid Commercialisation of Chemical Recycling Technologies and Advanced Processing Capacity Deployment
Chemical recycling, encompassing pyrolysis, depolymerisation, and gasification, addresses the fundamental limitation of mechanical recycling: the inability to economically process contaminated, mixed, or heavily used plastics. The period 2024-2025 represents a pivotal inflexion point for the Plastic Waste Management Market, with announced global pyrolysis capacity reaching 6 million metric tons annually and over 1 million metric tons of capacity now operational or under construction.
Pyrolysis dominates the chemical recycling segment, with approximately 45 percent of the volume share in 2025, converting mixed plastic waste into pyrolysis oil, diesel, and naphtha suitable for virgin-quality plastics or fuels, thereby circumventing the down-cycling constraints of mechanical methods.
Industry leaders, including Eastman Chemical, ExxonMobil, SABIC, and Neste, collectively control around 55 percent of the advanced recycling market share, leveraging R&D resources and integrated petrochemical infrastructure to scale feedstock recycling. High-profile infrastructure investments, such as Clean Vision Corporation's USD 50 million West Virginia facility that processes 100-500 tons daily, signal investor confidence in the commercial maturity of chemical recycling for the Plastic Waste Management Market. These technological leaps enable processors to monetise previously unrecyclable waste streams, thereby expanding service margins and addressing regulators' concerns regarding actual diversion rates.
Restraint - Persistent Global Dependence on Landfilling and Technical Barriers to Scaling Recycling Infrastructure
Landfilling remains the predominant method of plastic waste disposal, accounting for approximately 300 million metric tons annually globally. The OECD reports that only 9 percent of plastic waste is recycled globally, with a further 15 percent collected, but 40 percent of that is diverted to disposal as residues, while 50 percent enters landfills and 22 percent evades formal waste systems entirely. This structural underperformance reflects capital constraints in emerging markets, contamination challenges in mixed waste streams, and the persistent price competitiveness of landfilling relative to advanced recycling.
The Plastic Waste Management Market faces a fundamental demand-side constraint: absent regulatory mandates with material financial penalties, municipalities and private hauliers lack incentives to shift from landfill-dependent models to costlier mechanical or chemical recycling processes. This inertia particularly affects developing economies lacking EPR enforcement capacity, thereby limiting the geographic expansion of high-margin recycling services.
Opportunity - Industrial Plastic Waste Valorisation and Closed-Loop Manufacturing Systems
Industrial waste is the fastest-growing segment of the Plastic Waste Management Market, driven by the manufacturing, automotive, and appliance sectors seeking to reduce virgin plastic procurement and decarbonise supply chains. Industrial clusters in regions such as Gujarat generate 271,000 tonnes of plastic waste annually, creating captive feedstock pools for localised recycling and circular manufacturing.
Forward-thinking manufacturers are establishing closed-loop systems in which post-consumer or post-industrial plastic scrap is collected, processed, and remanufactured into industrial components, reducing both material costs and Scope 3 carbon emissions. Biffa plc's acquisition of Esterpet and the subsequent integration of recovered content into beverage and cosmetic bottles exemplifies this model. The Plastic Waste Management Market captures value across the chain: collection infrastructure expands, sorting facilities multiply, and advanced processing capacity serves distinct polymer streams. This vertical integration opportunity particularly appeals to multi-billion-dollar waste management firms leveraging existing collection assets to monetise previously discarded industrial streams.
Governments and corporate sustainability commitments are reinforcing adoption by mandating recycled-content percentages and supporting policy incentives, such as plastic taxes on virgin materials, while exempting recycled content. Emerging markets such as India, which formally integrate informal waste workers into documented supply chains through EPR frameworks, unlock additional value by formalising collection and creating dignified employment at scale. The Plastic Waste Management Market therefore benefits from industrial waste valorisation as a dual mechanism: it expands high-margin processing revenue while simultaneously addressing corporate ESG mandates and emerging-market employment imperatives.
Waste-to-Energy Integration and Circular Energy Systems
The global waste-to-energy market is dominated by plastic waste, which accounts for a significant calorific fraction of municipal solid waste streams. Advanced thermal technologies, including gasification, pyrolysis with energy recovery, and combined heat and power systems, enable simultaneous waste diversion and renewable energy generation, reducing reliance on landfills while contributing to grid decarbonization targets. Facilities that process blended plastic waste can achieve a 90 percent volume reduction whilst generating electricity, steam, or hydrogen as auxiliary outputs.
The Plastic Waste Management Market captures this opportunity through hybrid service offerings: integrated collection-to-processing chains now bundle mechanical recycling for high-value polymers (PET, HDPE) with energy recovery for contaminated or mixed streams unsuitable for material recycling. Public-private partnerships in Asia and Europe are accelerating the deployment of WtE projects, with municipal mandates increasingly restricting the landfilling of virgin plastic and incentivising energy recovery.
Republic Services' Las Vegas Polymer Centre, coupled with waste-to-energy capabilities, exemplifies this integration strategy: producers simultaneously generate USD 50+ million in annual revenue from bottle-grade recycled plastics whilst operating energy-recovery infrastructure serving industrial zones. The Plastic Waste Management Market thus expands into the renewable energy value chain, opening new revenue streams and attracting green finance from climate-focused investors.
Category-wise Analysis
Plastic Waste Insights
Municipal plastic waste, comprising single-use packaging, beverage containers, consumer goods, and household applications, dominates the Plastic Waste Management Market at 66.7% in 2026, driven by urbanisation and short product lifecycles. Residential waste streams benefit from mature collection infrastructure such as curbside pickup, municipal landfills, drop-off centers and regulatory visibility, enabling standardised processing workflows. WM's November 2025 USD 1.4 billion investment in North American curbside recycling infrastructure specifically targets municipal waste streams, expanding recyclability of polypropylene cups and paper-to-go containers whilst engaging municipal partners and consumer-facing brands such as Starbucks. European municipal waste generation reached 36.1 kg per resident in 2022, with recycling rates ranging from 30 percent in Denmark, France, and Austria to 55 percent plus in Belgium and Latvia, reflecting disparities in infrastructure investment. The consistency and predictability of municipal waste streams, coupled with regulatory mandates for collection and EPR compliance, ensure stable demand for collection, sorting, and processing services. This segment's dominance drives processor investment in standardised sortation facilities and mechanical recycling infrastructure, thereby anchoring the Plastic Waste Management Market's revenue base and enabling economies of scale.
Industrial plastic waste generated by manufacturing, automotive, chemical, appliance, and construction sectors represents the fastest-expanding segment. Industrial waste streams exhibit distinct compositioncompared to municipal sources, requiring specialised processing infrastructure. Masterflex SE and REMONDIS Recycling's 2023 partnership to establish closed-loop manufacturing for industrial hoses and connection systems exemplifies this opportunity: recovered hoses are reprocessed into high-quality recycled plastics suitable for industrial reintroduction via digital twin tracking.
Processing Treatment Insights
Collection and sorting services accounted for 28.5% of the Plastic Waste Management Market in 2026, representing the foundational stage of all plastic waste recovery pathways. Efficient collection infrastructure, encompassing curbside pickup, municipal drop-off centres, industrial reverse logistics, and informal-sector coordination, directly determines the quality and volume of feedstock available for downstream recycling. Advanced sorting technology now incorporates AI-enabled vision systems, achieving 99.99 percent accuracy in polymer identification, contamination detection, and material segregation, reducing per-ton processing costs by 15-25 percent compared to legacy manual systems.
WM's partnership with The Recycling Partnership and Starbucks emphasises expanding its collection network and running consumer awareness campaigns, illustrating how collection services directly support brand reputation and municipal compliance obligations. European municipalities, facing pressure to meet 70 percent packaging recycling targets by 2030, are investing heavily in collection infrastructure modernisation, creating sustained demand for sorting facility construction and equipment supply. Collection & Sorting services benefit from consistent regulatory demand, high contract renewal rates with municipalities, and recurring revenue models, thereby anchoring the Plastic Waste Management Market with stable, lower-volatility cash flows relative to capital-intensive mechanical or chemical recycling.
Regional Insights and Trends
North America Plastic Waste Management Market Trends
North America represents a mature, high-margin Plastic Waste Management Market segment characterised by advanced infrastructure, stringent EPA regulations, and state-level EPR adoption, accelerating competitive consolidation. The U.S. market is driven by federal and state-mandated plastic pollution reduction strategies, chemical recycling incentives, including state classifications as manufacturing to expedite permitting, and corporate ESG commitments. WM's November 2025 announcement of USD 1.4 billion in recycling infrastructure investment, coupled with November 2022's USD 800 million plastic film recycling program targeting 8 percent U.S. household penetration by 2025, signals sustained capital commitment to municipal waste collection infrastructure enhancement and advanced mechanical processing. California, Massachusetts, and Vermont have enacted or proposed EPR legislation, shifting producer responsibility from municipalities to branded consumer goods and packaging manufacturers; this regulatory shift directly increases demand for collection, sorting, and processing services as producers seek compliance through outsourced waste management partnerships.
Republic Services' strategic acquisition of regional waste operators along the West Coast expands municipal collection footprint, feeding centralised polymer centres, demonstrating horizontal consolidation and vertical integration strategies typical of mature North American markets. Chemical recycling capacity development in the U.S. Gulf Coast region, leveraging colocation with petrochemical infrastructure, abundant utilities, and fossil-fuel off-take agreements, positions North America as a regional hub for advanced plastic-to-chemical conversion, with announced capacity exceeding 1 million metric tons annually by 2027. The Plastic Waste Management Market in North America thus combines steady-state municipal collection demand with accelerating adoption of advanced processing technologies, attractive investment returns, and consolidation among established waste management platforms.
East Asia Plastic Waste Management Market Trends
East Asia accounts for 30.4% of the global Plastic Waste Management market value, driven by China's circular economy mandates targeting 4.5 billion tonnes of annual resource recycling by 2025, alongside Japan's 11 percent waste reduction initiatives and South Korea's 95 percent plus municipal waste treatment rates. China's historic ban on low-grade plastic waste imports fundamentally restructured Asian waste flows, spurring domestic infrastructure development and raising processing standards; this policy shift created sustained demand for advanced sorting, mechanical recycling, and chemical recycling facilities within China, Vietnam, and Indonesia.
SUEZ's September 2023 launch of six collection and sorting centers in Eastern China, which process 30,000 tonnes annually using AI and digitalised systems, reflects the multinational processor's entry into a previously fragmented, informal market, signalling professionalisation and technology adoption across the region.
Japan maintains the highest collection and processing rates in Asia, achieving an 11 percent waste reduction, supported by an established mechanical recycling infrastructure and emerging investment in chemical recycling. Japanese firms, including Hitachi Zosen are conducting feasibility studies on textile fabric pyrolysis gasification, targeting circular solutions for blended synthetic fibres.
Europe Plastic Waste Management Market Trends
Europe is the most mature, tightly regulated, and technologically advanced region in the Plastic Waste Management Market, with established collection infrastructure, 40.7 percent plastic packaging recycling rates, and an ambitious 70 percent target for 2030. The EU's February 2025 EPR regulation mandates 30 percent recycled content in food-contact plastic packaging by 2030, establishing the world's most stringent material specification directive and directly incentivising investment in domestic recycling infrastructure.
European plastic waste generation reached 16.16 million tonnes in 2022, with significant variance across member states: Belgium, Germany, and Luxembourg achieve 55 percent or higher recycling rates, whilst Malta, Denmark, and France report 30 percent or lower, reflecting infrastructure investment and consumer behavior differences. Single-use plastic consumption has declined markedly under EU regulations: lightweight plastic bag consumption fell from 95 bags per capita in 2018 to 65 in 2023, with Belgium, Poland, and Austria already exceeding 2025 targets of fewer than 40 bags per capita, demonstrating policy effectiveness.
Biffa plc's 2023 acquisition by ECP, an energy transition-focused investor in a GBP 2.1 billion transaction, combined with Biffa's purchase of Esterpet, which recovers 25,000 tonnes of PET annually into bottle-grade pellets, exemplifies capital-intensive infrastructure consolidation in mature markets.
Competitive Landscape
The global plastic waste management market is moderately fragmented, with semi-consolidated characteristics: a few large multinational players dominate overall capacity, while numerous regional firms compete at the local level. Leading companies such as Veolia Environnement S.A., Waste Management, Inc., Suez, Republic Services, Inc., Waste Connections Inc., and Clean Harbors, Inc. hold significant market share through extensive collection networks, advanced recycling technologies, and diversified service portfolios. These players focus on mergers & acquisitions, infrastructure expansion, and technological innovation to strengthen their positions.
Smaller regional competitors and niche technology providers intensify competition in localised markets and specialised recycling processes. The market’s growth is also shaped by stringent environmental regulations, urbanisation, and rising demand for circular economic solutions, prompting both global and local players to continuously enhance efficiency and service offerings.
Key Industry Developments
- In November 2025, WM, the leading environmental solutions provider and recycler, expanded its curbside recycling programs to include plastic polypropylene cups and paper to-go cups. This initiative aims to increase the recyclability of commonly discarded beverage containers, with polypropylene cups approaching the “Widely Recyclable” designation and paper cups moving toward the “Check Locally” designation, according to How2Recycle®. WM is investing $1.4 billion in new recycling infrastructure across North America to enhance recycling capabilities and support the circular economy. The move involves collaboration with companies like Starbucks, The Recycling Partnership, and municipalities to improve accessibility and consumer awareness, turning more plastic and paper waste into reusable materials.
- In September 2025, Republic Services announced that recycled PET (rPET) flake produced at its Las Vegas Polymer Center achieves a 54 percent lower carbon footprint compared to typical rPET and 82 percent lower than virgin PET, supporting decarbonization of customer supply chains and reducing Scope 3 emissions. The bottle-grade rPET flake enables bottle-to-bottle circularity and is produced through an integrated process managing post-consumer materials from curbside collection to flake production. The Polymer Center also recovers non-PET materials, enhancing circularity, and is part of a network that includes facilities in Las Vegas and Indianapolis, and an upcoming center in Allentown, Pennsylvania, each capable of producing approximately 120 million pounds of bottle-grade recycled plastics annually.
Companies Covered in Plastic Waste Management Market
- Waste Management Inc.
- SUEZ Group
- Veolia Environment S.A.
- Biffa PLC
- Clean Harbors Inc.
- Covanta Holdings Corporation
- Hitachi Zosen Corporation
- Remondis AG & Co. Kg
- Republic Services Inc.
- Stericycle Inc.
- ALBA Group
Frequently Asked Questions
The global Plastic Waste Management Market is projected to be valued at US$ 34.6 Bn in 2026.
The Collection & Sorting segment is expected to account for approximately 28.5% of the global Plastic Waste Management Market by Processing Treatment in 2026.
The market is expected to witness a CAGR of 3.9% from 2026 to 2033.
Plastic Waste Management Market growth is driven by tightening EPR and circular economic regulations and the rapid commercialisation of advanced chemical recycling technologies.
Key market opportunities in the Plastic Waste Management Market include industrial plastic waste valorisation with closed-loop manufacturing systems and the integration of waste-to-energy circular energy solutions.
Key players in the Plastic Waste Management Market include Veolia Environnement S.A., Waste Management, Inc., Suez, Republic Services, Inc., Waste Connections Inc., and Clean Harbors, Inc.


