


- Executive Summary
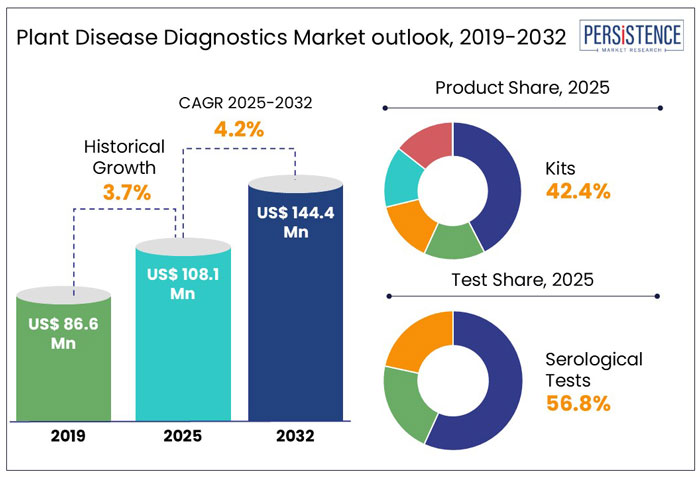
- Global Plant Disease Diagnostics Market Snapshot, 2025 and 2032
- Market Opportunity Assessment, 2024 – 2032, US$ Mn
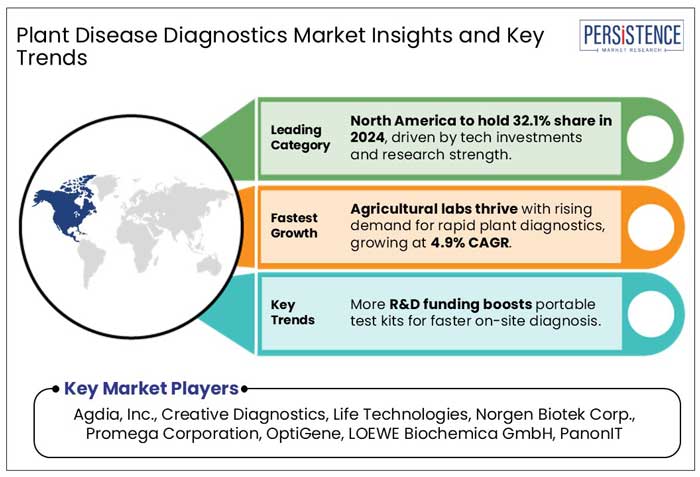
- Key Market Trends
- Future Market Projections
- Premium Market Insights
- Industry Developments and Key Market Events
- PMR Analysis and Recommendations
- Market Overview
- Market Scope and Definition
- Market Dynamics
- Drivers
- Restraints
- Opportunity
- Key Trends
- Macro-Economic Factors
- Global Sectorial Outlook
- Global GDP Growth Outlook
- COVID-19 Impact Analysis
- Forecast Factors – Relevance and Impact
- Value Added Insights
- Product Adoption Analysis
- Regulatory Landscape
- Value Chain Analysis
- PESTLE Analysis
- Porter’s Five Force Analysis
- Global Plant Disease Diagnostics Market Outlook
- Key Highlights
- Market Size (US$ Mn) and Y-o-Y Growth
- Absolute $ Opportunity
- Market Size (US$ Mn) Analysis and Forecast
- Historical Market Size (US$ Mn) Analysis, 2019-2023
- Current Market Size (US$ Mn) Analysis and Forecast, 2024 – 2032
- Global Plant Disease Diagnostics Market Outlook: Product
- Introduction / Key Findings
- Historical Market Size (US$ Mn) Analysis, By Product, 2019 – 2023
- Current Market Size (US$ Mn) Analysis and Forecast, By Product, 2024 – 2032
- Kits
- Elisa Kits
- DNA Based Diagnostics Kits
- Protein Based Diagnostics Kits
- Lateral Flow Devices
- DNA/RNA Probes
- Accessories and Other Consumables
- Software and Cloud Databases
- Kits
- Market Attractiveness Analysis: Product
- Global Plant Disease Diagnostics Market Outlook: Test
- Introduction / Key Findings
- Historical Market Size (US$ Mn), By Test, 2019 – 2023
- Current Market Size (US$ Mn) Analysis and Forecast, By Test, 2024 – 2032
- Molecular Tests
- PCR- Based Assays
- PCR & RT-PCR
- Multiplex PCR
- Isothermal Amplification Assays
- Microarray Assay
- NASBA
- The LAMP Assay
- PCR- Based Assays
- Serological Tests
- ELSIA
- TBIA
- QCMI
- Tests Using Electronic Technology
- Molecular Tests
- Market Attractiveness Analysis: Test
- Global Plant Disease Diagnostics Market Outlook: Sample
- Introduction / Key Findings
- Historical Market Size (US$ Mn), By Sample, 2019 – 2023
- Current Market Size (US$ Mn) Analysis and Forecast, By Sample, 2024 – 2032
- Seeds
- Grains
- Plants
- Trees
- Fruits
- Others
- Market Attractiveness Analysis: Sample
- Global Plant Disease Diagnostics Market Outlook: End User
- Introduction / Key Findings
- Historical Market Size (US$ Mn) Analysis, By End User, 2019 – 2023
- Current Market Size (US$ Mn) Analysis and Forecast, By End User, 2024 – 2032
- Agricultural Laboratories
- Academic and Research Institutes
- Food Processing Laboratories
- Contract Research Organization
- Others
- Market Attractiveness Analysis: End User
- Key Highlights
- Global Plant Disease Diagnostics Market Outlook: Region
- Key Highlights
- Historical Market Size (US$ Mn) Analysis, By Region, 2019 – 2023
- Current Market Size (US$ Mn) Analysis and Forecast, By Region, 2024 – 2032
- North America
- Europe
- East Asia
- South Asia and Oceania
- Latin America
- Middle East & Africa
- Market Attractiveness Analysis: Region
- North America Plant Disease Diagnostics Market Outlook
- Key Highlights
- Historical Market Size (US$ Mn) Analysis, By Market, 2019 – 2023
- By Country
- By Product
- By Test
- By Sample
- By End User
- Current Market Size (US$ Mn) Analysis and Forecast, By Country, 2024 – 2032
- U.S.
- Canada
- Current Market Size (US$ Mn) Analysis and Forecast, By Product, 2024 – 2032
- Kits
- Elisa Kits
- DNA Based Diagnostics Kits
- Protein Based Diagnostics Kits
- Lateral Flow Devices
- DNA/RNA Probes
- Accessories and Other Consumables
- Software and Cloud Databases
- Kits
- Current Market Size (US$ Mn) Analysis and Forecast, By Test, 2024 – 2032
- Molecular Tests
- PCR- Based Assays
- PCR & RT-PCR
- Multiplex PCR
- Isothermal Amplification Assays
- Microarray Assay
- NASBA
- The LAMP Assay
- PCR- Based Assays
- Serological Tests
- ELSIA
- TBIA
- QCMI
- Tests Using Electronic Technology
- Molecular Tests
- Current Market Size (US$ Mn) Analysis and Forecast, By Sample, 2024 – 2032
- Seeds
- Grains
- Plants
- Trees
- Fruits
- Others
- Current Market Size (US$ Mn) Analysis and Forecast, By End User, 2024 – 2032
- Agricultural Laboratories
- Academic and Research Institutes
- Food Processing Laboratories
- Contract Research Organization
- Others
- Market Attractiveness Analysis
- Europe Plant Disease Diagnostics Market Outlook
- Key Highlights
- Historical Market Size (US$ Mn) Analysis, By Market, 2019 – 2023
- By Country
- By Product
- By Test
- By Sample
- By End User
- Current Market Size (US$ Mn) Analysis and Forecast, By Country, 2024 – 2032
- Germany
- France
- U.K.
- Italy
- Spain
- Russia
- Türkiye
- Rest of Europe
- Current Market Size (US$ Mn) Analysis and Forecast, By Product, 2024 – 2032
- Kits
- Elisa Kits
- DNA Based Diagnostics Kits
- Protein Based Diagnostics Kits
- Lateral Flow Devices
- DNA/RNA Probes
- Accessories and Other Consumables
- Software and Cloud Databases
- Kits
- Current Market Size (US$ Mn) Analysis and Forecast, By Test, 2024 – 2032
- Molecular Tests
- PCR- Based Assays
- PCR & RT-PCR
- Multiplex PCR
- Isothermal Amplification Assays
- Microarray Assay
- NASBA
- The LAMP Assay
- PCR- Based Assays
- Serological Tests
- ELSIA
- TBIA
- QCMI
- Tests Using Electronic Technology
- Molecular Tests
- Current Market Size (US$ Mn) Analysis and Forecast, By Sample, 2024 – 2032
- Seeds
- Grains
- Plants
- Trees
- Fruits
- Others
- Current Market Size (US$ Mn) Analysis and Forecast, By End User, 2024 – 2032
- Agricultural Laboratories
- Academic and Research Institutes
- Food Processing Laboratories
- Contract Research Organization
- Others
- Market Attractiveness Analysis
- East Asia Plant Disease Diagnostics Market Outlook
- Key Highlights
- Historical Market Size (US$ Mn) Analysis, By Market, 2019 – 2023
- By Country
- By Product
- By Test
- By Sample
- By End User
- Current Market Size (US$ Mn) Analysis and Forecast, By Country, 2024 – 2032
- China
- Japan
- South Korea
- Current Market Size (US$ Mn) Analysis and Forecast, By Product, 2024 – 2032
- Kits
- Elisa Kits
- DNA Based Diagnostics Kits
- Protein Based Diagnostics Kits
- Lateral Flow Devices
- DNA/RNA Probes
- Accessories and Other Consumables
- Software and Cloud Databases
- Kits
- Current Market Size (US$ Mn) Analysis and Forecast, By Test, 2024 – 2032
- Molecular Tests
- PCR- Based Assays
- PCR & RT-PCR
- Multiplex PCR
- Isothermal Amplification Assays
- Microarray Assay
- NASBA
- The LAMP Assay
- PCR- Based Assays
- Serological Tests
- ELSIA
- TBIA
- QCMI
- Tests Using Electronic Technology
- Molecular Tests
- Current Market Size (US$ Mn) Analysis and Forecast, By Sample, 2024 – 2032
- Seeds
- Grains
- Plants
- Trees
- Fruits
- Others
- Current Market Size (US$ Mn) Analysis and Forecast, By End User, 2024 – 2032
- Agricultural Laboratories
- Academic and Research Institutes
- Food Processing Laboratories
- Contract Research Organization
- Others
- Market Attractiveness Analysis
- South Asia & Oceania Plant Disease Diagnostics Market Outlook
- Key Highlights
- Historical Market Size (US$ Mn) Analysis, By Market, 2019 – 2023
- By Country
- By Product
- By Test
- By Sample
- By End User
- Current Market Size (US$ Mn) Analysis and Forecast, By Country, 2024 – 2032
- India
- Southeast Asia
- ANZ
- Rest of South Asia & Oceania
- Current Market Size (US$ Mn) Analysis and Forecast, By Product, 2024 – 2032
- Kits
- Elisa Kits
- DNA Based Diagnostics Kits
- Protein Based Diagnostics Kits
- Lateral Flow Devices
- DNA/RNA Probes
- Accessories and Other Consumables
- Software and Cloud Databases
- Kits
- Current Market Size (US$ Mn) Analysis and Forecast, By Test, 2024 – 2032
- Molecular Tests
- PCR- Based Assays
- PCR & RT-PCR
- Multiplex PCR
- Isothermal Amplification Assays
- Microarray Assay
- NASBA
- The LAMP Assay
- PCR- Based Assays
- Serological Tests
- ELSIA
- TBIA
- QCMI
- Tests Using Electronic Technology
- Molecular Tests
- Current Market Size (US$ Mn) Analysis and Forecast, By Sample, 2024 – 2032
- Seeds
- Grains
- Plants
- Trees
- Fruits
- Others
- Current Market Size (US$ Mn) Analysis and Forecast, By End User, 2024 – 2032
- Agricultural Laboratories
- Academic and Research Institutes
- Food Processing Laboratories
- Contract Research Organization
- Others
- Market Attractiveness Analysis
- Latin America Plant Disease Diagnostics Market Outlook
- Key Highlights
- Historical Market Size (US$ Mn) Analysis, By Market, 2019 – 2023
- By Country
- By Product
- By Test
- By Sample
- By End User
- Current Market Size (US$ Mn) Analysis and Forecast, By Country, 2024 – 2032
- Brazil
- Mexico
- Rest of Latin America
- Current Market Size (US$ Mn) Analysis and Forecast, By Product, 2024 – 2032
- Kits
- Elisa Kits
- DNA Based Diagnostics Kits
- Protein Based Diagnostics Kits
- Lateral Flow Devices
- DNA/RNA Probes
- Accessories and Other Consumables
- Software and Cloud Databases
- Kits
- Current Market Size (US$ Mn) Analysis and Forecast, By Test, 2024 – 2032
- Molecular Tests
- PCR- Based Assays
- PCR & RT-PCR
- Multiplex PCR
- Isothermal Amplification Assays
- Microarray Assay
- NASBA
- The LAMP Assay
- PCR- Based Assays
- Serological Tests
- ELSIA
- TBIA
- QCMI
- Tests Using Electronic Technology
- Molecular Tests
- Current Market Size (US$ Mn) Analysis and Forecast, By Sample, 2024 – 2032
- Seeds
- Grains
- Plants
- Trees
- Fruits
- Others
- Current Market Size (US$ Mn) Analysis and Forecast, By End User, 2024 – 2032
- Agricultural Laboratories
- Academic and Research Institutes
- Food Processing Laboratories
- Contract Research Organization
- Others
- Market Attractiveness Analysis
- Middle East & Africa Plant Disease Diagnostics Market Outlook
- Key Highlights
- Historical Market Size (US$ Mn) Analysis, By Market, 2019 – 2023
- By Country
- By Product
- By Test
- By Sample
- By End User
- Current Market Size (US$ Mn) Analysis and Forecast, By Country, 2024 – 2032
- GCC Countries
- Egypt
- South Africa
- Northern Africa
- Rest of Middle East & Africa
- Current Market Size (US$ Mn) Analysis and Forecast, By Product, 2024 – 2032
- Kits
- Elisa Kits
- DNA Based Diagnostics Kits
- Protein Based Diagnostics Kits
- Lateral Flow Devices
- DNA/RNA Probes
- Accessories and Other Consumables
- Software and Cloud Databases
- Kits
- Current Market Size (US$ Mn) Analysis and Forecast, By Test, 2024 – 2032
- Molecular Tests
- PCR- Based Assays
- PCR & RT-PCR
- Multiplex PCR
- Isothermal Amplification Assays
- Microarray Assay
- NASBA
- The LAMP Assay
- PCR- Based Assays
- Serological Tests
- ELSIA
- TBIA
- QCMI
- Tests Using Electronic Technology
- Molecular Tests
- Current Market Size (US$ Mn) Analysis and Forecast, By Sample, 2024 – 2032
- Seeds
- Grains
- Plants
- Trees
- Fruits
- Others
- Current Market Size (US$ Mn) Analysis and Forecast, By End User, 2024 – 2032
- Agricultural Laboratories
- Academic and Research Institutes
- Food Processing Laboratories
- Contract Research Organization
- Others
- Market Attractiveness Analysis
- Competition Landscape
- Market Share Analysis, 2024
- Market Structure
- Competition Intensity Mapping By Market
- Competition Dashboard
- Company Profiles (Details – Overview, Financials, Strategy, Recent Developments)
- Agdia, Inc.
- Overview
- Segments and Products
- Key Financials
- Market Developments
- Market Strategy
- Creative Diagnostics
- Life Technologies
- Norgen Biotek Corp.
- Promega Corporation
- NIPPON GENE CO.,LTD.
- Pocket Diagnostic
- Eurofins Scientific
- OptiGene
- Abingdon Health
- LOEWE Biochemica GmbH
- BIOREBA AG
- PanonIT
- Agrisera AB
- Biosense Laboratories AS
- TwistDx™ Limited
- Lifeasible
- Agritest
- Oxford Nanopore Technologies plc
- Agdia, Inc.
- Appendix
- Research Methodology
- Research Assumptions
- Acronyms and Abbreviations

Loading page data
Please wait a moment


