

- Executive Summary
- Global Piling Equipment and Supplies Market Snapshot 2026 and 2033
- Market Opportunity Assessment, 2026 - 2033, US$ Bn
- Key Market Trends
- Industry Developments and Key Market Events
- Demand Side and Supply Side Analysis
- PMR Analysis and Recommendations
- Market Overview
- Market Scope and Definitions
- Market Dynamics
- Driver
- Restraint
- Opportunities
- Trends
- Macro-Economic Factors
- Global GDP Outlook
- Global Prison Growth Outlook
- Global Crime Rates by Country
- Global Prison Population by Country
- Global Private Prison Market Growth Outlook
- Other Macro-economic Factors
- Forecast Factors - Relevance and Impact
- COVID-19 Impact Assessment
- Value Added Insights
- Value Chain analysis
- Key Market Players
- Product Adoption Analysis
- Key Promotional Strategies by key players
- PESTLE Analysis
- Porter's Five Forces Analysis
- Regulatory and Technology Landscape
- Price Trend Analysis, 2025
- Region-wise Price Analysis
- Price by Segments
- Price Impact Factors
- Global Piling Equipment and Supplies Market Outlook: Historical (2020 - 2025) and Forecast (2026 - 2033)
- Key Highlights
- Global Piling Equipment and Supplies Market Outlook: Equipment Type
- Introduction/Key Findings
- Historical Market Size (US$ Bn) and Volume (Units) Analysis by Equipment Type, 2020-2025
- Current Market Size (US$ Bn) and Volume (Units) Forecast, by Equipment Type, 2026-2033
- Pile Driving Equipment
- Impact Hammers
- Vibratory Drivers
- Hydraulic Hammers
- Drilling Rigs
- Rotary Drilling Rigs
- Continuous Flight Auger (CFA) Rigs
- Piling Rigs
- Others
- Pile Driving Equipment
- Market Attractiveness Analysis: Equipment Type
- Global Piling Equipment and Supplies Market Outlook: Application
- Introduction/Key Findings
- Historical Market Size (US$ Bn) and Volume (Units) Analysis by Application, 2020-2025
- Current Market Size (US$ Bn) and Volume (Units) Forecast, by Application, 2026-2033
- Residential Construction
- Commercial Construction
- Industrial Construction
- Others
- Market Attractiveness Analysis: Application
- Global Piling Equipment and Supplies Market Outlook: Region
- Key Highlights
- Historical Market Size (US$ Bn) and Volume (Units) Analysis by Region, 2020-2025
- Current Market Size (US$ Bn) and Volume (Units) Forecast, by Region, 2026-2033
- North America
- Europe
- East Asia
- South Asia & Oceania
- Latin America
- Middle East & Africa
- Market Attractiveness Analysis: Region
- North America Piling Equipment and Supplies Market Outlook: Historical (2020 - 2025) and Forecast (2026 - 2033)
- Key Highlights
- Pricing Analysis
- North America Market Size (US$ Bn) and Volume (Units) Forecast, by Country, 2026-2033
- U.S.
- Canada
- North America Market Size (US$ Bn) and Volume (Units) Forecast, by Equipment Type, 2026-2033
- Pile Driving Equipment
- Impact Hammers
- Vibratory Drivers
- Hydraulic Hammers
- Drilling Rigs
- Rotary Drilling Rigs
- Continuous Flight Auger (CFA) Rigs
- Piling Rigs
- Others
- Pile Driving Equipment
- North America Market Size (US$ Bn) and Volume (Units) Forecast, by Application, 2026-2033
- Residential Construction
- Commercial Construction
- Industrial Construction
- Others
- Europe Piling Equipment and Supplies Market Outlook: Historical (2020 - 2025) and Forecast (2026 - 2033)
- Key Highlights
- Pricing Analysis
- Europe Market Size (US$ Bn) and Volume (Units) Forecast, by Country, 2026-2033
- Germany
- Italy
- France
- U.K.
- Spain
- Russia
- Rest of Europe
- Europe Market Size (US$ Bn) and Volume (Units) Forecast, by Equipment Type, 2026-2033
- Pile Driving Equipment
- Impact Hammers
- Vibratory Drivers
- Hydraulic Hammers
- Drilling Rigs
- Rotary Drilling Rigs
- Continuous Flight Auger (CFA) Rigs
- Piling Rigs
- Others
- Pile Driving Equipment
- Europe Market Size (US$ Bn) and Volume (Units) Forecast, by Application, 2026-2033
- Residential Construction
- Commercial Construction
- Industrial Construction
- Others
- East Asia Piling Equipment and Supplies Market Outlook: Historical (2020 - 2025) and Forecast (2026 - 2033)
- Key Highlights
- Pricing Analysis
- East Asia Market Size (US$ Bn) and Volume (Units) Forecast, by Country, 2026-2033
- China
- Japan
- South Korea
- East Asia Market Size (US$ Bn) and Volume (Units) Forecast, by Equipment Type, 2026-2033
- Pile Driving Equipment
- Impact Hammers
- Vibratory Drivers
- Hydraulic Hammers
- Drilling Rigs
- Rotary Drilling Rigs
- Continuous Flight Auger (CFA) Rigs
- Piling Rigs
- Others
- Pile Driving Equipment
- East Asia Market Size (US$ Bn) and Volume (Units) Forecast, by Application, 2026-2033
- Residential Construction
- Commercial Construction
- Industrial Construction
- Others
- East Asia Market Size (US$ Bn) and Volume (Units) Forecast, by , 2026-2033
- South Asia & Oceania Piling Equipment and Supplies Market Outlook: Historical (2020 - 2025) and Forecast (2026 - 2033)
- Key Highlights
- Pricing Analysis
- South Asia & Oceania Market Size (US$ Bn) and Volume (Units) Forecast, by Country, 2026-2033
- India
- Southeast Asia
- ANZ
- Rest of SAO
- South Asia & Oceania Market Size (US$ Bn) and Volume (Units) Forecast, by Equipment Type, 2026-2033
- Pile Driving Equipment
- Impact Hammers
- Vibratory Drivers
- Hydraulic Hammers
- Drilling Rigs
- Rotary Drilling Rigs
- Continuous Flight Auger (CFA) Rigs
- Piling Rigs
- Others
- Pile Driving Equipment
- South Asia & Oceania Market Size (US$ Bn) and Volume (Units) Forecast, by Application, 2026-2033
- Residential Construction
- Commercial Construction
- Industrial Construction
- Others
- Latin America Piling Equipment and Supplies Market Outlook: Historical (2020 - 2025) and Forecast (2026 - 2033)
- Key Highlights
- Pricing Analysis
- Latin America Market Size (US$ Bn) and Volume (Units) Forecast, by Country, 2026-2033
- Brazil
- Mexico
- Rest of LATAM
- Latin America Market Size (US$ Bn) and Volume (Units) Forecast, by Equipment Type, 2026-2033
- Pile Driving Equipment
- Impact Hammers
- Vibratory Drivers
- Hydraulic Hammers
- Drilling Rigs
- Rotary Drilling Rigs
- Continuous Flight Auger (CFA) Rigs
- Piling Rigs
- Others
- Pile Driving Equipment
- Latin America Market Size (US$ Bn) and Volume (Units) Forecast, by Application, 2026-2033
- Residential Construction
- Commercial Construction
- Industrial Construction
- Others
- Middle East & Africa Piling Equipment and Supplies Market Outlook: Historical (2020 - 2025) and Forecast (2026 - 2033)
- Key Highlights
- Pricing Analysis
- Middle East & Africa Market Size (US$ Bn) and Volume (Units) Forecast, by Country, 2026-2033
- GCC Countries
- South Africa
- Northern Africa
- Rest of MEA
- Middle East & Africa Market Size (US$ Bn) and Volume (Units) Forecast, by Equipment Type, 2026-2033
- Pile Driving Equipment
- Impact Hammers
- Vibratory Drivers
- Hydraulic Hammers
- Drilling Rigs
- Rotary Drilling Rigs
- Continuous Flight Auger (CFA) Rigs
- Piling Rigs
- Others
- Pile Driving Equipment
- Middle East & Africa Market Size (US$ Bn) and Volume (Units) Forecast, by Application, 2026-2033
- Residential Construction
- Commercial Construction
- Industrial Construction
- Others
- Competition Landscape
- Market Share Analysis, 2025
- Market Structure
- Competition Intensity Mapping
- Competition Dashboard
- Company Profiles
- Bauer Maschinen GmbH
- Company Overview
- Product Portfolio/Offerings
- Key Financials
- SWOT Analysis
- Company Strategy and Key Developments
- Liebherr Group
- Soilmec S.p.A.
- Casagrande S.p.A.
- Junttan Oy
- XCMG Group
- SANY Group Co., Ltd.
- ABI Gruppe GmbH (ABI Equipment)
- MAIT S.p.A.
- BSP International Foundations (BSP‑TEX)
- Dieseko Group (ICE)
- International Construction Equipment, Inc. (ICE)
- Kobelco Construction Machinery Co., Ltd.
- Hitachi Construction Machinery Co., Ltd.
- Sunward Intelligent Equipment Co., Ltd.
- Bauer Maschinen GmbH
- Appendix
- Research Methodology
- Research Assumptions
- Acronyms and Abbreviations


- Off-Road Equipment & Machinery
- Piling Equipment and Supplies Market
Piling Equipment and Supplies Market Size, Share, and Growth Forecast 2026 - 2033
Piling Equipment and Supplies Market by Equipment Type (Pile Driving Equipment, Drilling Rigs, Piling Rigs, Others), Application (Residential Construction, Commercial Construction, Industrial Construction, Others), Regional Analysis, 2026 - 2033
Piling Equipment and Supplies Market Size and Trend Analysis
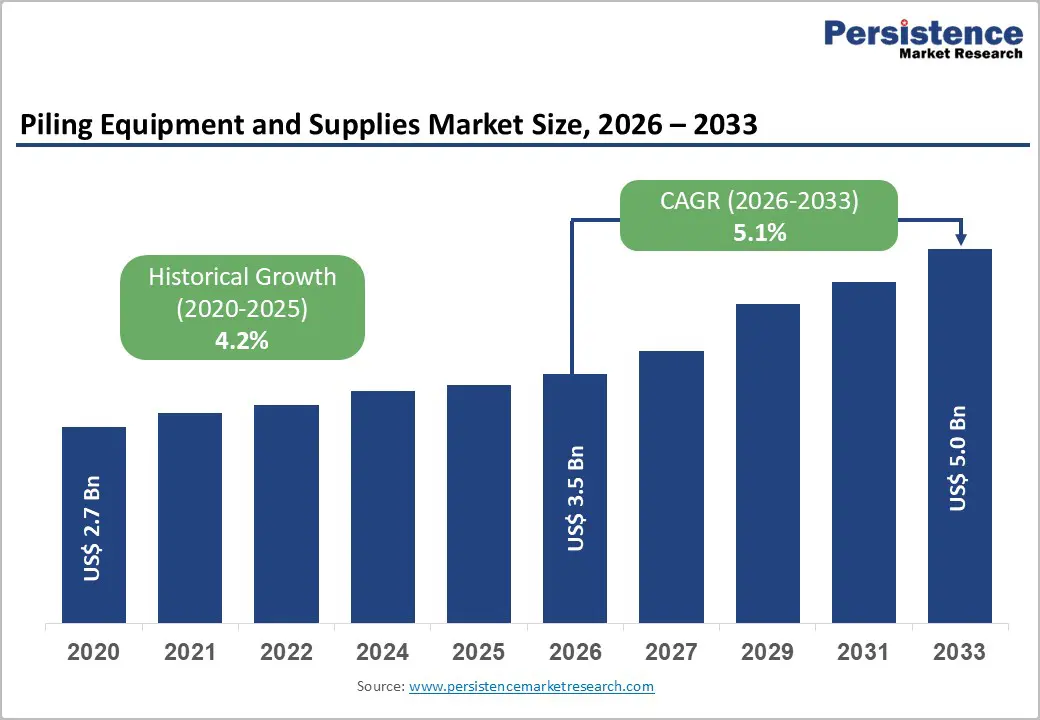
The global piling equipment and supplies market size is expected to be valued at US$ 3.5 billion in 2026 and projected to reach US$ 5.0 billion by 2033, growing at a CAGR of 5.1% between 2026 and 2033.
This growth is primarily driven by rapid urbanization and large-scale infrastructure development worldwide. Increasing investments in transportation networks, high-rise residential and commercial buildings, and renewable energy projects are accelerating demand for advanced foundation solutions. Governments are allocating significant budgets toward infrastructure expansion; for example, substantial highway funding in the U.S. has strengthened demand for durable piling systems. Moreover, the shift toward sustainable construction practices is encouraging the adoption of technologically advanced piling equipment capable of supporting complex soil and load conditions.
Key Industry Highlights:
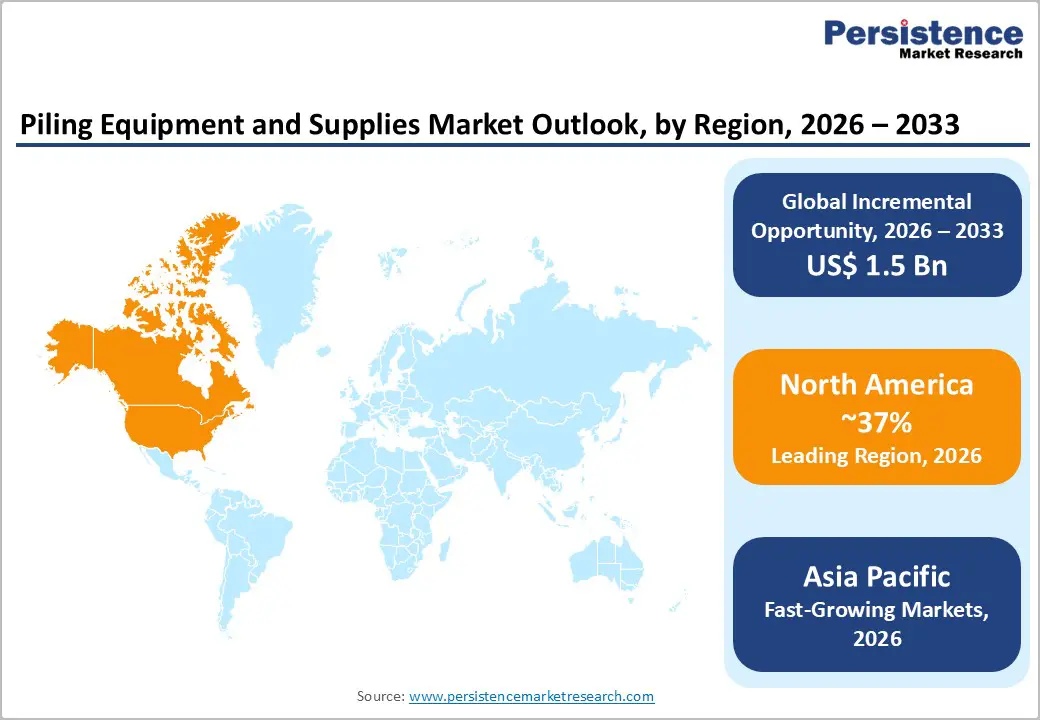
- Leading Region: North America leads the global market with a 37.4% share in 2025, driven by significant infrastructure renewal and widespread adoption of advanced piling equipment.
- Fastest-Growing Region: Asia Pacific is the fastest-growing region, with a 34.8% share in 2025, driven by urbanization, China’s Belt and Road Initiative, and India’s Smart Cities Mission.
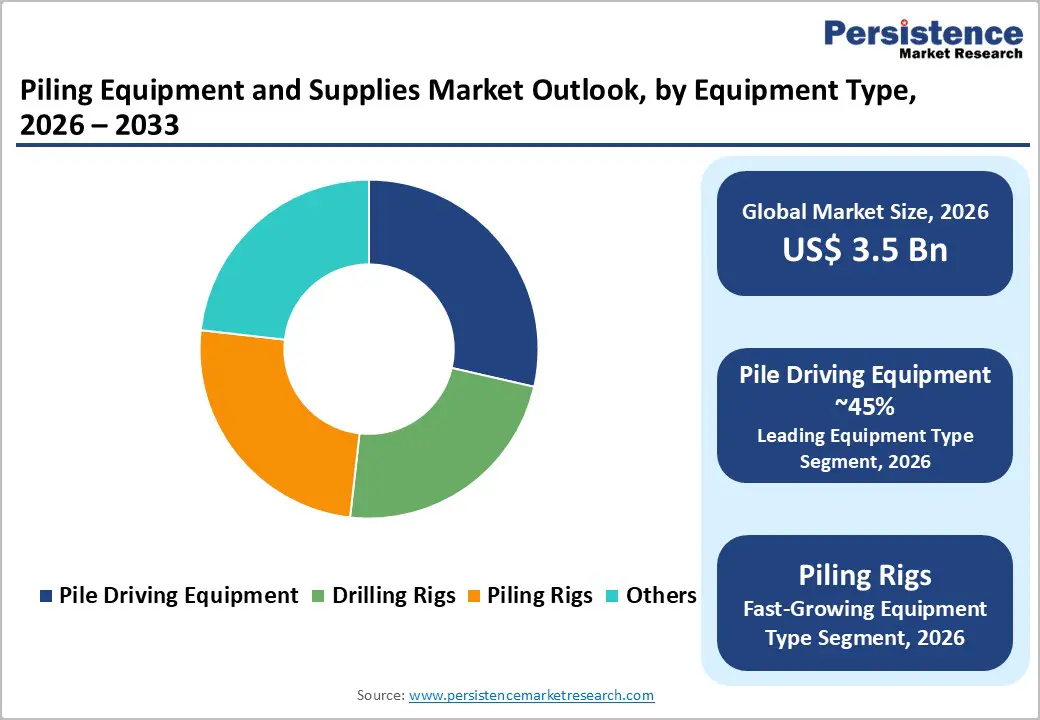
- Leading Equipment Type: Pile Driving Equipment dominates with 45% market share in 2025, ideal for high-load foundations in bridges, skyscrapers, and major infrastructure projects.
- Leading Application: Commercial Construction leads the market with a 38% market share in 2025, driven by rapid growth in office complexes, retail centers, and multi-story urban developments.
- Key Opportunity: Hybrid and electric piling technologies represent significant opportunities, supporting renewable energy foundations and aligning with global net-zero and sustainability goals.
| Key Insights | Details |
|---|---|
| Piling Equipment and Supplies Market Size (2026E) | US$ 3.5 billion |
| Market Value Forecast (2033F) | US$ 5.0 billion |
| Projected Growth CAGR (2026 - 2033) | 5.1% |
| Historical Market Growth (2020 - 2025) | 4.2% |
Market Dynamics
Drivers - Surging Infrastructure Investments Across Transportation and Urban Development
Global infrastructure investment has accelerated significantly, creating strong demand for piling equipment and supplies. Large-scale projects, such as highways, bridges, ports, metro rail systems, and smart cities, require deep foundation solutions to support heavy structural loads and ensure a long service life. In Asia, the need for sustainable infrastructure is immense, particularly for urban transport and coastal development projects. In seismically active regions such as Japan and parts of Southeast Asia, advanced piling systems play a critical role in ensuring structural stability and safety. Reliable deep foundations help reduce long-term maintenance costs, enhance resilience against natural hazards, and support economic growth by improving regional and cross-border connectivity.
Advancements in Construction Mechanization and Piling Technologies
Continuous advancements in construction mechanization are significantly boosting the piling equipment and supplies market. Modern hydraulic, vibratory, and automated piling systems have improved installation efficiency, precision, and adaptability across a range of soil conditions. These technologies enable faster pile driving and drilling, reducing project timelines and minimizing on-site disruptions.
The increasing adoption of automated and digitally controlled piling rigs also addresses global labor shortages in the construction sector. By lowering dependency on manual labor and enhancing operational safety, contractors can achieve cost savings and improved productivity, making advanced piling technologies an attractive investment for large-scale construction projects.
Restraints - High Initial Capital Costs and Limited Affordability for Contractors
Piling equipment requires substantial upfront capital investment, with advanced machinery such as hydraulic hammers and rotary piling rigs costing several hundred thousand dollars per unit. This high entry cost poses a major challenge for small and medium-sized contractors, particularly in emerging economies where access to financing and leasing options remains limited.
As a result, many contractors continue to rely on outdated or manual piling methods, which slows technology adoption and reduces overall productivity. The high cost of ownership, combined with maintenance and transportation expenses, limits market penetration and delays modernizing foundation construction practices in cost-sensitive regions.
Stringent Environmental Regulations and Operational Compliance Costs
Environmental regulations governing noise, vibration, and emissions have become increasingly stringent, especially in Europe and other densely populated regions. Compliance with these regulations often requires expensive equipment modifications, adoption of low-noise technologies, or complete equipment replacement, raising overall operational costs. In urban construction zones, strict regulatory approvals can delay project timelines and limit the deployment of conventional piling equipment. These constraints increase compliance-related expenditures for contractors and manufacturers alike, restraining market growth amid rising environmental and sustainability expectations.
Opportunity - Expansion in Renewable Energy Foundations and Offshore Wind Projects
Rapid growth in the global renewable energy sector is creating significant opportunities for the piling equipment and supplies market. Offshore wind energy, in particular, requires robust deep foundation systems to support turbines in challenging marine environments. Monopile and jacket foundations dominate offshore installations due to their structural reliability and cost efficiency in deep and variable seabed conditions.
Rising offshore wind capacity targets worldwide are driving demand for specialized offshore piling rigs, vibratory drivers, and heavy-duty foundation equipment. Government incentives and long-term clean energy policies are encouraging investments in renewable infrastructure, enabling equipment manufacturers to secure sustained demand and long-term revenue opportunities in this expanding segment.
Adoption of Hybrid and Electric Piling Technologies for Sustainable Construction
The global shift toward low-emission construction practices presents strong growth opportunities for hybrid and electric piling technologies. Governments and developers are increasingly prioritizing eco-friendly equipment to meet net-zero targets and green building certification requirements. Hybrid piling rigs significantly reduce fuel consumption and emissions while maintaining high operational efficiency.
Growth in Asian markets is supported by government policies that promote electric construction machinery, which is emerging as a key adopter of these technologies. Manufacturers investing in hybrid and electric piling solutions can benefit from regulatory incentives, improved tender competitiveness, and rising demand for sustainable construction equipment across urban infrastructure projects.
Category-wise Analysis
Equipment Type Insights
Pile driving equipment emerged as the leading category, accounting for around 45% of the market share in 2025, supported by its wide applicability in high-load and large-scale construction projects. Impact hammers and vibratory drivers are extensively used in bridge construction, high-rise buildings, and major infrastructure developments due to their reliability and ability to perform efficiently in dense and variable soil conditions.
Looking ahead, advanced vibratory and low-noise piling systems are expected to grow the fastest. Rising urban density, stricter noise regulations, and the need for faster installation methods are driving contractors to adopt technologically advanced pile-driving solutions that deliver precision, reduced environmental impact, and improved operational efficiency.
Application Insights
Commercial construction dominated the market, accounting for an estimated 38% share in 2025, driven by the rapid expansion of office complexes, retail centers, hotels, and mixed-use developments. Urbanization and increasing investments in commercial real estate have intensified the need for strong, deep foundation systems capable of supporting multi-story structures under strict safety and time constraints.
The renewable energy and infrastructure application segment is expected to grow the fastest. Rising investments in offshore wind farms, transportation corridors, and smart city projects are accelerating demand for specialized piling solutions, particularly for projects requiring durable foundations in complex environmental and geotechnical conditions.
Regional Insights
North America Piling Equipment and Supplies Market Trends
North America leads the global market, with 37.4% share in 2025, driven by massive infrastructure renewal initiatives. Programs like the Bipartisan Infrastructure Law, allocating $550 billion for roads, bridges, and transit by 2026, are fueling demand for advanced piling equipment. AI-integrated drilling rigs and hydraulic pile drivers enhance precision and efficiency, particularly in seismic and high-risk zones.
The region’s regulatory environment, guided by OSHA standards, emphasizes safety and low-noise operations. This encourages contractors to adopt quieter, technologically advanced piling systems, ensuring compliance and long-term reliability. The mature North American market is characterized by high operational efficiency, ongoing modernization, and steady demand from commercial, residential, and public infrastructure projects.
Europe Piling Equipment and Supplies Market Trends
Europe’s market growth is steady, with a projected CAGR of ~5.3% during the forecast period, driven by sustainable infrastructure investments under the European Green Deal. Germany leads with precision-engineered piling solutions, while the U.K. and France focus on retrofitting aging structures in line with EU Directive 89/106/EEC. Spain’s high-speed rail expansion stimulates the adoption of vibratory drivers.
Technological adoption across the region emphasizes low-noise, low-vibration, and environmentally compliant piling systems. Contractors increasingly prioritize retrofitting and sustainability-driven projects, driving the adoption of advanced hydraulic and automated rigs that meet emissions standards and improve construction efficiency across urban and transport infrastructure developments.
Asia Pacific Piling Equipment and Supplies Market Trends
Asia Pacific accounts for 34.8% of the market in 2025, driven by large-scale urbanization and infrastructure development. China’s Belt and Road Initiative supports megaprojects, including over 10,000 km of high-speed rail annually, while India’s Smart Cities Mission accelerates urban vertical growth and foundation requirements. Japan and ASEAN nations serve as manufacturing and export hubs for cost-effective piling equipment.
The fastest growth in the region is driven by emerging markets such as Thailand, Vietnam, and Indonesia, where rapid industrialization and government-led infrastructure projects are increasing demand. Large-scale transport networks, residential high-rises, and industrial facilities are adopting modern piling technologies, creating strong opportunities for equipment manufacturers and suppliers in diverse geographies.
Competitive Landscape
The Piling Equipment and Supplies market remains moderately consolidated, with top players holding 60% share through strategic mergers and R&D in automation. Leaders differentiate via IoT-enabled rigs for real-time monitoring, while expansion targets Asia via joint ventures. Emerging models emphasize rental-as-a-service, reducing capex for contractors and spurring adoption in fragmented SME segments.
Key Developments:
- In June 2025, Liebherr Group launched a new electric piling rig series, reducing emissions by 50% and targeting European urban construction projects, promoting sustainable foundation solutions while enhancing operational efficiency and compliance with stricter environmental standards.
- In March 2024, Soilmec S.p.A. acquired a strategic stake in an Asian distribution partner to expand its vibratory hammer sales, tapping into growing infrastructure projects across the region and strengthening its market presence in high-demand Asian construction markets.
- In November 2023, Junttan Oy introduced AI-optimized impact hammers, achieving a 25% improvement in pile penetration rates during field trials, enhancing precision, efficiency, and productivity for large-scale infrastructure and urban construction projects worldwide.
Companies Covered in Piling Equipment and Supplies Market
- Bauer Maschinen GmbH
- Liebherr Group
- Soilmec S.p.A.
- Casagrande S.p.A.
- Junttan Oy
- XCMG Group
- SANY Group Co., Ltd.
- ABI Gruppe GmbH (ABI Equipment)
- MAIT S.p.A.
- BSP International Foundations (BSP‑TEX)
- Dieseko Group (ICE)
- International Construction Equipment, Inc. (ICE)
- Kobelco Construction Machinery Co., Ltd.
- Hitachi Construction Machinery Co., Ltd.
- Sunward Intelligent Equipment Co., Ltd.
Frequently Asked Questions
The global piling equipment and supplies market is expected to reach US$ 3.5 billion in 2026, driven by urbanization and infrastructure development.
Surging infrastructure investments, including $26 trillion needed in Asia by 2030, are boosting demand for advanced piling equipment.
North America leads with 37.4% share in 2025, while Asia Pacific holds 34.8% share, driven by megaprojects in China, India, and Southeast Asia.
Hybrid and electric piling technologies support renewable energy foundations, including 1,500 GW of offshore wind capacity targeted by 2030.
Leading companies include Liebherr Group, Soilmec S.p.A., Junttan Oy, and Bauer AG, focusing on innovation.


