

- Executive Summary
- Global Pessary Market Snapshot, 2026 and 2033
- Market Opportunity Assessment, 2026 - 2033, US$ Mn
- Key Market Trends
- Future Market Projections
- Premium Market Insights
- Industry Developments and Key Market Events
- PMR Analysis and Recommendations
- Market Overview
- Market Scope and Definition
- Market Dynamics
- Drivers
- Restraints
- Opportunity
- Key Trends
- Macro-Economic Factors
- Global Sectorial Outlook
- Global GDP Growth Outlook
- COVID-19 Impact Analysis
- Forecast Factors - Relevance and Impact
- Value Added Insights
- Product Adoption Analysis
- Recent Product Launches
- Regulatory Landscape
- Value Chain Analysis
- Key Deals and Mergers
- PESTLE Analysis
- Porter’s Five Force Analysis
- Price Trend Analysis, 2020 - 2033
- Key Highlights
- Key Factors Impacting Product Prices
- Pricing Analysis, By Product Type
- Regional Prices and Product Preferences
- Global Pessary Market Outlook:
- Key Highlights
- Market Size (US$ Mn) and Y-o-Y Growth
- Absolute $ Opportunity
- Market Size (US$ Mn) Analysis and Forecast
- Historical Market Size (US$ Mn) Analysis, 2020-2025
- Market Size (US$ Mn) Analysis and Forecast, 2026-2033
- Global Pessary Market Outlook: Product
- Introduction / Key Findings
- Historical Market Size (US$ Mn) Analysis and Volume (Units) Analysis, By Product, 2020 - 2025
- Market Size (US$ Mn) Analysis and Volume (Units) Analysis and Forecast, By Product, 2026 - 2033
- Ring Pessaries
- Lever Pessaries
- Incontinence Rings
- Marland
- Others
- Market Attractiveness Analysis: By Product
- Global Pessary Market Outlook: Indication
- Introduction / Key Findings
- Historical Market Size (US$ Mn) Analysis, By Indication, 2020 - 2025
- Market Size (US$ Mn) Analysis and Forecast, By Indication, 2026 - 2033
- Pelvic Organ Prolapse
- Urinary Incontinences
- Market Attractiveness Analysis: Indication
- Global Pessary Market Outlook: End User
- Introduction / Key Findings
- Historical Market Size (US$ Mn) Analysis, By End User, 2020 - 2025
- Market Size (US$ Mn) Analysis and Forecast, By End User, 2026 - 2033
- Hospitals
- Specialty Clinics
- Ambulatory Surgery Centers
- Market Attractiveness Analysis: End User
- Key Highlights
- Global Pessary Market Outlook: Region
- Key Highlights
- Historical Market Size (US$ Mn) Analysis, By Region, 2020 - 2025
- Market Size (US$ Mn) Analysis and Forecast, By Region, 2026 - 2033
- North America
- Europe
- East Asia
- South Asia and Oceania
- Latin America
- Middle East & Africa
- Market Attractiveness Analysis: Region
- North America Pessary Market Outlook:
- Key Highlights
- Historical Market Size (US$ Mn) Analysis, By Market, 2020 - 2025
- By Country
- By Product
- By Indication
- By End User
- Market Size (US$ Mn) Analysis and Forecast, By Country, 2026 - 2033
- U.S.
- Canada
- Market Size (US$ Mn) Analysis and Volume (Units) Analysis and Forecast, By Product, 2026 - 2033
- Ring Pessaries
- Lever Pessaries
- Incontinence Rings
- Marland
- Others
- Market Size (US$ Mn) Analysis and Forecast, By Indication, 2026 - 2033
- Pelvic Organ Prolapse
- Urinary Incontinences
- Market Size (US$ Mn) Analysis and Forecast, By End User, 2026 - 2033
- Hospitals
- Specialty Clinics
- Ambulatory Surgery Centers
- Market Attractiveness Analysis
- Europe Pessary Market Outlook:
- Key Highlights
- Historical Market Size (US$ Mn) Analysis, By Market, 2020 - 2025
- By Country
- By Product
- By Indication
- By End User
- Market Size (US$ Mn) Analysis and Forecast, By Country, 2026 - 2033
- Germany
- France
- U.K.
- Italy
- Spain
- Russia
- Rest of Europe
- Market Size (US$ Mn) Analysis and Volume (Units) Analysis and Forecast, By Product, 2026 - 2033
- Ring Pessaries
- Lever Pessaries
- Incontinence Rings
- Marland
- Others
- Market Size (US$ Mn) Analysis and Forecast, By Indication, 2026 - 2033
- Pelvic Organ Prolapse
- Urinary Incontinences
- Market Size (US$ Mn) Analysis and Forecast, By End User, 2026 - 2033
- Hospitals
- Specialty Clinics
- Ambulatory Surgery Centers
- Market Attractiveness Analysis
- East Asia Pessary Market Outlook:
- Key Highlights
- Historical Market Size (US$ Mn) Analysis, By Market, 2020 - 2025
- By Country
- By Product
- By Indication
- By End User
- Market Size (US$ Mn) Analysis and Forecast, By Country, 2026 - 2033
- China
- Japan
- South Korea
- Market Size (US$ Mn) Analysis and Volume (Units) Analysis and Forecast, By Product, 2026 - 2033
- Ring Pessaries
- Lever Pessaries
- Incontinence Rings
- Marland
- Others
- Market Size (US$ Mn) Analysis and Forecast, By Indication, 2026 - 2033
- Pelvic Organ Prolapse
- Urinary Incontinences
- Market Size (US$ Mn) Analysis and Forecast, By End User, 2026 - 2033
- Hospitals
- Specialty Clinics
- Ambulatory Surgery Centers
- Market Attractiveness Analysis
- South Asia & Oceania Pessary Market Outlook:
- Key Highlights
- Historical Market Size (US$ Mn) Analysis, By Market, 2020 - 2025
- By Country
- By Product
- By Indication
- By End User
- Market Size (US$ Mn) Analysis and Forecast, By Country, 2026 - 2033
- India
- Southeast Asia
- ANZ
- Rest of South Asia & Oceania
- Market Size (US$ Mn) Analysis and Volume (Units) Analysis and Forecast, By Product, 2026 - 2033
- Ring Pessaries
- Lever Pessaries
- Incontinence Rings
- Marland
- Others
- Market Size (US$ Mn) Analysis and Forecast, By Indication, 2026 - 2033
- Pelvic Organ Prolapse
- Urinary Incontinences
- Market Size (US$ Mn) Analysis and Forecast, By End User, 2026 - 2033
- Hospitals
- Specialty Clinics
- Ambulatory Surgery Centers
- Market Attractiveness Analysis
- Latin America Pessary Market Outlook:
- Key Highlights
- Historical Market Size (US$ Mn) Analysis, By Market, 2020 - 2025
- By Country
- By Product
- By Indication
- By End User
- Market Size (US$ Mn) Analysis and Forecast, By Country, 2026 - 2033
- Brazil
- Mexico
- Rest of Latin America
- Market Size (US$ Mn) Analysis and Volume (Units) Analysis and Forecast, By Product, 2026 - 2033
- Ring Pessaries
- Lever Pessaries
- Incontinence Rings
- Marland
- Others
- Market Size (US$ Mn) Analysis and Forecast, By Indication, 2026 - 2033
- Pelvic Organ Prolapse
- Urinary Incontinences
- Market Size (US$ Mn) Analysis and Forecast, By End User, 2026 - 2033
- Hospitals
- Specialty Clinics
- Ambulatory Surgery Centers
- Market Attractiveness Analysis
- Middle East & Africa Pessary Market Outlook:
- Key Highlights
- Historical Market Size (US$ Mn) Analysis, By Market, 2020 - 2025
- By Country
- By Product
- By Indication
- By End User
- Market Size (US$ Mn) Analysis and Forecast, By Country, 2026 - 2033
- GCC Countries
- Egypt
- South Africa
- Northern Africa
- Rest of Middle East & Africa
- Market Size (US$ Mn) Analysis and Volume (Units) Analysis and Forecast, By Product, 2026 - 2033
- Ring Pessaries
- Lever Pessaries
- Incontinence Rings
- Marland
- Others
- Market Size (US$ Mn) Analysis and Forecast, By Indication, 2026 - 2033
- Pelvic Organ Prolapse
- Urinary Incontinences
- Market Size (US$ Mn) Analysis and Forecast, By End User, 2026 - 2033
- Hospitals
- Specialty Clinics
- Ambulatory Surgery Centers
- Market Attractiveness Analysis
- Competition Landscape
- Market Structure
- Competition Intensity Mapping By Market
- Competition Dashboard
- Company Profiles (Details - Overview, Recent Developments)
- CooperSurgical Inc
- Overview
- Segments and Product & End User
- Key Financials
- Market Developments
- Market Strategy
- Bliss GVS Pharma
- MedGyn
- Panpac Medical Corporation
- Bioteque America
- Personal Medical Corporation
- Dr.Arabin GmbH & Co.
- Kangge Medical
- Integra Lifesciences
- Wallach Surgical Devices
- Medesign
- Coloplast
- Cosm Medical
- Others
- Market Structure
- Appendix
- Research Methodology
- Research Assumptions
- Acronyms and Abbreviations


- Medical Devices
- Pessary Market
Pessary Market Size, Trends, Share, Growth, and Regional Forecast, 2026 to 2033
Pessary Market by Product (Ring Pessaries, Lever Pessaries, Incontinence Rings, Marland, and Others), by Indication (Pelvic Organ Prolapse, and Urinary Incontinences), by End User (Hospitals, Specialty Clinics, and Ambulatory Surgery Centers), and Regional Analysis from 2026 to 2033
Key Industry Highlights
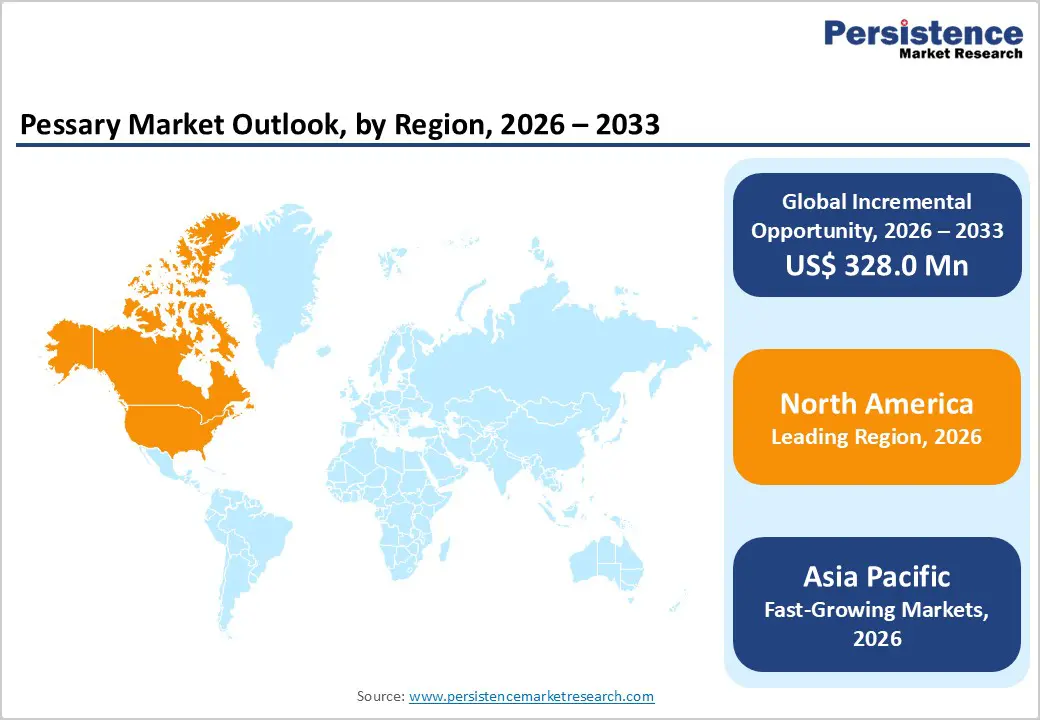
- Leading Region: North America holds the largest share at 47.3%, supported by advanced gynecological care infrastructure, high diagnosis rates of pelvic floor disorders, strong awareness of non-surgical treatment options, and the presence of established pessary manufacturers.
- Fastest-Growing Region: Asia Pacific is expanding fastest due to a large female patient base, increasing awareness of pelvic health, improving access to gynecological services, and rising investments in women’s healthcare infrastructure.
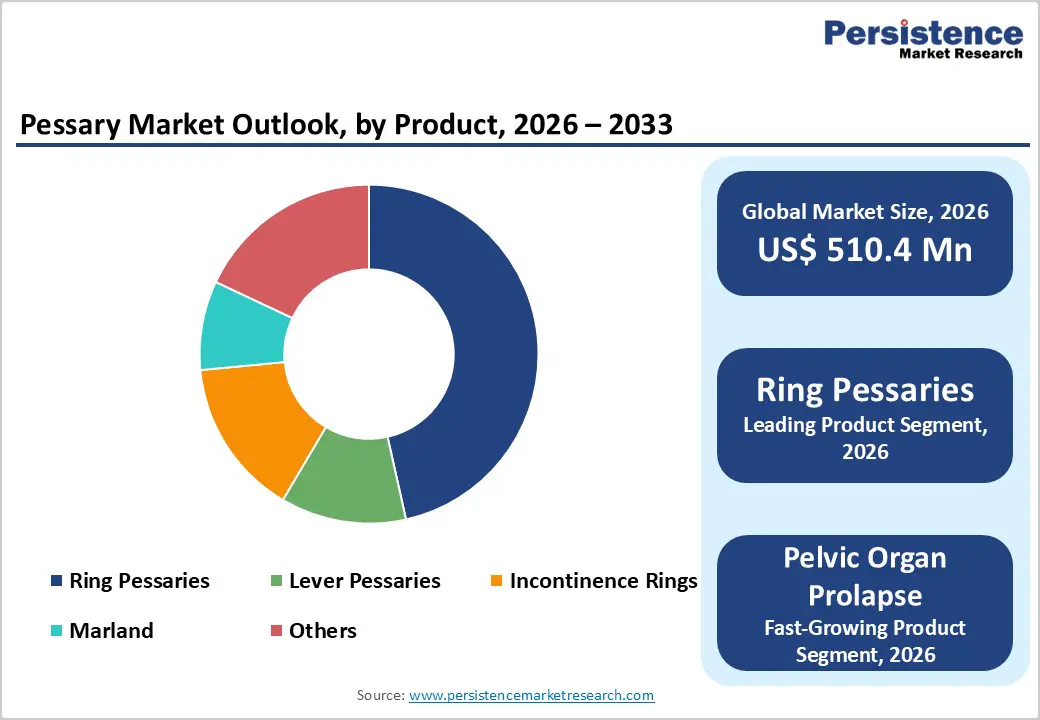
- Leading Product Segment: Ring pessaries dominate the market due to their ease of insertion, high patient comfort, wide availability, and suitability for long-term management of pelvic organ prolapse and mild urinary incontinence.
- Fastest-Growing Product Segment: Incontinence rings are expanding rapidly as demand increases for cost-effective, conservative solutions for stress urinary incontinence and early-stage pelvic floor dysfunction.
- Leading Technology Segment: Pelvic organ prolapse remains the top segment, driven by its high prevalence, strong clinical acceptance of pessary-based management, and preference for non-surgical treatment among elderly and high-risk patients.
- Fastest-Growing Technology Segment: Urinary incontinence is scaling quickly as awareness improves, early diagnosis increases, and patients increasingly opt for minimally invasive, lifestyle-preserving treatment options.
| Key Insights | Details |
|---|---|
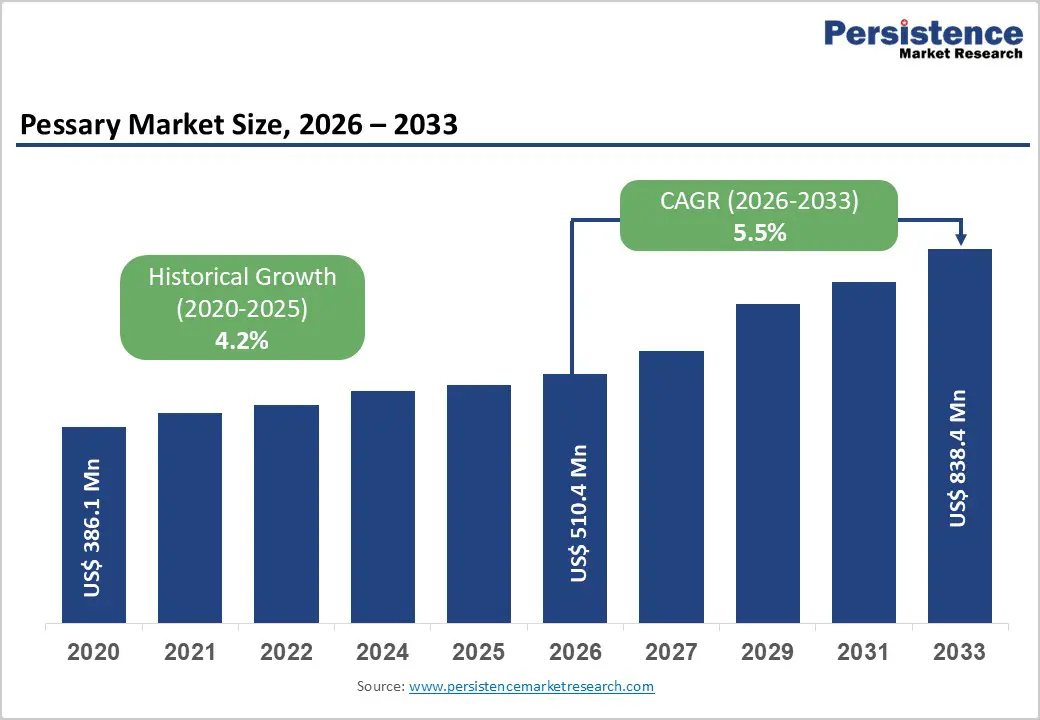
| Pessary Market Size (2026E) | US$ 510.4 Mn |
| Market Value Forecast (2033F) | US$ 838.4 Mn |
| Projected Growth (CAGR 2026 to 2033) | 5.5% |
| Historical Market Growth (CAGR 2020 to 2025) | 4.2% |
Market Dynamics
Driver - Rising Prevalence of Pelvic Floor Disorders and Advancements in Pessary Design
The increasing global prevalence of pelvic floor disorders, particularly pelvic organ prolapse (POP) and urinary incontinence, is a major driver of sustained growth in the pessary market. Aging female populations, rising parity rates in developing regions, obesity, chronic constipation, and postmenopausal hormonal changes are significantly expanding the at-risk patient pool. Pelvic organ prolapse alone affects a substantial proportion of women over the age of 50, many of whom seek conservative, non-surgical treatment options due to comorbidities or a preference to avoid surgery. Pessaries are widely recommended as first-line management, especially for elderly patients, women planning future pregnancies, and those unfit for surgical intervention.
The advancements in pessary design and materials are strengthening clinical adoption. Modern pessaries are increasingly manufactured using medical-grade silicone, offering improved flexibility, biocompatibility, durability, and patient comfort for long-term use. Enhanced anatomical designs improve retention and reduce complications such as vaginal irritation or expulsion. Growing physician familiarity, improved fitting protocols, and expanding gynecological training are further supporting uptake. Together, rising disease burden and product innovation are reinforcing pessaries as a cornerstone therapy in pelvic floor disorder management.
Restraints - Patient Compliance Challenges and Limited Awareness in Emerging Regions
Patient compliance and awareness challenges remain key restraints for the global pessary market. Long-term use of pessaries requires regular follow-up, periodic removal, cleaning, and refitting, which can be inconvenient for some patients and healthcare providers. Inadequate patient education regarding proper usage and maintenance may lead to discomfort, vaginal discharge, infections, or discontinuation, negatively impacting long-term adherence. Cultural sensitivities and stigma associated with vaginal devices in certain regions also discourage adoption, particularly among younger patients and those in conservative societies.
Limited awareness among primary care providers and patients in emerging markets further restricts market penetration. In many low- and middle-income countries, pelvic floor disorders remain underdiagnosed, and treatment pathways are often focused on surgical correction or symptom management rather than conservative interventions. Access to trained gynecologists and urogynecologists capable of pessary fitting is uneven, especially in rural and semi-urban settings. Additionally, inconsistent reimbursement policies and a lack of standardized clinical guidelines in some healthcare systems reduce the routine prescription of pessaries. These factors collectively constrain broader adoption despite the cost-effectiveness and clinical benefits of pessary therapy.
Opportunity - Growing Focus on Conservative Care, Preventive Women’s Health, and Outpatient Management
The increasing emphasis on conservative, preventive, and patient-centric women’s healthcare presents a significant growth opportunity for the pessary market. Healthcare systems worldwide are prioritizing non-surgical treatment options to reduce procedural risks, healthcare costs, and hospital burden, particularly for chronic conditions such as pelvic organ prolapse and urinary incontinence. Pessaries align well with this shift, offering a low-cost, minimally invasive, and reversible treatment option suitable for long-term management. Expanding outpatient gynecology services and community-based women’s health clinics are further supporting wider access to pessary fitting and follow-up care.
Additionally, rising awareness of pelvic health through public health initiatives, digital education platforms, and advocacy programs is improving early diagnosis and patient acceptance. Manufacturers are also exploring opportunities in product customization, disposable or self-manageable pessaries, and improved sizing systems to enhance ease of use and patient independence. Integration of pessary management into holistic pelvic floor therapy programs, including physiotherapy and lifestyle interventions, is strengthening clinical outcomes. Together, preventive care trends, outpatient expansion, and product innovation are expected to unlock sustained growth opportunities in the global pessary market.
Category-wise Analysis
By Product, Ring Pessaries Lead Due to Versatility and High Patient Acceptance
The ring pessaries segment is projected to dominate the global pessary market in 2026, accounting for a revenue share of 46.5%. This dominance is primarily attributed to their broad clinical applicability across mild to moderate pelvic organ prolapse and stress urinary incontinence cases. Ring pessaries are widely preferred due to their ease of insertion and removal, high patient comfort, and suitability for long-term use without frequent complications. Their flexible design allows better anatomical conformity, reducing irritation and improving retention rates, particularly among elderly patients. Clinicians also favor ring pessaries because they are easy to fit during routine outpatient visits and require minimal follow-up intervention. Increasing awareness of conservative management options, coupled with growing preference for non-surgical treatment among women with comorbidities, is further supporting demand. Continuous improvements in medical-grade silicone materials, durability, and ergonomic design are enhancing patient compliance, reinforcing the sustained leadership of the ring pessaries segment globally.
By Indication, Pelvic Organ Prolapse Remains the Primary Clinical Application
The pelvic organ prolapse segment is projected to dominate the global pessary market in 2026, accounting for a revenue share of 62.0%. This leadership is driven by the high prevalence of pelvic organ prolapse, particularly among postmenopausal women and those with multiple childbirth histories. Pessaries are widely recommended as a first-line treatment for pelvic organ prolapse, especially for patients seeking to delay or avoid surgical intervention. Strong clinical acceptance, well-established treatment protocols, and growing physician confidence in long-term pessary management support widespread adoption. Additionally, pelvic organ prolapse often requires prolonged management, resulting in repeat usage and replacement demand, which strengthens revenue contribution. Expanding access to gynecological care, increased screening, and improved patient education regarding conservative treatment options are further supporting segment growth. As awareness increases and diagnosis rates improve globally, pelvic organ prolapse is expected to remain the leading indication within the pessary market.
By End User, Hospitals Maintain Market Leadership Owing to High Patient Volumes
The hospitals segment is projected to dominate the global pessary market in 2026, accounting for a revenue share of 52.0%. This dominance is driven by the high volume of gynecological consultations, diagnostic evaluations, and pelvic floor disorder treatments conducted in hospital settings. Hospitals typically serve as primary referral centers for moderate to severe pelvic organ prolapse cases, requiring specialized evaluation and pessary fitting by trained gynecologists or urogynecologists. Availability of comprehensive diagnostic infrastructure, multidisciplinary care teams, and follow-up services further supports hospital-based pessary adoption. In addition, hospitals often manage elderly and high-risk patient populations who prefer conservative treatment approaches over surgical procedures. Centralized procurement systems, standardized treatment protocols, and integration of pessary management into broader women’s health services also contribute to higher usage volumes. These factors collectively reinforce hospitals as the leading end-user segment in the global pessary market.
Regional Insights
North America Pessary Market Trends
North America is expected to dominate the global pessary market with a value share of 47.3% in 2026, led primarily by the United States. The region benefits from a highly developed women’s healthcare infrastructure, high awareness of pelvic floor disorders, and strong adoption of conservative treatment options. Routine gynecological screening, early diagnosis of pelvic organ prolapse and urinary incontinence, and favorable reimbursement for non-surgical interventions support widespread pessary usage. Hospitals and specialty clinics in North America are well equipped with trained gynecologists and urogynecologists, ensuring accurate fitting and long-term management.
Market growth is further supported by high patient awareness, strong physician training programs, and continuous product innovation by leading manufacturers. Availability of advanced medical-grade silicone pessaries, improved sizing systems, and patient-centric designs enhances compliance and treatment outcomes. Additionally, the region’s emphasis on outpatient care, preventive women’s health, and quality-of-life improvement continues to reinforce North America’s leadership position in the global pessary market.
Europe Pessary Market Trends
The Europe pessary market is expected to grow steadily, supported by an aging female population and increasing prevalence of pelvic floor disorders across key countries such as Germany, the U.K., France, Italy, and the Nordic region. Strong public healthcare systems and broad access to gynecological services facilitate early diagnosis and conservative management of pelvic organ prolapse and urinary incontinence. Clinical guidelines in several European countries emphasize non-surgical treatment approaches, positioning pessaries as a preferred first-line option.
Growth is further supported by increasing patient awareness, routine postpartum follow-up, and expanding urogynecology services. Hospitals and specialty clinics play a key role in pessary fitting and follow-up care, ensuring sustained demand. Additionally, favorable regulatory frameworks, standardized product quality requirements, and collaboration between healthcare providers and medical device manufacturers contribute to consistent market expansion. As healthcare systems continue to prioritize cost-effective, minimally invasive solutions, pessary adoption across Europe is expected to remain stable and gradually increase.
Asia Pacific Pessary Market Trends
The Asia Pacific pessary market is expected to register a relatively higher CAGR of around 7.5% between 2026 and 2033, driven by expanding healthcare infrastructure and a large, underserved female population. Rising awareness of pelvic health, increasing prevalence of pelvic organ prolapse, and improving access to gynecological care are key growth drivers across countries such as China, India, Japan, and South Korea. Rapid expansion of private hospitals, specialty women’s health clinics, and urban healthcare facilities is improving diagnosis and treatment rates.
Government-led healthcare modernization initiatives, increasing healthcare expenditure, and growing focus on women’s health are further supporting adoption. Local manufacturing, cost-effective product availability, and strategic expansion by global pessary manufacturers are improving affordability in price-sensitive markets. As cultural barriers gradually decline and patient education improves, demand for conservative, non-surgical pelvic floor treatments is expected to rise, strengthening long-term growth prospects across the Asia Pacific region.
Market Competitive Landscape
The global pessary market is highly competitive, with strong participation from companies such as CooperSurgical Inc, Bliss GVS Pharma, MedGyn, Panpac Medical Corporation, and Bioteque America. These players leverage established global distribution networks, strong brand recognition, and broad gynecology-focused product portfolios to address the evolving clinical needs associated with pelvic organ prolapse and urinary incontinence management.
Their offerings emphasize improvements in medical-grade materials, anatomical design, patient comfort, ease of insertion, and long-term durability, enabling widespread adoption across hospitals, specialty clinics, and outpatient gynecological settings. Continuous product refinement and adherence to regulatory and quality standards remain central to maintaining competitive advantage in this market.
Key Industry Developments:
- In May 2025, Mediplus, a leading medical device innovator, announced the expansion of its POPY™ pelvic organ prolapse pessary product portfolio with the launch of five additional sizes. This product enhancement is aimed at improving anatomical fit and broadening treatment options for women affected by pelvic organ prolapse.
- In September 2024, ConTIPI Medical announced a partnership with EVERSANA to support the U.S. commercial launch of the ProVate device, a vaginal ring pessary designed for patients with pelvic organ prolapse (POP), as reported in an EVERSANA news release.
Companies Covered in Pessary Market
- CooperSurgical Inc
- Bliss GVS Pharma
- MedGyn
- Panpac Medical Corporation
- Bioteque America
- Personal Medical Corporation
- Dr.Arabin GmbH & Co.
- Kangge Medical
- Integra Lifesciences
- Wallach Surgical Devices
- Medesign
- Coloplast
- Cosm Medical
- Others
Frequently Asked Questions
The global pessary market is projected to be valued at US$ 510.4 Mn in 2026.
Rising prevalence of pelvic floor disorders and growing preference for non-surgical, conservative management.
The global pessary market is poised to witness a CAGR of 5.5% between 2026 and 2033.
Expansion of outpatient women’s health services and increasing adoption of anatomically optimized, patient-friendly pessaries.
CooperSurgical Inc, Bliss GVS Pharma, MedGyn, Panpac Medical Corporation, and Bioteque America are some of the key players in the pessary market.


