

- Executive Summary
- Global Peripheral Stent Implants Market Snapshot 2026 and 2033
- Market Opportunity Assessment, 2026-2033, US$ Bn
- Key Market Trends
- Industry Developments and Key Market Events
- Demand Side and Supply Side Analysis
- PMR Analysis and Recommendations
- Market Overview
- Market Scope and Definitions
- Market Dynamics
- Driver
- Restraint
- Opportunities
- Trends
- Macro-Economic Factors
- Global GDP Outlook
- Global Healthcare Expenditure
- Forecast Factors – Relevance and Impact
- COVID-19 Impact Assessment
- Value Added Insights
- Value Chain analysis
- Key Market Players
- Product Adoption Analysis
- Key Promotional Strategies by key players
- PESTLE Analysis
- Porter's Five Forces Analysis
- Regulatory and Technology Landscape
- Global Peripheral Stent Implants Market Outlook: Historical (2020 – 2025) and Forecast (2026 – 2033)
- Key Highlights
- Global Peripheral Stent Implants Market Outlook: Product Type
- Introduction/Key Findings
- Historical Market Size (US$ Bn) Analysis by Product Type, 2020-2025
- Current Market Size (US$ Bn) Forecast, by Product Type, 2026-2033
- Bare Metal Stents
- Drug-Eluting Stents
- Covered Stents
- Market Attractiveness Analysis: Product Type
- Global Peripheral Stent Implants Market Outlook: Artery Type
- Introduction/Key Findings
- Historical Market Size (US$ Bn) Analysis by Artery Type, 2020-2025
- Current Market Size (US$ Bn) Forecast, by Artery Type, 2026-2033
- Carotid Artery
- Femoral-Popliteal Artery
- Iliac Artery
- Infrapopliteal (Below-the-knee) Artery
- Others
- Market Attractiveness Analysis: Artery Type
- Global Peripheral Stent Implants Market Outlook: End User
- Introduction/Key Findings
- Historical Market Size (US$ Bn) Analysis by End User, 2020-2025
- Current Market Size (US$ Bn) Forecast, by End User, 2026-2033
- Hospitals
- Ambulatory Surgical Centers
- Specialty Clinics
- Market Attractiveness Analysis: End User
- Global Peripheral Stent Implants Market Outlook: Region
- Key Highlights
- Historical Market Size (US$ Bn) Analysis by Region, 2020-2025
- Current Market Size (US$ Bn) Forecast, by Region, 2026-2033
- North America
- Europe
- East Asia
- South Asia & Oceania
- Latin America
- Middle East & Africa
- Market Attractiveness Analysis: Region
- North America Peripheral Stent Implants Market Outlook: Historical (2020 – 2025) and Forecast (2026 – 2033)
- Key Highlights
- North America Market Size (US$ Bn) Forecast, by Country, 2026-2033
- U.S.
- Canada
- North America Market Size (US$ Bn) Forecast, by Product Type, 2026-2033
- Bare Metal Stents
- Drug-Eluting Stents
- Covered Stents
- North America Market Size (US$ Bn) Forecast, by Artery Type, 2026-2033
- Carotid Artery
- Femoral-Popliteal Artery
- Iliac Artery
- Infrapopliteal (Below-the-knee) Artery
- Others
- North America Market Size (US$ Bn) Forecast, by End User, 2026-2033
- Hospitals
- Ambulatory Surgical Centers
- Specialty Clinics
- Europe Peripheral Stent Implants Market Outlook: Historical (2020 – 2025) and Forecast (2026 – 2033)
- Key Highlights
- Europe Market Size (US$ Bn) Forecast, by Country, 2026-2033
- Germany
- Italy
- France
- U.K.
- Spain
- Russia
- Rest of Europe
- Europe Market Size (US$ Bn) Forecast, by Product Type, 2026-2033
- Bare Metal Stents
- Drug-Eluting Stents
- Covered Stents
- Europe Market Size (US$ Bn) Forecast, by Artery Type, 2026-2033
- Carotid Artery
- Femoral-Popliteal Artery
- Iliac Artery
- Infrapopliteal (Below-the-knee) Artery
- Others
- Europe Market Size (US$ Bn) Forecast, by End User, 2026-2033
- Hospitals
- Ambulatory Surgical Centers
- Specialty Clinics
- East Asia Peripheral Stent Implants Market Outlook: Historical (2020 – 2025) and Forecast (2026 – 2033)
- Key Highlights
- East Asia Market Size (US$ Bn) Forecast, by Country, 2026-2033
- China
- Japan
- South Korea
- East Asia Market Size (US$ Bn) Forecast, by Product Type, 2026-2033
- Bare Metal Stents
- Drug-Eluting Stents
- Covered Stents
- East Asia Market Size (US$ Bn) Forecast, by Artery Type, 2026-2033
- Carotid Artery
- Femoral-Popliteal Artery
- Iliac Artery
- Infrapopliteal (Below-the-knee) Artery
- Others
- East Asia Market Size (US$ Bn) Forecast, by End User, 2026-2033
- Hospitals
- Ambulatory Surgical Centers
- Specialty Clinics
- South Asia & Oceania Peripheral Stent Implants Market Outlook: Historical (2020 – 2025) and Forecast (2026 – 2033)
- Key Highlights
- South Asia & Oceania Market Size (US$ Bn) Forecast, by Country, 2026-2033
- India
- Southeast Asia
- ANZ
- Rest of SAO
- South Asia & Oceania Market Size (US$ Bn) Forecast, by Product Type, 2026-2033
- Bare Metal Stents
- Drug-Eluting Stents
- Covered Stents
- South Asia & Oceania Market Size (US$ Bn) Forecast, by Artery Type, 2026-2033
- Carotid Artery
- Femoral-Popliteal Artery
- Iliac Artery
- Infrapopliteal (Below-the-knee) Artery
- Others
- South Asia & Oceania Market Size (US$ Bn) Forecast, by End User, 2026-2033
- Hospitals
- Ambulatory Surgical Centers
- Specialty Clinics
- Latin America Peripheral Stent Implants Market Outlook: Historical (2020 – 2025) and Forecast (2026 – 2033)
- Key Highlights
- Latin America Market Size (US$ Bn) Forecast, by Country, 2026-2033
- Brazil
- Mexico
- Rest of LATAM
- Latin America Market Size (US$ Bn) Forecast, by Product Type, 2026-2033
- Bare Metal Stents
- Drug-Eluting Stents
- Covered Stents
- Latin America Market Size (US$ Bn) Forecast, by Artery Type, 2026-2033
- Carotid Artery
- Femoral-Popliteal Artery
- Iliac Artery
- Infrapopliteal (Below-the-knee) Artery
- Others
- Latin America Market Size (US$ Bn) Forecast, by End User, 2026-2033
- Hospitals
- Ambulatory Surgical Centers
- Specialty Clinics
- Middle East & Africa Peripheral Stent Implants Market Outlook: Historical (2020 – 2025) and Forecast (2026 – 2033)
- Key Highlights
- Middle East & Africa Market Size (US$ Bn) Forecast, by Country, 2026-2033
- GCC Countries
- South Africa
- Northern Africa
- Rest of MEA
- Middle East & Africa Market Size (US$ Bn) Forecast, by Product Type, 2026-2033
- Bare Metal Stents
- Drug-Eluting Stents
- Covered Stents
- Middle East & Africa Market Size (US$ Bn) Forecast, by Artery Type, 2026-2033
- Carotid Artery
- Femoral-Popliteal Artery
- Iliac Artery
- Infrapopliteal (Below-the-knee) Artery
- Others
- Middle East & Africa Market Size (US$ Bn) Forecast, by End User, 2026-2033
- Hospitals
- Ambulatory Surgical Centers
- Specialty Clinics
- Competition Landscape
- Market Share Analysis, 2025
- Market Structure
- Competition Intensity Mapping
- Competition Dashboard
- Company Profiles
- Medtronic plc
- Company Overview
- Product Portfolio/Offerings
- Key Financials
- SWOT Analysis
- Company Strategy and Key Developments
- Boston Scientific Corporation
- Abbott Laboratories
- Biotronik SE & Co. KG
- Cook Medical, Inc.
- Terumo Corporation
- B. Braun Melsungen AG
- Cordis Corporation
- W. L. Gore & Associates, Inc.
- iVascular SLU
- MicroPort Scientific Corporation
- Cardinal Health, Inc.
- Medtronic plc
- Appendix
- Research Methodology
- Research Assumptions
- Acronyms and Abbreviations


- Medical Devices
- Peripheral Stent Implants Market
Peripheral Stent Implants Market Size, Share, and Growth Forecast 2026 - 2033
The global Peripheral Stent Implants Market by Product Type (Bare Metal Stents, Drug-Eluting Stents, Covered Stents), by Artery Type (Carotid Artery, Femoral-Popliteal Artery, Iliac Artery, Infrapopliteal (Below-the-knee) Artery, Others), by End User (Hospitals, Ambulatory Surgical Centers, Specialty Clinics), by Regional Analysis (North America, Europe, Asia Pacific, Latin America, Middle East & Africa), 2026-2033
Peripheral Stent Implants Market Size and Trends Analysis
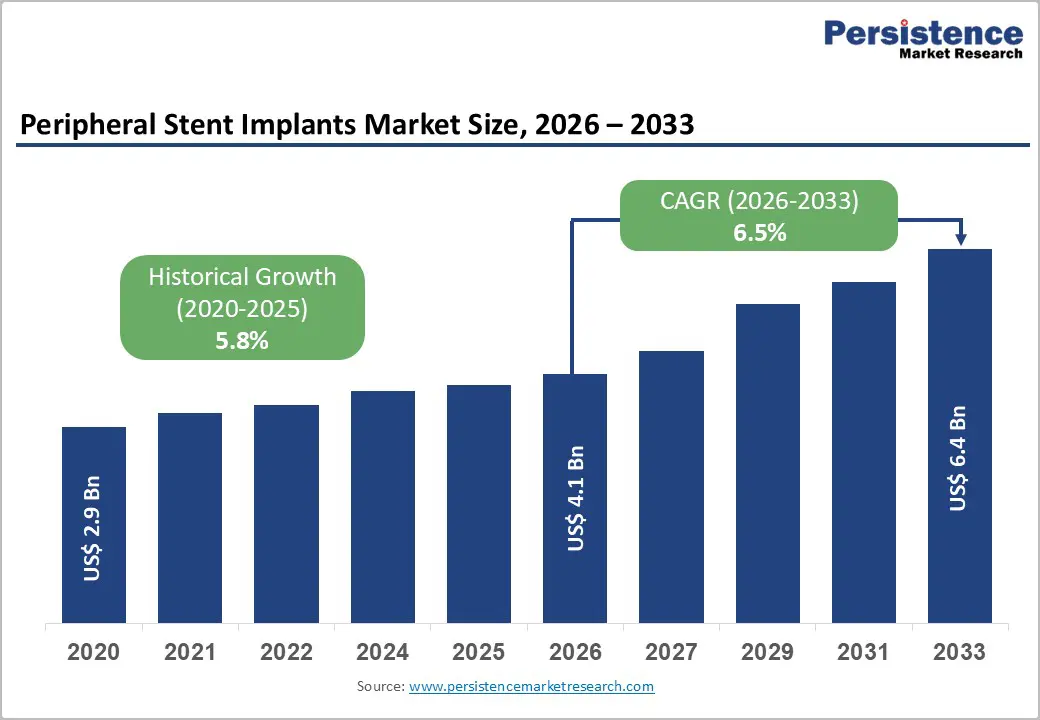
The global peripheral stent implants market is expected to be valued at US$ 4.1 billion in 2026 and projected to reach US$ 6.4 billion by 2033, growing at a CAGR of 6.5% between 2026 and 2033.
The market expansion is primarily driven by the escalating prevalence of peripheral artery disease PAD, which affects over 113 million individuals globally. According to the Global Burden of Disease Study, PAD cases are projected to increase by 220% by 2050, reaching 360 million people worldwide. Additionally, the aging global population, particularly individuals aged 65 years and above, combined with the rising incidence of metabolic diseases such as diabetes and hypertension, is catalyzing sustained demand for minimally invasive endovascular interventions, thereby supporting peripheral stent implant adoption across developed and emerging healthcare systems.
Key Market Highlights (Concise)
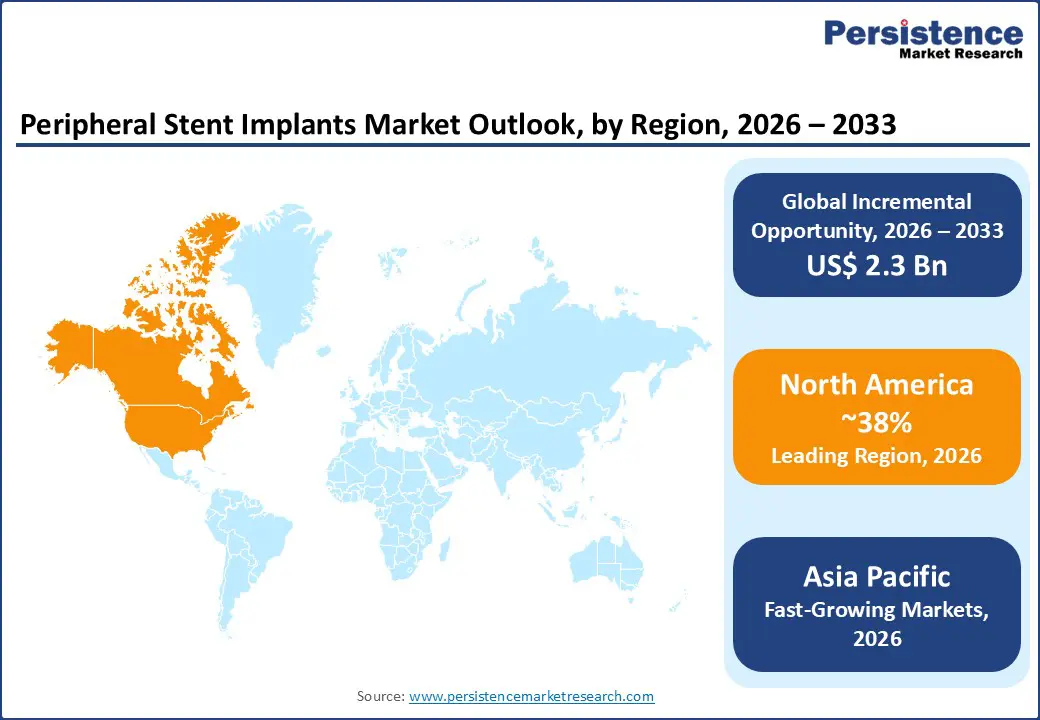
- North America leadership: North America holds ~38% of the peripheral stent implants market in 2025, supported by advanced healthcare systems, strong reimbursement, and high procedure volumes, and remains the largest revenue contributor through 2033.
- Asia Pacific fastest growth: Asia Pacific is the fastest-growing region, projected to register an 8–9% CAGR through 2033, driven by rising PAD prevalence, improving healthcare infrastructure, and increasing interventional procedures across China, India, and Southeast Asia.
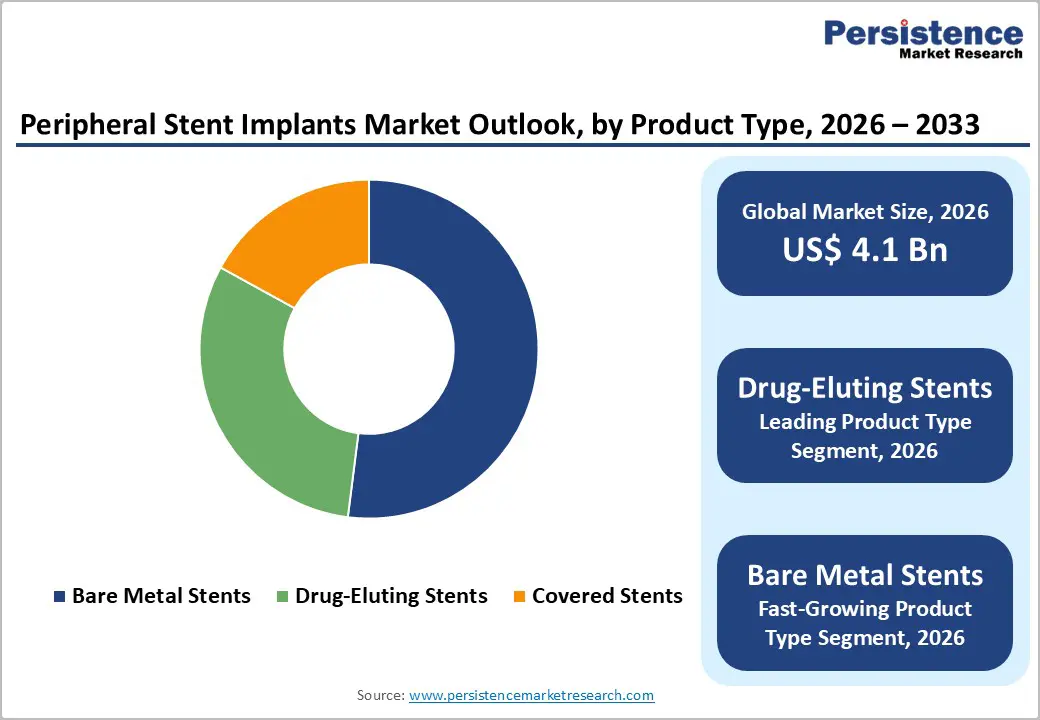
- Drug-eluting stent dominance: Drug-eluting stents account for ~52% market share in 2025 due to superior efficacy in reducing restenosis, supporting broad clinical adoption.
- Below-the-knee expansion: Infrapopliteal segments are growing fastest (9–10% CAGR), fueled by increasing CLTI treatment focus and new device innovations.
- Shift to outpatient care: Growing use of ambulatory surgical centers under value-based care models is accelerating demand for efficient peripheral stent platforms.
| Global Market Attributes | Key Insights |
|---|---|
| Market Size (2026E) | US$ 4.1 billion |
| Market Value Forecast (2033F) | US$ 6.4 billion |
| Projected Growth CAGR(2026-2033) | 6.5% |
| Historical Market Growth (2020-2025) | 5.8% |
Market Dynamics
Market Growth Drivers
Rising Burden of Peripheral Artery Disease and Aging Demographics
The global prevalence of peripheral artery disease continues to accelerate, driven by an aging population and increasing comorbidities. The World Health Organization (WHO) and Centers for Disease Control and Prevention (CDC) data indicate that approximately 10-15% of the population aged 70 years and older experiences symptomatic PAD, while asymptomatic disease prevalence reaches 20-30% in this demographic. The age-standardized prevalence of PAD is projected to surge from 1,441 per 100,000 in 2021 to 3,804 per 100,000 by 2050, representing a 164% increase. Furthermore, the rising prevalence of diabetes mellitus, affecting over 537 million adults globally, serves as a primary risk factor for PAD development. These epidemiological trends have created sustained clinical demand for effective endovascular interventions, positioning peripheral stent implants as critical therapeutic solutions for improving vascular patency and preventing limb-threatening complications.
Technological Advancements and Improved Clinical Efficacy
Recent innovations in stent technology, particularly the development of drug-eluting stents and bioabsorbable platforms, have substantially improved clinical outcomes and long-term vessel patency rates. Clinical evidence demonstrates that drug-eluting stents reduce target lesion revascularization rates by approximately 30-40% compared to bare metal stents, while newer-generation devices incorporate advanced polymer coatings and ultra-thin struts that enhance deliverability through complex arterial anatomy. In April 2024, Abbott Laboratories received FDA approval for the Esprit BTK Everolimus-Eluting Resorbable Scaffold System, representing a paradigm shift toward bioabsorbable solutions that eventually resorb after vessel healing. Additionally, the Reflow Medical Spur Peripheral Retrievable Stent System achieved FDA De Novo clearance in May 2025, demonstrating technical success rates of 99.2% in treating chronic limb-threatening ischemia. These technological breakthroughs are accelerating adoption rates among interventional cardiologists and vascular surgeons, thereby expanding market opportunities across diverse clinical settings.
Market Restraints
High Treatment Costs and Reimbursement Challenges
Despite clinical efficacy, elevated costs associated with peripheral stent implant procedures present significant adoption barriers, particularly in resource-constrained healthcare systems. Advanced drug-eluting stents and bioabsorbable platforms command premium pricing, ranging from $2,000 to $5,000 per device in developed markets, substantially elevating total procedural costs. Reimbursement policies vary considerably across geographies; while North American healthcare systems and most European nations provide robust coverage for approved interventions, emerging markets including India and Southeast Asia maintain restrictive reimbursement frameworks. The Indian government's price-capped device regulations limit manufacturer margins on peripheral stents, constraining investment in clinical research and market development. These economic barriers disproportionately affect lower-income populations in low- and middle-income countries, where approximately 50% of projected PAD cases are expected to occur by 2050, thereby limiting market penetration and widening treatment disparities.
Regulatory Complexities and Lengthy Approval Timelines
Stringent regulatory requirements, particularly under the European Medical Device Regulation (EU MDR) and evolving FDA premarket approval pathways, have substantially increased compliance costs and extended time-to-market for novel peripheral stent technologies. The EU MDR, which intensified requirements in 2024, mandates comprehensive clinical performance data, post-market surveillance protocols, and robust notified body assessments for Class III implantable devices. In China, the National Medical Products Administration (NMPA) requires extensive local clinical evidence prior to marketing authorization, extending approval timelines to 18-36 months. Similarly, the Indian Central Drugs Standard Control Organization (CDSCO) has implemented stricter device approval norms, increasing regulatory burden on manufacturers. These approval complexities have resulted in delayed product launches and higher research and development expenditures, particularly impacting smaller medical device manufacturers attempting to enter competitive markets with innovative technologies.
Market Opportunities
Rising Prevalence of Below-the-Knee and Infrapopliteal Artery Disease
The infrapopliteal and below-the-knee PAD segments represent the fastest-growing treatment opportunities within the peripheral stent market, driven by increasing clinical recognition of chronic limb-threatening ischemia CLTI and improved endovascular treatment capabilities. Below-the-knee peripheral artery disease affects approximately 2-3% of the population globally, with prevalence rising substantially in populations aged 70 years and above. Recent clinical trials, including the DEEPER REVEAL trial and ACHILLES trial, have demonstrated superior patency outcomes with drug-eluting stents in infrapopliteal segments, reporting primary patency rates of 80.6% and freedom from target lesion revascularization at 90% compared to 58.1% with balloon angioplasty alone. These clinical advances, combined with regulatory support through innovative approval pathways such as the FDA De Novo clearance granted to Reflow Medical in 2025, are accelerating the adoption of specialized below-the-knee stent systems. Additionally, the rising prevalence of diabetes-related peripheral neuropathy and critical limb ischemia is expanding the patient population eligible for these interventions, creating substantial market growth potential in previously underserved therapeutic areas.
Category-wise Insights
Product Type Analysis
Drug-Eluting Stents demonstrate dominant market positioning with an estimated 52% market share in 2025, reflecting superior clinical efficacy and sustained market preference among interventional practitioners. The market leadership of drug-eluting stents is substantiated by robust clinical evidence demonstrating reduced restenosis rates 30-40% lower than bare metal alternatives and improved long-term vessel patency across multiple arterial segments, including femoral-popliteal, iliac, and infrapopliteal territories. Additionally, second- and third-generation drug-eluting stents with advanced polymer coatings and ultra-thin struts have substantially enhanced deliverability through complex lesions while reducing inflammatory responses. Major manufacturers, including Medtronic plc, Boston Scientific Corporation, and Abbott Laboratories, continue investing in iterative design improvements and drug-coating innovations, reinforcing market consolidation around drug-eluting stent platforms.
End User Analysis
Hospitals maintain dominant position within the end-user segment, accounting for an estimated 60-65% of peripheral stent implant procedures, reflecting their established interventional capabilities, comprehensive clinical infrastructure, and procedural volume. Hospital-based catheterization laboratories across North America and Europe perform the majority of complex peripheral interventions, with over 1.2 million peripheral artery disease procedures conducted annually in Chinese hospitals alone, generating substantial stent consumption. However, ambulatory surgical centers represent the fastest-growing end-user category, projected to capture increasing market share through 2033 as value-based reimbursement models incentivize outpatient interventional delivery. The ASC segment benefits from streamlined workflows, efficient operating room utilization, and reduced infection rates, positioning ASC platforms as preferred settings for straightforward-to-moderate complexity peripheral stent procedures. Additionally, specialty clinics focused on interventional vascular medicine and limb-preserving therapies are expanding peripheral stent utilization, particularly in managing chronic limb-threatening ischemia and complex infrapopliteal disease.
Regional Insights
North America Peripheral Stent Implants Market Trends and Insights
North America commands the largest global market share, representing approximately 38% of peripheral stent implant revenues in 2025, driven by sophisticated healthcare infrastructure, comprehensive reimbursement coverage, and high procedural volumes. The United States market, representing the regional epicenter, benefits from robust funding of interventional cardiovascular programs, broad acceptance of minimally invasive endovascular techniques, and favorable reimbursement policies through Medicare and private insurance carriers. The U.S. peripheral artery disease prevalence affects approximately 8.5 million individuals, with endovascular procedures increasing at annual rates of 4-5%, substantially outpacing surgical revascularization decline. Additionally, North American manufacturers including Medtronic plc, Boston Scientific Corporation, and Abbott Laboratories maintain substantial regional market presence, supported by continuous product innovation cycles and established physician relationships.
Asia Pacific Peripheral Stent Implants Market Trends and Insights
Asia Pacific emerges as the fastest-growing regional market for peripheral stent implants, projected to expand at CAGR rates of 8-9% through 2033, driven by rapidly expanding healthcare infrastructure, rising disease prevalence, and increasing interventional procedure adoption. China dominates Asia Pacific regional growth, with peripheral artery disease affecting approximately 30-40 million individuals; the National Health Commission reported over 1.2 million peripheral interventions in 2022, with stent utilization increasing at annual rates of 8-10%. The Chinese peripheral stent market is projected to reach US$ 161.8 million by 2030, representing 8.5% CAGR growth, driven by healthcare reforms prioritizing endovascular therapies and expanding catheterization laboratory infrastructure in tier-one and tier-two cities.
Competitive Landscape
Market Structure Analysis
The competitive landscape of the Peripheral Stent Implants Market is shaped by intense rivalry among established and emerging medical device firms focusing on innovation, strategic partnerships, and product differentiation. Leading players invest heavily in R&D to develop advanced stent technologies, including drug-eluting and bioresorbable designs, with the goal of improving clinical outcomes and expanding their portfolios. Competition is also driven by mergers, acquisitions, and geographic expansion, as companies seek to gain market share and strengthen global presence.
Key Market Developments
- In October 2025, Medtronic announced the full U.S. rollout of the Neuroguard IEP system, a carotid stent combined with an embolic protection device, following a successful limited market release. The launch built on Medtronic’s exclusive U.S. distribution agreement with Contego Medical, the developer of the system, and marked an important expansion of its carotid intervention portfolio.
Companies Covered in Peripheral Stent Implants Market
- Medtronic plc
- Boston Scientific Corporation
- Abbott Laboratories
- Biotronik SE & Co. KG
- Cook Medical, Inc.
- Terumo Corporation
- B. Braun Melsungen AG
- Cordis Corporation
- W. L. Gore & Associates, Inc.
- iVascular SLU
- MicroPort Scientific Corporation
- Cardinal Health, Inc.
Frequently Asked Questions
The global peripheral stent implants market is projected to reach US$ 4.1 billion in 2026, representing continued expansion from the US$ 2.9 billion valuation in 2020.
The market is primarily driven by escalating peripheral artery disease prevalence, with an estimated 113 million affected individuals globally projected to increase by 220% by 2050. Secondary drivers include rising incidence of diabetes and hypertension, aging populations, particularly aged 65+ years, technological advancements in drug-eluting and bioabsorbable stent platforms, and expanding adoption of minimally invasive endovascular procedures.
North America maintains the dominant position with approximately 38% market share in 2025, supported by sophisticated healthcare infrastructure, comprehensive insurance reimbursement, high procedural volumes, and presence of leading stent manufacturers.
Primary opportunities include expanding the adoption of ambulatory surgical centers for peripheral stent procedures, with ASC-based vascular interventions projected to reach US$ 59 billion by 2028. Additionally, the rapidly growing below-the-knee peripheral artery disease segment presents substantial treatment opportunities driven by innovative device approvals, rising critical limb-threatening ischemia recognition, and advanced endovascular therapy capabilities.
Leading market participants include Medtronic plc, Boston Scientific Corporation, Abbott Laboratories, Biotronik SE & Co. KG, Cook Medical Inc., Terumo Corporation, B. Braun Melsungen AG, Cordis Corporation, W. L. Gore & Associates Inc., iVascular SLU, MicroPort Scientific Corporation, Cardinal Health Inc., and Becton Dickinson and Company.


