

- Executive Summary
- Global Pancreatic and Bile Duct Stone Management Market Snapshot 2026 and 2033
- Market Opportunity Assessment, 2026-2033, US$ Bn
- Key Market Trends
- Industry Developments and Key Market Events
- Demand Side and Supply-Side Analysis
- PMR Analysis and Recommendations
- Market Overview
- Market Scope and Definitions
- Market Dynamics
- Driver
- Restraint
- Opportunities
- Trends
- Macro-Economic Factors
- Global GDP Outlook
- Global Healthcare Expenditure
- Forecast Factors – Relevance and Impact
- COVID-19 Impact Assessment
- Value Added Insights
- Value Chain analysis
- Key Market Players
- Surgical Procedure Volume
- Key Promotional Strategies by key players
- PESTLE Analysis
- Porter's Five Forces Analysis
- Regulatory and Technology Landscape
- Global Pancreatic and Bile Duct Stone Management Market Outlook: Historical (2020 – 2025) and Forecast (2026 – 2033)
- Key Highlights
- Global Pancreatic and Bile Duct Stone Management Market Outlook: Product
- Introduction/Key Findings
- Historical Market Size (US$ Bn) Analysis by Management Type, 2020-2025
- Current Market Size (US$ Bn) Forecast, by Management Type, 2026-2033
- Endoscopic Management
- ERCP Catheters
- Guidewires
- Sphincterotomes
- Extraction Balloon Catheters
- Extraction Basket Catheters
- Dilation Balloon Catheters
- Large-Balloon Dilation Catheters
- Lithotripsy-Based Management
- Mechanical Lithotripsy
- Electrohydraulic Lithotripsy (EHL)
- Laser Lithotripsy
- Medical Management
- Surgical Management
- Endoscopic Management
- Market Attractiveness Analysis: Product
- Global Pancreatic and Bile Duct Stone Management Market Outlook: Indication
- Introduction/Key Findings
- Historical Market Size (US$ Bn) Analysis by Indication, 2020-2025
- Current Market Size (US$ Bn) Forecast, by Indication, 2026-2033
- Pancreatic Stones
- Bile Duct Stones
- Market Attractiveness Analysis: Indication
- Global Pancreatic and Bile Duct Stone Management Market Outlook: End User
- Introduction/Key Findings
- Historical Market Size (US$ Bn) Analysis by End User, 2020-2025
- Current Market Size (US$ Bn) Forecast, by End User, 2026-2033
- Hospitals
- Ambulatory Surgical Centers
- Speciality Clinics
- Market Attractiveness Analysis: End User
- Global Pancreatic and Bile Duct Stone Management Market Outlook: Region
- Key Highlights
- Historical Market Size (US$ Bn) Analysis by Region, 2020-2025
- Current Market Size (US$ Bn) Forecast by Region, 2026-2033
- North America
- Europe
- East Asia
- South Asia & Oceania
- Latin America
- Middle East & Africa
- Market Attractiveness Analysis: Region
- North America Pancreatic and Bile Duct Stone Management Market Outlook: Historical (2020 – 2025) and Forecast (2026 – 2033)
- Key Highlights
- North America Market Size (US$ Bn) Forecast, by Country, 2026-2033
- U.S.
- Canada
- North America Market Size (US$ Bn) Forecast, by Management Type, 2026-2033
- Endoscopic Management
- ERCP Catheters
- Guidewires
- Sphincterotomes
- Extraction Balloon Catheters
- Extraction Basket Catheters
- Dilation Balloon Catheters
- Large-Balloon Dilation Catheters
- Lithotripsy-Based Management
- Mechanical Lithotripsy
- Electrohydraulic Lithotripsy (EHL)
- Laser Lithotripsy
- Medical Management
- Surgical Management
- Endoscopic Management
- North America Market Size (US$ Bn) Forecast, by Indication, 2026-2033
- Pancreatic Stones
- Bile Duct Stones
- North America Market Size (US$ Bn) Forecast, by End User, 2026-2033
- Hospitals
- Ambulatory Surgical Centers
- Speciality Clinics
- Europe Pancreatic and Bile Duct Stone Management Market Outlook: Historical (2020 – 2025) and Forecast (2026 – 2033)
- Key Highlights
- Europe Market Size (US$ Bn) Forecast, by Country, 2026-2033
- Germany
- Italy
- France
- U.K.
- Spain
- Russia
- Rest of Europe
- Europe Market Size (US$ Bn) Forecast, by Management Type, 2026-2033
- Endoscopic Management
- ERCP Catheters
- Guidewires
- Sphincterotomes
- Extraction Balloon Catheters
- Extraction Basket Catheters
- Dilation Balloon Catheters
- Large-Balloon Dilation Catheters
- Lithotripsy-Based Management
- Mechanical Lithotripsy
- Electrohydraulic Lithotripsy (EHL)
- Laser Lithotripsy
- Medical Management
- Surgical Management
- Endoscopic Management
- Europe Market Size (US$ Bn) Forecast, by Indication, 2026-2033
- Pancreatic Stones
- Bile Duct Stones
- Europe Market Size (US$ Bn) Forecast, by End User, 2026-2033
- Hospitals
- Ambulatory Surgical Centers
- Speciality Clinics
- East Asia Pancreatic and Bile Duct Stone Management Market Outlook: Historical (2020 – 2025) and Forecast (2026 – 2033)
- Key Highlights
- East Asia Market Size (US$ Bn) Forecast, by Country, 2026-2033
- China
- Japan
- South Korea
- East Asia Market Size (US$ Bn) Forecast, by Management Type, 2026-2033
- Endoscopic Management
- ERCP Catheters
- Guidewires
- Sphincterotomes
- Extraction Balloon Catheters
- Extraction Basket Catheters
- Dilation Balloon Catheters
- Large-Balloon Dilation Catheters
- Lithotripsy-Based Management
- Mechanical Lithotripsy
- Electrohydraulic Lithotripsy (EHL)
- Laser Lithotripsy
- Medical Management
- Surgical Management
- Endoscopic Management
- East Asia Market Size (US$ Bn) Forecast, by Indication, 2026-2033
- Pancreatic Stones
- Bile Duct Stones
- East Asia Market Size (US$ Bn) Forecast, by End User, 2026-2033
- Hospitals
- Ambulatory Surgical Centers
- Speciality Clinics
- South Asia & Oceania Pancreatic and Bile Duct Stone Management Market Outlook: Historical (2020 – 2025) and Forecast (2026 – 2033)
- Key Highlights
- South Asia & Oceania Market Size (US$ Bn) Forecast, by Country, 2026-2033
- India
- Southeast Asia
- ANZ
- Rest of SAO
- South Asia & Oceania Market Size (US$ Bn) Forecast, by Management Type, 2026-2033
- Endoscopic Management
- ERCP Catheters
- Guidewires
- Sphincterotomes
- Extraction Balloon Catheters
- Extraction Basket Catheters
- Dilation Balloon Catheters
- Large-Balloon Dilation Catheters
- Lithotripsy-Based Management
- Mechanical Lithotripsy
- Electrohydraulic Lithotripsy (EHL)
- Laser Lithotripsy
- Medical Management
- Surgical Management
- Endoscopic Management
- South Asia & Oceania Market Size (US$ Bn) Forecast, by Indication, 2026-2033
- Pancreatic Stones
- Bile Duct Stones
- South Asia & Oceania Market Size (US$ Bn) Forecast, by End User, 2026-2033
- Hospitals
- Ambulatory Surgical Centers
- Speciality Clinics
- Latin America Pancreatic and Bile Duct Stone Management Market Outlook: Historical (2020 – 2025) and Forecast (2026 – 2033)
- Key Highlights
- Latin America Market Size (US$ Bn) Forecast, by Country, 2026-2033
- Brazil
- Mexico
- Rest of LATAM
- Latin America Market Size (US$ Bn) Forecast, by Management Type, 2026-2033
- Endoscopic Management
- ERCP Catheters
- Guidewires
- Sphincterotomes
- Extraction Balloon Catheters
- Extraction Basket Catheters
- Dilation Balloon Catheters
- Large-Balloon Dilation Catheters
- Lithotripsy-Based Management
- Mechanical Lithotripsy
- Electrohydraulic Lithotripsy (EHL)
- Laser Lithotripsy
- Medical Management
- Surgical Management
- Endoscopic Management
- Latin America Market Size (US$ Bn) Forecast, by Indication, 2026-2033
- Pancreatic Stones
- Bile Duct Stones
- Latin America Market Size (US$ Bn) Forecast, by End User, 2026-2033
- Hospitals
- Ambulatory Surgical Centers
- Speciality Clinics
- Middle East & Africa Pancreatic and Bile Duct Stone Management Market Outlook: Historical (2020 – 2025) and Forecast (2026 – 2033)
- Key Highlights
- Middle East & Africa Market Size (US$ Bn) Forecast, by Country, 2026-2033
- GCC Countries
- South Africa
- Northern Africa
- Rest of MEA
- Middle East & Africa Market Size (US$ Bn) Forecast, by Management Type, 2026-2033
- Endoscopic Management
- ERCP Catheters
- Guidewires
- Sphincterotomes
- Extraction Balloon Catheters
- Extraction Basket Catheters
- Dilation Balloon Catheters
- Large-Balloon Dilation Catheters
- Lithotripsy-Based Management
- Mechanical Lithotripsy
- Electrohydraulic Lithotripsy (EHL)
- Laser Lithotripsy
- Medical Management
- Surgical Management
- Endoscopic Management
- Middle East & Africa Market Size (US$ Bn) Forecast, by Indication, 2026-2033
- Pancreatic Stones
- Bile Duct Stones
- Middle East & Africa Market Size (US$ Bn) Forecast, by End User, 2026-2033
- Hospitals
- Ambulatory Surgical Centers
- Speciality Clinics
- Competition Landscape
- Market Share Analysis, 2025
- Market Structure
- Competition Intensity Mapping
- Competition Dashboard
- Company Profiles
- Boston Scientific Corporation
- Company Overview
- Product Portfolio/Offerings
- Key Financials
- SWOT Analysis
- Company Strategy and Key Developments
- Argon Medical Devices
- Olympus Endoscopy
- Cook Medical
- Medtronic Inc.
- Conmed Endoscopic Technologies
- CR BARD Inc (Becton, Dickinson and Company)
- Cordis (Cardinal Health Inc.)
- Zeon Medical Co., Ltd.
- Medi-Globe (ENDO-Flex) GmbH
- Taewoong Medical Co., Ltd.
- Others
- Boston Scientific Corporation
- Appendix
- Research Methodology
- Research Assumptions
- Acronyms and Abbreviations


- Medical Devices
- Pancreatic and Bile Duct Stone Management Market
Pancreatic and Bile Duct Stone Management Market Size, Share, and Growth Forecast 2026 - 2033
Pancreatic and Bile Duct Stone Management Market by Management Type (Endoscopic Management, Lithotripsy-Based Management, Medical Management, and Surgical Management), by Indication (Pancreatic Stones, and Bile Duct Stones), by End User, by Regional Analysis, 2026-2033
Pancreatic and Bile Duct Stone Management Market Size and Trends Analysis
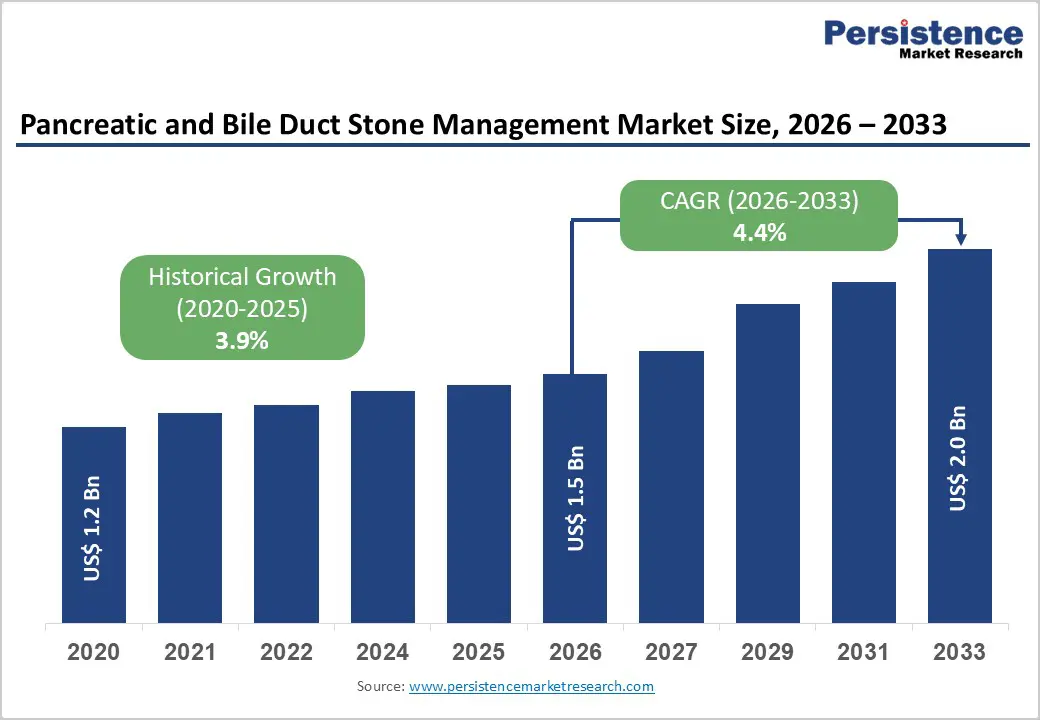
The global pancreatic and bile duct stone management market size is expected to be valued at US$ 1.5 billion in 2026 and projected to reach US$ 2.0 billion by 2033, growing at a CAGR of 4.4% between 2026 and 2033.
The pancreatic and bile duct stone management market focuses on devices and procedures used to diagnose and remove stones obstructing the pancreatic or biliary ducts, which can cause severe pain, infection, jaundice, and pancreatitis. Key interventions include endoscopic retrograde cholangiopancreatography (ERCP), lithotripsy systems, retrieval baskets, balloon catheters, and biliary stents. Rising prevalence of gallstone disease, aging populations, and increasing adoption of minimally invasive endoscopic techniques are driving market expansion across hospitals and specialty gastroenterology centers worldwide.
Current trends include growing use of single-use endoscopic accessories to reduce infection risk, wider adoption of digital cholangioscopy-guided lithotripsy for complex stones, and development of advanced balloon and basket designs for higher clearance rates. Increasing outpatient ERCP procedures, expansion of ambulatory endoscopy centers, and technological integration such as AI-assisted imaging for stone detection are also shaping future market growth.
Key Industry Highlights
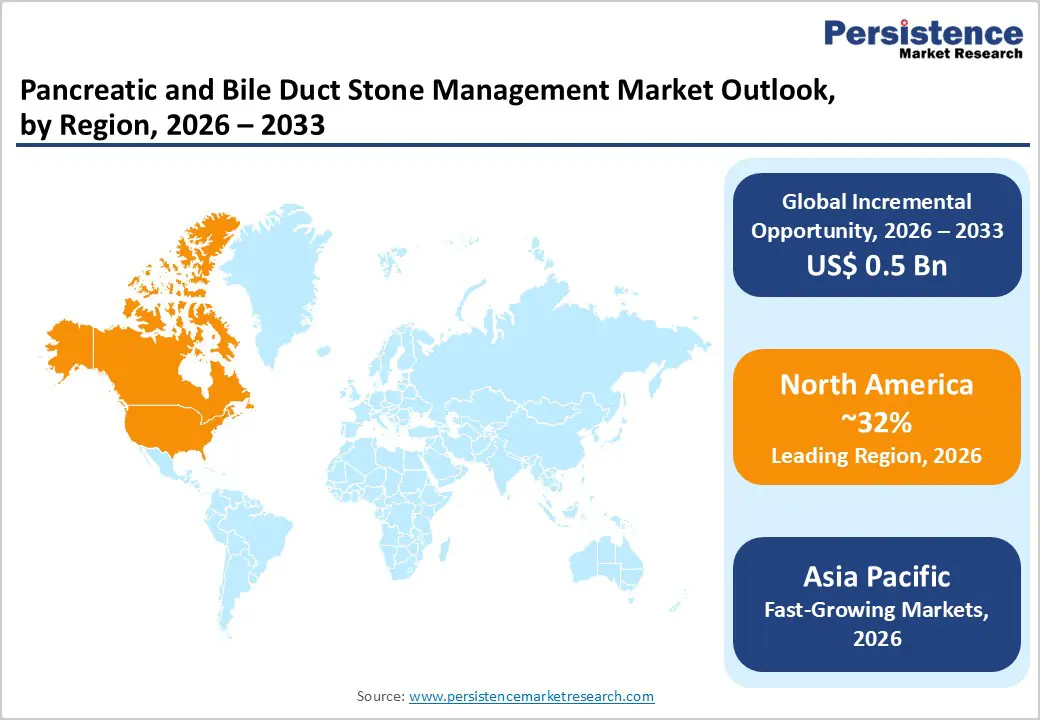
- Leading Region: North America leads the pancreatic and bile duct stone management market, supported by high ERCP volumes, strong reimbursement systems, advanced endoscopy infrastructure, and rapid adoption of novel stents and lithotripsy technologies.
- Fastest Growing Region: Asia Pacific is the fastest-growing region, driven by rising gastrointestinal disease prevalence, expanding hospital capacity, growing medical tourism, and increasing access to minimally invasive endoscopic procedures.
- Dominant Segment: Endoscopic management dominates the pancreatic and bile duct stone management market due to widespread ERCP use, high procedural volumes, and strong clinical success rates in routine stone extraction.
- Fastest Growing Segment: Lithotripsy-based management is expanding most rapidly, driven by adoption of laser and electrohydraulic systems, digital cholangioscopy guidance, and rising treatment of complex or impacted stones.
| Global Market Attributes | Key Insights |
|---|---|
| Pancreatic and Bile Duct Stone Management Market Size (2026E) | US$ 1.5 billion |
| Market Value Forecast (2033F) | US$ 2.0 billion |
| Projected Growth CAGR (2026-2033) | 4.4% |
| Historical Market Growth (2020-2025) | 3.9% |
Market Dynamics
Driver – Increasing Awareness for Gastrointestinal Conditions and Early Diagnosis
Rising awareness of gastrointestinal disorders and the importance of early diagnosis is significantly accelerating demand for pancreatic and bile duct stone management solutions, particularly in emerging economies such as China, India, and parts of Africa. Expanding healthcare infrastructure, improved diagnostic access, and government-led screening initiatives are enabling earlier detection and timely intervention, increasing procedural volumes. Parallel to this trend, strong investment in research and development is fostering innovation in endoscopic devices, supported by advances in material science and clinical manufacturing capabilities. These efforts are driving the introduction of scientifically validated stents, baskets, and lithotripsy systems, enhancing their clinical utility during ERCP procedures and strengthening physician confidence in newer technologies.
Growing adoption of ERCP within advanced treatment protocols further underpins market expansion. Therapeutic ERCP volumes have risen sharply, with published studies indicating a 37% increase, while professional bodies such as the European Society of Gastrointestinal Endoscopy have issued standardized guidelines for managing pancreatic and bile duct stones. In addition, the broad shift toward minimally invasive approaches driven by shorter hospital stays, reduced complications, and faster recovery has largely replaced open surgery. ESGE recommendations supporting ERCP for 80–90% of stone cases continue to reinforce its position as the preferred first-line therapy globally.
Restraints – Unfavourable Reimbursement Policies and Lack of ERCP Skilled Assessment Guideline
Unfavorable reimbursement policies across several regions remain a key barrier to adoption of advanced pancreatic and bile duct stone management technologies. Novel hepatocellular and biliary stents, along with next-generation endoscopic accessories, often face lengthy coverage assessments and pricing pressures from payers, delaying commercialization and limiting hospital procurement. Restricted reimbursement discourages healthcare providers from rapidly shifting toward premium devices, particularly in cost-sensitive systems, thereby slowing the diffusion of technological innovations. These financial uncertainties reduce manufacturers’ incentives to invest aggressively in new product development and regional expansion.
Another major restraint is the lack of standardized ERCP competency guidelines and the risk of post-procedure complications. ERCP is technically demanding and associated with mortality and morbidity rates of approximately 0.1–1% and 5–10%, respectively, making physician expertise critical for safe outcomes. Inconsistent training frameworks can elevate complication rates, dampening procedural volumes and patient acceptance. Clinical evidence indicates post-ERCP complications in 5–10% of cases, commonly pancreatitis, bleeding, infections, or perforations, which may further restrain market growth.
Opportunity – Technological Innovations in Stents and Devices
Technological progress in stents and endoscopic accessories presents a major growth opportunity for the pancreatic and bile duct stone management market. Investment in next-generation self-expandable stents is particularly attractive, as these devices are increasingly used for managing complex strictures and difficult-to-extract stones while maintaining longer patency and reducing repeat interventions. Fully covered metal stents are gaining traction because they limit tumor ingrowth and tissue hyperplasia, improving long-term outcomes in malignant biliary obstruction and supporting strong growth momentum in biliary applications. Integration of adjunctive technologies such as radiofrequency ablation (RFA) into endoscopic platforms further enhances treatment effectiveness, with newer systems capable of achieving extended ablation lengths that improve duct clearance and palliation.
Rising geriatric populations more susceptible to gallstones and biliary disorders are expected to sustain procedural volumes in high-throughput hospitals and specialty centers. At the same time, advances in biocompatible coatings, anti-migration designs, and flexible mesh architectures are improving safety profiles and physician confidence. These innovations create lucrative commercial avenues for ERCP-based adjunct devices, especially in regions expanding advanced endoscopy services.
Category-wise Analysis
By Management Type Analysis
The pancreatic and bile duct stone management market is segmented into endoscopic management, lithotripsy-based management, medical therapy, and surgical interventions. Among these, endoscopic management is expected to dominate the global market, accounting for approximately 52% share in 2026, owing to its role as the primary first-line approach for bile duct and pancreatic stone removal. Procedures such as ERCP, supported by accessories including sphincterotomes, balloons, baskets, and stents, are widely adopted because they are minimally invasive, clinically effective, and associated with shorter hospital stays compared with open surgery. High procedural volumes in hospitals and ambulatory centers, supported reimbursement in developed regions, and expanding endoscopy infrastructure continue to reinforce this segment’s leadership.
Lithotripsy-based management represents the fastest-growing segment during the forecast period, driven by rising prevalence of complex, large, or impacted stones that cannot be extracted using conventional techniques alone. Increasing use of laser and electrohydraulic lithotripsy under digital cholangioscopy guidance is improving stone-clearance rates and reducing the need for repeat procedures or surgery. Continuous technological innovation, regulatory approvals, and physician training programs are further accelerating adoption, positioning lithotripsy as a critical growth engine within the overall market.
By Indication Analysis
By indication, the pancreatic and bile duct stone management market is divided into pancreatic stones and bile duct stones. Bile duct stones dominate this segment and are expected to represent approximately 76% of total market revenue in 2026, driven by their higher prevalence and frequent need for endoscopic intervention. Incidence rises significantly with age, while obesity particularly among women elevates risk due to increased cholesterol secretion in bile. Conversely, rapid weight loss, prolonged fasting, and biliary stasis also contribute to stone formation, broadening the affected patient population.
Hormonal influences and metabolic factors further intensify disease burden, sustaining procedural volumes globally. Epidemiological evidence highlights the large pool of asymptomatic patients, of whom a meaningful proportion later develop complications requiring treatment. Over time, symptom progression leads to increased diagnostic imaging, ERCP utilization, and device demand. This expanding clinical need, combined with aging demographics and lifestyle-related risk factors, positions bile duct stone management as the principal revenue-generating indication within the overall market landscape.

Region-wise Insights
North America Pancreatic and Bile Duct Stone Management Market Trends
North America represents a mature and high-value market for pancreatic and bile duct stone management, with the U.S. accounting for nearly 90% of regional revenue in 2025. The steadily rising incidence of gallstones and biliary obstruction, driven by aging populations, obesity, and metabolic disorders, continues to expand procedural volumes. High per-capita healthcare expenditure, widespread access to advanced endoscopy facilities, and strong physician adoption of minimally invasive ERCP-based techniques further support market leadership. In addition, the presence of major device manufacturers and integrated hospital networks enables rapid commercialization of next-generation lithotripsy systems, stents, and retrieval accessories.
Supportive reimbursement frameworks and government-backed healthcare initiatives enhance manufacturers’ incentives to expand production and distribution. Infrastructure investments, such as Cardinal Health’s March 2022 announcement to build a new medical distribution center near Columbus, Ohio, highlight efforts to strengthen supply chains and improve nationwide access to gastrointestinal intervention portfolios. These factors collectively create a favorable operating environment for sustained growth across hospitals, ambulatory endoscopy centers, and specialty clinics.
Asia Pacific Pancreatic and Bile Duct Stone Management Market Trends
Asia Pacific is emerging as a high-growth region for pancreatic and bile duct stone management, supported by expanding endoscopy capabilities and increasing adoption of ERCP catheters, sphincterotomes, stents, and lithotripsy devices. Rapid urbanization, dietary changes, and rising gastrointestinal disease prevalence particularly in India and China are driving procedural demand. Growing awareness among clinicians and patients regarding minimally invasive treatments is accelerating market penetration, while improving hospital infrastructure and medical tourism further contribute to regional expansion.
Cost advantages associated with locally manufactured devices, including self-expanding balloons and metal stents, are expected to stimulate broader adoption across public and private healthcare facilities. The introduction of alternative and non-invasive technologies to reduce complications linked with conventional ERCP procedures is also shaping competitive dynamics. Strategic collaborations, such as Medtronic plc’s July 2022 partnership with CathWorks to advance catheter-free diagnostic solutions, underscore ongoing innovation efforts. Collectively, these trends position Asia Pacific as a critical future growth engine for the global market.
Market Competitive Landscape
The pancreatic and bile duct stone management market shows moderate consolidation, with leading companies such as Boston Scientific and Olympus driving innovation through sustained investments in research and development. These players are increasingly focused on launching single-use endoscopic accessories, advanced stent platforms, and digital cholangioscopy-compatible devices to improve procedural efficiency and reduce infection risks. Expansion strategies commonly include securing FDA and CE regulatory approvals, broadening geographic footprints, and conducting physician-training programs across Asia-Pacific and other emerging regions to accelerate adoption. Competitive differentiation centers on enhanced biocompatible materials, improved stone-fragmentation and ablation integration, and superior maneuverability during complex procedures. Meanwhile, newer entrants emphasize disposable technologies and cost-effective product lines, aligning with hospital priorities for infection control, workflow standardization, and value-based care delivery.
Key Industry Developments:
- In April 2025, Medtronic plc, a global healthcare technology leader, announced a strategic agreement to distribute Dragonfly Endoscopy, Inc.’s advanced Dragonfly™ pancreaticobiliary system in the United States.
- In March 2022, the Great Place to Work Institute in India gave Cook Medical India its Great Place to Work-Certification. This certification recognises organisations for being employers of choice and is regarded as the industry standard for finding and recognising exceptional workplace cultures.
- In December 2022, MedTech Innovator Asia Pacific teamed up with Olympus Corporation to host the OAIP from 2023 to 2025. Olympus Company is dedicated to making people's lives healthier, safer, and more meaningful.
- In December 2022, Boston Scientific Corporation announced that it would make a partial offer to purchase a majority position in Acotec, a Chinese medical technology business that provides products for various interventional procedures, up to a maximum of 65% of the firm's shares.
Companies Covered in Pancreatic and Bile Duct Stone Management Market
- Boston Scientific Corporation
- Argon Medical Devices
- Olympus Endoscopy
- Cook Medical
- Medtronic Inc.
- Conmed Endoscopic Technologies
- CR BARD Inc (Becton, Dickinson and Company)
- Cordis (Cardinal Health Inc.)
- Zeon Medical Co., Ltd.
- Medi-Globe (ENDO-Flex) GmbH
- Taewoong Medical Co., Ltd.
- Others
Frequently Asked Questions
The market is estimated to be valued at US$ 1.5 Bn in 2026.
Rising gallstone prevalence, aging populations, minimally invasive ERCP adoption, advanced lithotripsy technologies, outpatient procedures growth, and expanding endoscopy centers globally.
The global market is expected to witness a CAGR of 4.4% between 2026 and 2033.
A few of the prominent players operating in the market are Boston Scientific Corporation, Argon Medical Devices, Olympus Endoscopy, Cook Medical, and Medtronic Inc.
North America is the leading region in the global pancreatic and bile duct stone management market.


