

- Executive Summary
- Global Nanophotonics Market Snapshot 2025 and 2032
- Market Opportunity Assessment, 2025-2032, US$ Bn
- Key Market Trends
- Industry Developments and Key Market Events
- Demand Side and Supply Side Analysis
- PMR Analysis and Recommendations
- Market Overview
- Market Scope and Definitions
- Value Chain Analysis
- Macro-Economic Factors
- Global GDP Outlook
- Global Construction Industry Overview
- Global Mining Industry Overview
- Forecast Factors – Relevance and Impact
- COVID-19 Impact Assessment
- PESTLE Analysis
- Porter's Five Forces Analysis
- Geopolitical Tensions: Market Impact
- Regulatory and Technology Landscape
- Market Dynamics
- Drivers
- Restraints
- Opportunities
- Trends
- Price Trend Analysis, 2019 – 2032
- Region-wise Price Analysis
- Price by Segments
- Price Impact Factors
- Global Nanophotonics Market Outlook: Historical (2019 – 2024) and Forecast (2025 – 2032)
- Key Highlights
- Global Nanophotonics Market Outlook: Product
- Introduction/Key Findings
- Historical Market Size (US$ Bn) Analysis by Product, 2019-2024
- Current Market Size (US$ Bn) Forecast, by Product, 2025-2032
- LED
- OLED
- NFO
- Photovoltaic Cells
- Optical Amplifier
- Optical Switches
- Holographic Data Storage System
- Market Attractiveness Analysis: Product
- Global Nanophotonics Market Outlook: Ingredients
- Introduction/Key Findings
- Historical Market Size (US$ Bn) Analysis by Ingredients, 2019-2024
- Current Market Size (US$ Bn) Forecast, by Ingredients, 2025-2032
- Photonic Crystals
- Plasmonics Nanotubes
- Nanoribbons
- Quantum Dots
- Market Attractiveness Analysis: Ingredients
- Global Nanophotonics Market Outlook: Application
- Introduction/Key Findings
- Historical Market Size (US$ Bn) Analysis by Application, 2019-2024
- Current Market Size (US$ Bn) Forecast, by Application, 2025-2032
- Consumer Electronics
- Material Science
- Nonvisible Wavelength Instruments
- Nonvisual Applications
- Indicators
- Market Attractiveness Analysis: Application
- Global Nanophotonics Market Outlook: Region
- Key Highlights
- Historical Market Size (US$ Bn) Analysis by Region, 2019-2024
- Current Market Size (US$ Bn) Forecast, by Region, 2025-2032
- North America
- Europe
- East Asia
- South Asia & Oceania
- Latin America
- Middle East & Africa
- Market Attractiveness Analysis: Region
- North America Nanophotonics Market Outlook: Historical (2019 – 2024) and Forecast (2025 – 2032)
- Key Highlights
- Pricing Analysis
- North America Market Size (US$ Bn) Forecast, by Country, 2025-2032
- U.S.
- Canada
- North America Market Size (US$ Bn) Forecast, by Product, 2025-2032
- LED
- OLED
- NFO
- Photovoltaic Cells
- Optical Amplifier
- Optical Switches
- Holographic Data Storage System
- North America Market Size (US$ Bn) Forecast, by Ingredients, 2025-2032
- Photonic Crystals
- Plasmonics Nanotubes
- Nanoribbons
- Quantum Dots
- North America Market Size (US$ Bn) Forecast, by Application, 2025-2032
- Consumer Electronics
- Material Science
- Nonvisible Wavelength Instruments
- Nonvisual Applications
- Indicators
- Europe Nanophotonics Market Outlook: Historical (2019 – 2024) and Forecast (2025 – 2032)
- Key Highlights
- Pricing Analysis
- Europe Market Size (US$ Bn) Forecast, by Country, 2025-2032
- Germany
- Italy
- France
- U.K.
- Spain
- Russia
- Rest of Europe
- Europe Market Size (US$ Bn) Forecast, by Product, 2025-2032
- LED
- OLED
- NFO
- Photovoltaic Cells
- Optical Amplifier
- Optical Switches
- Holographic Data Storage System
- Europe Market Size (US$ Bn) Forecast, by Ingredients, 2025-2032
- Photonic Crystals
- Plasmonics Nanotubes
- Nanoribbons
- Quantum Dots
- Europe Market Size (US$ Bn) Forecast, by Application, 2025-2032
- Consumer Electronics
- Material Science
- Nonvisible Wavelength Instruments
- Nonvisual Applications
- Indicators
- East Asia Nanophotonics Market Outlook: Historical (2019 – 2024) and Forecast (2025 – 2032)
- Key Highlights
- Pricing Analysis
- East Asia Market Size (US$ Bn) Forecast, by Country, 2025-2032
- China
- Japan
- South Korea
- East Asia Market Size (US$ Bn) Forecast, by Product, 2025-2032
- LED
- OLED
- NFO
- Photovoltaic Cells
- Optical Amplifier
- Optical Switches
- Holographic Data Storage System
- East Asia Market Size (US$ Bn) Forecast, by Ingredients, 2025-2032
- Photonic Crystals
- Plasmonics Nanotubes
- Nanoribbons
- Quantum Dots
- East Asia Market Size (US$ Bn) Forecast, by Application, 2025-2032
- Consumer Electronics
- Material Science
- Nonvisible Wavelength Instruments
- Nonvisual Applications
- Indicators
- South Asia & Oceania Nanophotonics Market Outlook: Historical (2019 – 2024) and Forecast (2025 – 2032)
- Key Highlights
- Pricing Analysis
- South Asia & Oceania Market Size (US$ Bn) Forecast, by Country, 2025-2032
- India
- Southeast Asia
- ANZ
- Rest of SAO
- South Asia & Oceania Market Size (US$ Bn) Forecast, by Product, 2025-2032
- LED
- OLED
- NFO
- Photovoltaic Cells
- Optical Amplifier
- Optical Switches
- Holographic Data Storage System
- South Asia & Oceania Market Size (US$ Bn) Forecast, by Ingredients, 2025-2032
- Photonic Crystals
- Plasmonics Nanotubes
- Nanoribbons
- Quantum Dots
- South Asia & Oceania Market Size (US$ Bn) Forecast, by Application, 2025-2032
- Consumer Electronics
- Material Science
- Nonvisible Wavelength Instruments
- Nonvisual Applications
- Indicators
- Latin America Nanophotonics Market Outlook: Historical (2019 – 2024) and Forecast (2025 – 2032)
- Key Highlights
- Pricing Analysis
- Latin America Market Size (US$ Bn) Forecast, by Country, 2025-2032
- Brazil
- Mexico
- Rest of LATAM
- Latin America Market Size (US$ Bn) Forecast, by Product, 2025-2032
- LED
- OLED
- NFO
- Photovoltaic Cells
- Optical Amplifier
- Optical Switches
- Holographic Data Storage System
- Latin America Market Size (US$ Bn) Forecast, by Ingredients, 2025-2032
- Photonic Crystals
- Plasmonics Nanotubes
- Nanoribbons
- Quantum Dots
- Latin America Market Size (US$ Bn) Forecast, by Application, 2025-2032
- Consumer Electronics
- Material Science
- Nonvisible Wavelength Instruments
- Nonvisual Applications
- Indicators
- Middle East & Africa Nanophotonics Market Outlook: Historical (2019 – 2024) and Forecast (2025 – 2032)
- Key Highlights
- Pricing Analysis
- Middle East & Africa Market Size (US$ Bn) Forecast, by Country, 2025-2032
- GCC Countries
- South Africa
- Northern Africa
- Rest of MEA
- Middle East & Africa Market Size (US$ Bn) Forecast, by Product, 2025-2032
- LED
- OLED
- NFO
- Photovoltaic Cells
- Optical Amplifier
- Optical Switches
- Holographic Data Storage System
- Middle East & Africa Market Size (US$ Bn) Forecast, by Ingredients, 2025-2032
- Photonic Crystals
- Plasmonics Nanotubes
- Nanoribbons
- Quantum Dots
- Middle East & Africa Market Size (US$ Bn) Forecast, by Application, 2025-2032
- Consumer Electronics
- Material Science
- Nonvisible Wavelength Instruments
- Nonvisual Applications
- Indicators
- Competition Landscape
- Market Share Analysis, 2024
- Market Structure
- Competition Intensity Mapping
- Competition Dashboard
- Company Profiles
- IBM
- Company Overview
- Product Portfolio/Offerings
- Key Financials
- SWOT Analysis
- Company Strategy and Key Developments
- Samsung SDI
- Viavi Solutions Lumentum Holdings
- BuckyUSA
- Carbon Solutions
- Cambrios Technologies
- Cnano Technology
- Wolfspeed
- LG Display
- Nanocs
- IBM
- Appendix
- Research Methodology
- Research Assumptions
- Acronyms and Abbreviations


- Chipsets & Processors
- Nanophotonics Market
Nanophotonics Market Size, Share, Trends, Growth, and Forecasts 2025 - 2032
Nanophotonics Market by Product (LED, OLED, NFO), by Ingredients (Photonic Crystals, Plasmonics Nanotubes), by Application (Consumer Electronics, Material Science), and Regional Analysis
Nanophotonics Market Share and Trends Analysis
Global Nanophotonics Market sales revenue totaled around US$ 37.4 billion in 2025. From 2025 to 2032, demand for nanophotonics is projected to rise at 22.8% CAGR. By 2032, the global nanophotonics market value is expected to reach about US$ 157.7 billion.
Key Market Shaping Factors:
- Increasing usage of nanophotonics for communication, electronics, biotechnology, solar power conversions, and defense applications will drive the global market
- Rising adoption of LED in consumer electronics is likely to boost the nanophotonics industry
- Development and popularity of ultra-thin nanomaterials and atomic-thin metal halides will support market expansion
- Growing popularity of nanophotonic biosensors or nanophotonic-based point-of-care devices will boost the market
- Advancements in nanophotonics devices will bode well for the market
- Rising usage of nanophotonics for molecular diagnostics and therapy applications will foster market development
- Escalating trend of electronics miniaturization is projected to create growth prospects for the market
The study of behavior of light on a nanometer scale as well as interactions of nanometer-scale objects with light is known as nanophotonics or simple nano-optics. Nanophotonics is a part of nanotechnology, optics, electrical engineering, and optical engineering.
From consumer electronics, material sciences, and biochemistry to electrical engineering, the applications area of nanophotonics is vast. Top applications of nanophotonics include sensing, display technologies, and photovoltaic devices or optoelectronics.
Growing usage of nanophotonics for offline medical devices for biosensing, such as identifying specific DNA aptamers to detect a particular disease, or for point-of-care devices will boost the market.
Nanophotonics is being incorporated into solar panels or cells, especially metallic nanoparticles, to improve their light collection efficiencies and produce plasmonic solar cells. This will continue to provide impetus to the global nanophotonics industry during the next decade.
Increasing applications in optical communication, light emitting diodes (LED), and organic light emitting diodes (OLED) will boost global nanophotonics sales revenues through 2032.
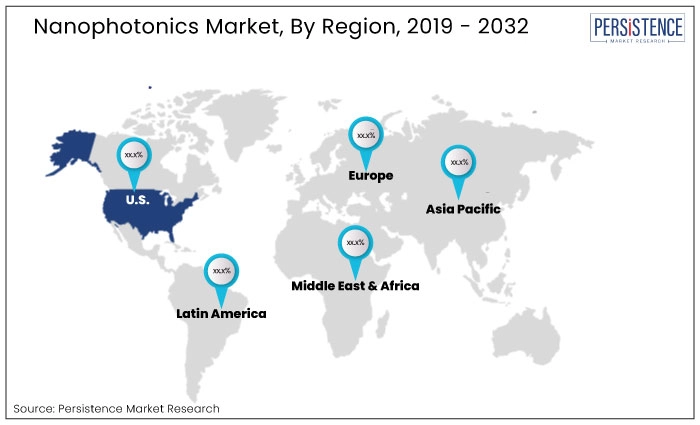
Asia Pacific is expected to retain its dominance in the global nanophotonics industry during the assessment period. In 2022, Asia Pacific nanophotonics industry size reached US$ 19.3 billion.
By 2032, Asia Pacific nanophotonics industry is projected to reach a valuation of US$ 39.8 million in 2033. Rising penetration of 5G technology and booming consumer electronics sector are key factors driving nanophotonics demand in the region.
Asia Pacific is a predominant region in the adoption of 5G services around the world. There were around 9.3 million 5G subscribers in the region in 2019, which increased to around 799 million 5G subscribers in 2024.
By 2027 the total number of 5G subscribers in the Asia Pacific is projected to reach 2.7 billion. This in turn will continue to elevate demand for nanophotonics during the assessment period.
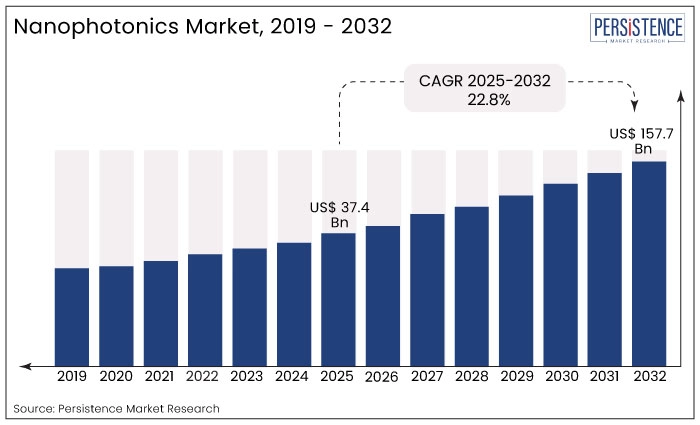
| Attributes | Key Insights |
|---|---|
|
Nanophotonics Market Value in 2025 |
US$ 37.4 billion |
|
Projected Nanophotonics Market Size (2032) |
US$ 157.7 billion |
|
Value-based CAGR (2025 to 2032) |
22.8% |
| Historical Market Growth (CAGR 2019 to 2024) |
20.4% |
2019 to 2024 Nanophotonics Sales Outlook Compared to Demand Forecast from 2025 to 2032
As per Persistence Market Research (PMR), the global nanophotonics market exhibited a CAGR of around 42.2% from 2019 to 2024. Over the next ten years, the market is projected to expand at a CAGR of about 22.8%. It will create an absolute dollar opportunity of US$ 536.3 billion during the forecast period.
With the growing demand for high-speed data communication, nanophotonics is becoming increasingly important for the development of high-performance optical communication networks.
The use of nanophotonic devices, such as waveguides and modulators, enables faster and more efficient data transmission. This is critical for data-intensive applications such as cloud computing, data centers, and 5G networks.
In 2019, around 12 million people were using 5G globally which increased to around 1 billion in 2022. It is projected that by 2027 around 4.3 billion people will be using 5G around the world.
The use of nanophotonics in optical communication can increase the bandwidth of the network. By using nanophotonic components, the amount of data that can be transmitted over a single fiber optic cable can be increased, leading to faster and more efficient communication.
Rising demand for high-speed internet is projected to boost the global nanophotonics industry during the assessment period
Nanophotonics is also used in Internet of Things (IoT) applications to enable high-speed data transfer, sensing, and communication. Nanophotonic devices and materials can be used to develop ultra-compact and high-performance optical sensors and communication systems that are essential for many IoT applications.
Nanophotonics can also be used to develop high-speed optical communication systems for IoT devices, which can transmit large amounts of data over short distances with low power consumption. This is especially important for applications that require high bandwidth and low latency, such as industrial automation, autonomous vehicles, and augmented reality.
There are around 9.7 billion IoT-connected devices around the world in 2020 which is projected to reach around 29.4 billion. With increasing adoption of IoT, demand for nanophotonics is also projected to increase.
Nanophotonics is a significant enabling technology for IoT applications, and its use is expected to rise as the demand for high-performance, energy-efficient, and miniaturized IoT devices and systems continues to increase.
Nanophotonics can also be used in the development of energy-efficient devices, such as solid-state lighting, solar cells, and energy storage devices. The use of nanophotonic materials and structures can improve the efficiency of these devices, reducing their energy consumption and carbon footprint.
Growing demand for consumer electronics, such as smartphones, laptops, and tablets, is likely to boost nanophotonics sales revenue during the next forthcoming decade.
There were around 5.1 billion smartphone users in the world in 2018 which is projected to reach around 7.7 billion by 2027. This in turn will elevate nanophotonics demand during the forecast period.
Nanophotonic materials and devices are being used in various consumer electronics products, which is enabling advanced features and functionalities such as high-resolution displays, improved camera sensors, and faster data communication.
Country-wise Insights:
What is the Growth Projection for the United States Nanophotonics Market?
The United States nanophotonics market registered a growth rate of 38.1% from 2019 to 2024. Over the next ten years, it is expected to progress at 29.2% CAGR. By 2032, the United States market size is forecast to reach around US$ 90.2 billion.
Growing demand for high-speed internet and heavy presence of leading companies are key factors driving the United States market.
In the United States, there were around 1.3 million 5G Subscribers in 2019 which is projected to reach 168 million by 2024. Rising demand for 5G networks in the country will boost the nanophotonics industry during the forecast period.
The use of nanophotonics in optical communication is able to increase the bandwidth of the network. It enables faster data speeds and is therefore becoming key technology in 5G networks.
Rising usage of nanophotonics in biomedical science and technology (including nanomedicine applications) will also boost the United States market.
How is China Nanophotonics Market Shaping?
The nanophotonics industry in China is expected to reach a valuation of about US$ 146.2 billion in 2032. Between 2025 and 2032, China market is likely to create an absolute $ growth of US$ 137.3 billion.
Nanophotonics demand in China is projected to rise at 32.4% CAGR between 2025 and 2032, in comparison to 45% CAGR registered from 2019 to 2024.
China is a leading country in the adoption of 5G globally with around 42 million 5G subscribers in 2023. With the rapid uptake of 5G in the country the number of people using 5G is projected to reach around 1.3 billion by 2032.
With the increase in the number of 5G users in the country, demand for nanophotonics is projected to expand therefore increasing the market during the assessment period.
Category-wise Insights:
Which Ingredient Segment will Witness Significant Growth?
As per Persistence Market Research, plasmonics nanotubes segment will witness significant growth during the projection period. The target segment grew at a CAGR of 41.7% from 2019 to 2024. Over the next ten years, it is expected to progress at 30.5% CAGR.
Plasmonic nanotubes are a type of nanostructure that is used in the field of nanophotonics. They are hollow metallic tubes that exhibit plasmonic behavior. They are capable of supporting surface plasmon resonances, which are collective oscillations of the free electrons in the metal.
Plasmonic nanotubes are used for a variety of applications in nanophotonics, including sensing, spectroscopy, and imaging. By exploiting the strong light-matter interactions that occur in plasmonic nanostructures, these tubes can be used to enhance the detection of biological molecules, pollutants, and other analytes.
Plasmonic nanotubes are a promising nanophotonic platform for a wide range of applications, and their unique properties are expected to continue to drive innovation in the field of nanotechnology.
Which is the Most Remunerative Application of Nanophotonics?
Consumer electronics will remain the most remunerative application of nanophotonics. As per the report, consumer electronics segment exhibited a CAGR of 41.2% from 2019 to 2024. Over the next decade, the same segment is projected to thrive at a CAGR of 30.4% from 2025 to 2032.
Nanophotonics has the potential to transform various aspects of consumer electronics by enabling devices to be thinner, lighter, faster, and more energy-efficient. It is being used to create advanced display technologies that are thinner, lighter, and more energy-efficient than traditional displays.
Quantum dots, or nanoscale semiconductor particles, are being used in quantum dot displays which can produce brighter, more vivid colors and better contrast ratios.
Nanophotonics is being used to create advanced sensors for consumer electronics devices such as plasmonic nanosensors. These sensors can detect and identify tiny amounts of chemicals and biomolecules, making them useful for medical diagnostics and environmental monitoring.
Nanophotonics is also used to create new materials for energy storage devices. Materials such as nanoscale silicon particles are being used in lithium-ion batteries to increase their energy density and improve their performance.
Therefore, rising demand for consumer electronics globally will positively influence nanophotonics industry during the assessment period.
Competitive Landscape:
Leading players operating in the market include IBM, Samsung SDI, Viavi Solutions Lumentum Holdings, BuckyUSA, Carbon Solutions, Cambrios Technologies, Cnano Technology, Wolfspeed, LG Display, and Nanocs.
New product launches, research & development, facility expansions, partnerships, mergers, and acquisitions are few of the key strategies adopted by companies to increase sales and boost their market share.
Recent developments:
- In 2021, development of the 'MiNYTM PL micro-LED PL inspection system was announced by Hamamatsu Photonics. The new addition can enhance micro-LED R&D efficiency while also increasing product yield for display applications.
- In July 2020, Jenoptik announced the acquisition of Trioptics. Trioptics manufactures measurement and testing equipment for optical sensors and components. This acquisition is projected to expand the company’s product offering to the nanophotonics industry.
Companies Covered in Nanophotonics Market
- IBM
- Samsung SDI
- Viavi Solutions Lumentum Holdings
- BuckyUSA
- Carbon Solutions
- Cambrios Technologies
- Cnano Technology
- Wolfspeed
- LG Display
- Nanocs
Frequently Asked Questions
In 2025, the global nanophotonics market is valued at US$ 37.4 billion.
The market is expected to grow to US$ 157.7 billion by 2032.
The market is projected to grow at a CAGR of 22.8% between 2025 and 2032.
Key sectors include consumer electronics, biotechnology, solar power, defense, and communications.
Due to rapid 5G adoption, a strong consumer electronics sector, and rising tech investments.
Key players include IBM, Samsung SDI, Viavi Solutions, Lumentum Holdings, LG Display, and others.


