


1. Executive Summary
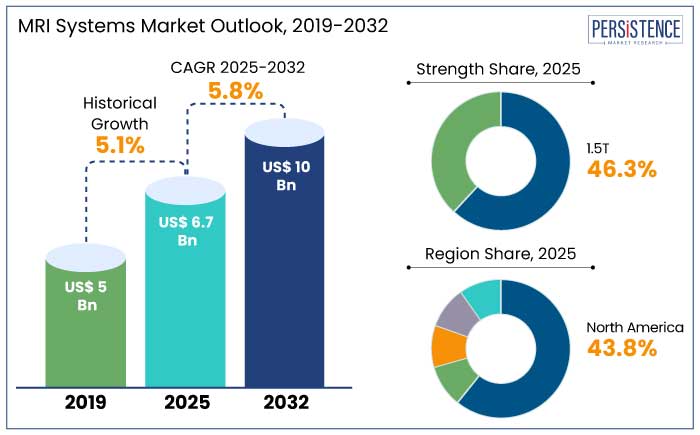
1.1. Global MRI Systems Market Snapshot, 2025 and 2032
1.2. Market Opportunity Assessment, 2025 – 2032, US$ Bn
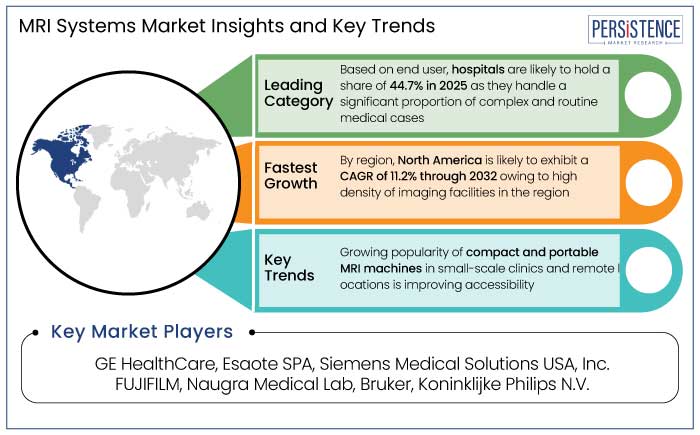
1.3. Key Market Trends
1.4. Future Market Projections
1.5. Premium Market Insights
1.6. Industry Developments and Key Market Events
1.7. PMR Analysis and Recommendations
2. Market Overview
2.1. Market Scope and Definition
2.2. Market Dynamics
2.2.1. Drivers
2.2.2. Restraints
2.2.3. Opportunity
2.2.4. Key Trends
2.3. Macro-Economic Factors
2.3.1. Global Sectorial Outlook
2.3.2. Global GDP Growth Outlook
2.4. COVID-19 Impact Analysis
2.5. Forecast Factors – Relevance and Impact
3. Value Added Insights
3.1. Strength Adoption Analysis
3.2. Regulatory Landscape
3.3. Value Chain Analysis
3.4. Install Base Scenario
3.5. PESTLE Analysis
3.6. Porter’s Five Force Analysis
4. Price Analysis, 2025A
4.1. Key Highlights
4.2. Key Factors Impacting Strength Prices
4.3. Pricing Analysis, By Strength
4.4. Regional Prices and Strength Preferences
5. Global MRI Systems Market Outlook
5.1. Key Highlights
5.1.1. Market Volume (Units) Projections
5.1.2. Market Size (US$ Bn) and Y-o-Y Growth
5.1.3. Absolute $ Opportunity
5.2. Market Size (US$ Bn) and Volume (Units) Analysis and Forecast
5.2.1. Historical Market Size (US$ Bn) and Volume (Units) Analysis, 2019-2023
5.2.2. Current Market Size (US$ Bn) and Volume (Units) Analysis and Forecast, 2025 – 2032
5.3. Global MRI Systems Market Outlook: Strength
5.3.1. Introduction / Key Findings
5.3.2. Historical Market Size (US$ Bn) and Volume (Units) Analysis, By Strength, 2019 – 2023
5.3.3. Current Market Size (US$ Bn) and Volume (Units) Analysis and Forecast, By Strength, 2025 – 2032
5.3.3.1. <0.5T
5.3.3.2. 1.5T
5.3.3.3. 3T
5.3.3.4. >3T
5.3.4. Market Attractiveness Analysis: Strength
5.4. Global MRI Systems Market Outlook: Architecture
5.4.1. Introduction / Key Findings
5.4.2. Historical Market Size (US$ Bn), By Architecture, 2019 – 2023
5.4.3. Current Market Size (US$ Bn) Analysis and Forecast, By Architecture, 2025 – 2032
5.4.3.1. Open
5.4.3.2. Closed
5.4.4. Market Attractiveness Analysis: Architecture
5.5. Global MRI Systems Market Outlook: End User
5.5.1. Introduction / Key Findings
5.5.2. Historical Market Size (US$ Bn) Analysis, By End User, 2019 – 2023
5.5.3. Current Market Size (US$ Bn) Analysis and Forecast, By End User, 2025 – 2032
5.5.3.1. Hospitals
5.5.3.2. Ambulatory Surgical Centers
5.5.3.3. Diagnostic Centers
5.5.3.4. Academic and Research Institutes
5.5.3.5. Others
5.5.4. Market Attractiveness Analysis: End User
6. Global MRI Systems Market Outlook: Region
6.1. Key Highlights
6.2. Historical Market Size (US$ Bn) and Volume (Units) Analysis, By Region, 2019 – 2023
6.3. Current Market Size (US$ Bn) and Volume (Units) Analysis and Forecast, By Region, 2025 – 2032
6.3.1. North America
6.3.2. Europe
6.3.3. East Asia
6.3.4. South Asia and Oceania
6.3.5. Latin America
6.3.6. Middle East and Africa
6.4. Market Attractiveness Analysis: Region
7. North America MRI Systems Market Outlook
7.1. Key Highlights
7.2. Historical Market Size (US$ Bn) Analysis, By Market, 2019 – 2023
7.2.1. By Country
7.2.2. By Strength
7.2.3. By Architecture
7.2.4. By End User
7.3. Current Market Size (US$ Bn) Analysis and Forecast, By Country, 2025 – 2032
7.3.1. U.S.
7.3.2. Canada
7.4. Current Market Size (US$ Bn) and Volume (Units) Analysis and Forecast, By Strength, 2025 – 2032
7.4.1. <0.5T
7.4.2. 1.5T
7.4.3. 3T
7.4.4. >3T
7.5. Current Market Size (US$ Bn) Analysis and Forecast, By Architecture, 2025 – 2032
7.5.1. Open
7.5.2. Closed
7.6. Current Market Size (US$ Bn) Analysis and Forecast, By End User, 2025 – 2032
7.6.1. Hospitals
7.6.2. Ambulatory Surgical Centers
7.6.3. Diagnostic Centers
7.6.4. Academic and Research Institutes
7.6.5. Others
7.7. Market Attractiveness Analysis
8. Europe MRI Systems Market Outlook
8.1. Key Highlights
8.2. Historical Market Size (US$ Bn) Analysis, By Market, 2019 – 2023
8.2.1. By Country
8.2.2. By Strength
8.2.3. By Architecture
8.2.4. By End User
8.3. Current Market Size (US$ Bn) Analysis and Forecast, By Country, 2025 – 2032
8.3.1. Germany
8.3.2. France
8.3.3. U.K.
8.3.4. Italy
8.3.5. Spain
8.3.6. Russia
8.3.7. Türkiye
8.3.8. Rest of Europe
8.4. Current Market Size (US$ Bn) and Volume (Units) Analysis and Forecast, By Strength, 2025 – 2032
8.4.1. <0.5T
8.4.2. 1.5T
8.4.3. 3T
8.4.4. >3T
8.5. Current Market Size (US$ Bn) Analysis and Forecast, By Architecture, 2025 – 2032
8.5.1. Open
8.5.2. Closed
8.6. Current Market Size (US$ Bn) Analysis and Forecast, By End User, 2025 – 2032
8.6.1. Hospitals
8.6.2. Ambulatory Surgical Centers
8.6.3. Diagnostic Centers
8.6.4. Academic and Research Institutes
8.6.5. Others
8.7. Market Attractiveness Analysis
9. East Asia MRI Systems Market Outlook
9.1. Key Highlights
9.2. Historical Market Size (US$ Bn) Analysis, By Market, 2019 – 2023
9.2.1. By Country
9.2.2. By Strength
9.2.3. By Architecture
9.2.4. By End User
9.3. Current Market Size (US$ Bn) Analysis and Forecast, By Country, 2025 – 2032
9.3.1. China
9.3.2. Japan
9.3.3. South Korea
9.4. Current Market Size (US$ Bn) and Volume (Units) Analysis and Forecast, By Strength, 2025 – 2032
9.4.1. <0.5T
9.4.2. 1.5T
9.4.3. 3T
9.4.4. >3T
9.5. Current Market Size (US$ Bn) Analysis and Forecast, By Architecture, 2025 – 2032
9.5.1. Open
9.5.2. Closed
9.6. Current Market Size (US$ Bn) Analysis and Forecast, By End User, 2025 – 2032
9.6.1. Hospitals
9.6.2. Ambulatory Surgical Centers
9.6.3. Diagnostic Centers
9.6.4. Academic and Research Institutes
9.6.5. Others
9.7. Market Attractiveness Analysis
10. South Asia & Oceania MRI Systems Market Outlook
10.1. Key Highlights
10.2. Historical Market Size (US$ Bn) Analysis, By Market, 2019 – 2023
10.2.1. By Country
10.2.2. By Strength
10.2.3. By Architecture
10.2.4. By End User
10.3. Current Market Size (US$ Bn) Analysis and Forecast, By Country, 2025 – 2032
10.3.1. India
10.3.2. Southeast Asia
10.3.3. ANZ
10.3.4. Rest of South Asia & Oceania
10.4. Current Market Size (US$ Bn) and Volume (Units) Analysis and Forecast, By Strength, 2025 – 2032
10.4.1. <0.5T
10.4.2. 1.5T
10.4.3. 3T
10.4.4. >3T
10.5. Current Market Size (US$ Bn) Analysis and Forecast, By Architecture, 2025 – 2032
10.5.1. Open
10.5.2. Closed
10.6. Current Market Size (US$ Bn) Analysis and Forecast, By End User, 2025 – 2032
10.6.1. Hospitals
10.6.2. Ambulatory Surgical Centers
10.6.3. Diagnostic Centers
10.6.4. Academic and Research Institutes
10.6.5. Others
10.7. Market Attractiveness Analysis
11. Latin America MRI Systems Market Outlook
11.1. Key Highlights
11.2. Historical Market Size (US$ Bn) Analysis, By Market, 2019 – 2023
11.2.1. By Country
11.2.2. By Strength
11.2.3. By Architecture
11.2.4. By End User
11.3. Current Market Size (US$ Bn) Analysis and Forecast, By Country, 2025 – 2032
11.3.1. Brazil
11.3.2. Mexico
11.3.3. Rest of Latin America
11.4. Current Market Size (US$ Bn) and Volume (Units) Analysis and Forecast, By Strength, 2025 – 2032
11.4.1. <0.5T
11.4.2. 1.5T
11.4.3. 3T
11.4.4. >3T
11.5. Current Market Size (US$ Bn) Analysis and Forecast, By Architecture, 2025 – 2032
11.5.1. Open
11.5.2. Closed
11.6. Current Market Size (US$ Bn) Analysis and Forecast, By End User, 2025 – 2032
11.6.1. Hospitals
11.6.2. Ambulatory Surgical Centers
11.6.3. Diagnostic Centers
11.6.4. Academic and Research Institutes
11.6.5. Others
11.7. Market Attractiveness Analysis
12. Middle East & Africa MRI Systems Market Outlook
12.1. Key Highlights
12.2. Historical Market Size (US$ Bn) Analysis, By Market, 2019 – 2023
12.2.1. By Country
12.2.2. By Strength
12.2.3. By Architecture
12.2.4. By End User
12.3. Current Market Size (US$ Bn) Analysis and Forecast, By Country, 2025 – 2032
12.3.1. GCC Countries
12.3.2. Egypt
12.3.3. South Africa
12.3.4. Northern Africa
12.3.5. Rest of Middle East & Africa
12.4. Current Market Size (US$ Bn) and Volume (Units) Analysis and Forecast, By Strength, 2025 – 2032
12.4.1. <0.5T
12.4.2. 1.5T
12.4.3. 3T
12.4.4. >3T
12.5. Current Market Size (US$ Bn) Analysis and Forecast, By Architecture, 2025 – 2032
12.5.1. Open
12.5.2. Closed
12.6. Current Market Size (US$ Bn) Analysis and Forecast, By End User, 2025 – 2032
12.6.1. Hospitals
12.6.2. Ambulatory Surgical Centers
12.6.3. Diagnostic Centers
12.6.4. Academic and Research Institutes
12.6.5. Others
12.7. Market Attractiveness Analysis
13. Competition Landscape
13.1. Market Share Analysis, 2025
13.2. Market Structure
13.2.1. Competition Intensity Mapping By Market
13.2.2. Competition Dashboard
13.3. Company Profiles (Details – Overview, Financials, Strategy, Recent Developments)
13.3.1. GE HealthCare
13.3.1.1. Overview
13.3.1.2. Segments and Strengths
13.3.1.3. Key Financials
13.3.1.4. Market Developments
13.3.1.5. Market Strategy
13.3.2. Esaote SPA
13.3.3. Siemens Medical Solutions USA, Inc.
13.3.4. FUJIFILM
13.3.5. Naugra Medical Lab
13.3.6. Bruker
13.3.7. Koninklijke Philips N.V.
13.3.8. Magnetica Ltd
13.3.9. CANON MEDICAL SYSTEMS CORPORATION
13.3.10. United Imaging Healthcare Co., Ltd.
13.3.11. SternMed GmbH
13.3.12. Aspect Imaging Ltd.
13.3.13. HYPERFINE, INC.
13.3.14. AMTZ
13.3.15. Meditech Healthcare Systems
13.3.16. Scintica Instrumentation, Inc.
13.3.17. Hitachi, Ltd.
13.3.18. NordicNeuroLab
13.3.19. MR Solutions
13.3.20. Shimadzu Corporation
13.3.21. MinFound Medical Systems Co., Ltd
13.3.22. Neusoft Medical Systems Co., Ltd.
13.3.23. FONAR Corp.
13.3.24. ASG Superconductors spa
13.3.25. Synaptive Medical
14. Appendix
14.1. Research Methodology
14.2. Research Assumptions
14.3. Acronyms and Abbreviations

Loading page data
Please wait a moment


