

- Executive Summary
- Global Medical Oxygen Systems Market Snapshot, 2026 and 2033
- Market Opportunity Assessment, 2026 – 2033, US$ Bn
- Key Market Trends
- Future Market Projections
- Premium Market Insights
- Industry Developments and Key Market Events
- PMR Analysis and Recommendations
- Market Overview
- Market Scope and Definition
- Market Dynamics
- Drivers
- Restraints
- Opportunity
- Challenges
- Key Trends
- Macro-Economic Factors
- Global Sectorial Outlook
- Global GDP Growth Outlook
- COVID-19 Impact Analysis
- Forecast Factors – Relevance and Impact
- Value Added Insights
- Product Adoption Analysis
- Regulatory Landscape
- Value Chain Analysis
- Key Deals and Mergers
- PESTLE Analysis
- Porter’s Five Force Analysis
- Price Trend Analysis, 2020 – 2033
- Key Highlights
- Key Factors Impacting Product Prices
- Pricing Analysis, By Product Type
- Regional Prices and Product Preferences
- Global Medical Oxygen Systems Market Outlook:
- Key Highlights
- Market Volume (Units) Projections
- Market Size (US$ Bn) and Y-o-Y Growth
- Absolute $ Opportunity
- Market Size (US$ Bn) Analysis and Forecast
- Historical Market Size (US$ Bn) Analysis, 2020-2025
- Market Size (US$ Bn) Analysis and Forecast, 2026–2033
- Global Medical Oxygen Systems Market Outlook: Product Type
- Introduction / Key Findings
- Historical Market Size (US$ Bn) and Volume (Units) Analysis, By Product Type, 2020-2025
- Market Size (US$ Bn) and Volume (Units) Analysis and Forecast, By Product Type, 2026–2033
- Compressed Oxygen Cylinders
- Oxygen Concentrators
- Liquid Oxygen Systems
- Market Attractiveness Analysis: Product Type
- Global Medical Oxygen Systems Market Outlook: Modality
- Introduction / Key Findings
- Historical Market Size (US$ Bn) Analysis, By Modality, 2020-2025
- Market Size (US$ Bn) Analysis and Forecast, By Modality, 2026–2033
- Portable Oxygen Systems
- Stationary/Standalone Oxygen Systems
- Market Attractiveness Analysis: Modality
- Global Medical Oxygen Systems Market Outlook: End User
- Introduction / Key Findings
- Historical Market Size (US$ Bn) Analysis, By End User, 2020-2025
- Market Size (US$ Bn) Analysis and Forecast, By End User, 2026–2033
- Hospitals
- Emergency Medical Centers
- Ambulatory Surgical Centers
- Home Care Settings
- Market Attractiveness Analysis: End User
- Key Highlights
- Global Medical Oxygen Systems Market Outlook: Region
- Key Highlights
- Historical Market Size (US$ Bn) and Volume (Units) Analysis, By Region, 2020-2025
- Market Size (US$ Bn) and Volume (Units) Analysis and Forecast, By Region, 2026–2033
- North America
- Europe
- East Asia
- South Asia and Oceania
- Latin America
- Middle East & Africa
- Market Attractiveness Analysis: Region
- North America Medical Oxygen Systems Market Outlook:
- Key Highlights
- Historical Market Size (US$ Bn) and Volume (Units) Analysis, By Market, 2020-2025
- By Country
- By Product Type
- By Modality
- By End User
- Market Size (US$ Bn) Analysis and Forecast, By Country, 2026–2033
- U.S.
- Canada
- Market Size (US$ Bn) and Volume (Units) Analysis and Forecast, By Product Type, 2026–2033
- Compressed Oxygen Cylinders
- Oxygen Concentrators
- Liquid Oxygen Systems
- Market Size (US$ Bn) Analysis and Forecast, By Modality, 2026–2033
- Portable Oxygen Systems
- Stationary/Standalone Oxygen Systems
- Market Size (US$ Bn) Analysis and Forecast, By End User, 2026–2033
- Hospitals
- Emergency Medical Centers
- Ambulatory Surgical Centers
- Home Care Settings
- Market Attractiveness Analysis
- Europe Medical Oxygen Systems Market Outlook:
- Key Highlights
- Historical Market Size (US$ Bn) and Volume (Units) Analysis, By Market, 2020-2025
- By Country
- By Product Type
- By Modality
- By End User
- Market Size (US$ Bn) Analysis and Forecast, By Country, 2026–2033
- Germany
- France
- U.K.
- Italy
- Spain
- Russia
- Rest of Europe
- Market Size (US$ Bn) and Volume (Units) Analysis and Forecast, By Product Type, 2026–2033
- Compressed Oxygen Cylinders
- Oxygen Concentrators
- Liquid Oxygen Systems
- Market Size (US$ Bn) Analysis and Forecast, By Modality, 2026–2033
- Portable Oxygen Systems
- Stationary/Standalone Oxygen Systems
- Market Size (US$ Bn) Analysis and Forecast, By End User, 2026–2033
- Hospitals
- Emergency Medical Centers
- Ambulatory Surgical Centers
- Home Care Settings
- Market Attractiveness Analysis
- East Asia Medical Oxygen Systems Market Outlook:
- Key Highlights
- Historical Market Size (US$ Bn) and Volume (Units) Analysis, By Market, 2020-2025
- By Country
- By Product Type
- By Modality
- By End User
- Market Size (US$ Bn) Analysis and Forecast, By Country, 2026–2033
- China
- Japan
- South Korea
- Market Size (US$ Bn) and Volume (Units) Analysis and Forecast, By Product Type, 2026–2033
- Compressed Oxygen Cylinders
- Oxygen Concentrators
- Liquid Oxygen Systems
- Market Size (US$ Bn) Analysis and Forecast, By Modality, 2026–2033
- Portable Oxygen Systems
- Stationary/Standalone Oxygen Systems
- Market Size (US$ Bn) Analysis and Forecast, By End User, 2026–2033
- Hospitals
- Emergency Medical Centers
- Ambulatory Surgical Centers
- Home Care Settings
- Market Attractiveness Analysis
- South Asia & Oceania Medical Oxygen Systems Market Outlook:
- Key Highlights
- Historical Market Size (US$ Bn) and Volume (Units) Analysis, By Market, 2020-2025
- By Country
- By Product Type
- By Modality
- By End User
- Market Size (US$ Bn) Analysis and Forecast, By Country, 2026–2033
- India
- Southeast Asia
- ANZ
- Rest of South Asia & Oceania
- Market Size (US$ Bn) and Volume (Units) Analysis and Forecast, By Product Type, 2026–2033
- Compressed Oxygen Cylinders
- Oxygen Concentrators
- Liquid Oxygen Systems
- Market Size (US$ Bn) Analysis and Forecast, By Modality, 2026–2033
- Portable Oxygen Systems
- Stationary/Standalone Oxygen Systems
- Market Size (US$ Bn) Analysis and Forecast, By End User, 2026–2033
- Hospitals
- Emergency Medical Centers
- Ambulatory Surgical Centers
- Home Care Settings
- Market Attractiveness Analysis
- Latin America Medical Oxygen Systems Market Outlook:
- Key Highlights
- Historical Market Size (US$ Bn) and Volume (Units) Analysis, By Market, 2020-2025
- By Country
- By Product Type
- By Modality
- By End User
- Market Size (US$ Bn) Analysis and Forecast, By Country, 2026–2033
- Brazil
- Mexico
- Rest of Latin America
- Market Size (US$ Bn) and Volume (Units) Analysis and Forecast, By Product Type, 2026–2033
- Compressed Oxygen Cylinders
- Oxygen Concentrators
- Liquid Oxygen Systems
- Market Size (US$ Bn) Analysis and Forecast, By Modality, 2026–2033
- Portable Oxygen Systems
- Stationary/Standalone Oxygen Systems
- Market Size (US$ Bn) Analysis and Forecast, By End User, 2026–2033
- Hospitals
- Emergency Medical Centers
- Ambulatory Surgical Centers
- Home Care Settings
- Market Attractiveness Analysis
- Middle East & Africa Medical Oxygen Systems Market Outlook:
- Key Highlights
- Historical Market Size (US$ Bn) and Volume (Units) Analysis, By Market, 2020-2025
- By Country
- By Product Type
- By Modality
- By End User
- Market Size (US$ Bn) Analysis and Forecast, By Country, 2026–2033
- GCC Countries
- Egypt
- South Africa
- Northern Africa
- Rest of Middle East & Africa
- Market Size (US$ Bn) and Volume (Units) Analysis and Forecast, By Product Type, 2026–2033
- Compressed Oxygen Cylinders
- Oxygen Concentrators
- Liquid Oxygen Systems
- Market Size (US$ Bn) Analysis and Forecast, By Modality, 2026–2033
- Portable Oxygen Systems
- Stationary/Standalone Oxygen Systems
- Market Size (US$ Bn) Analysis and Forecast, By End User, 2026–2033
- Hospitals
- Emergency Medical Centers
- Ambulatory Surgical Centers
- Home Care Settings
- Market Attractiveness Analysis
- Competition Landscape
- Market Share Analysis, 2025
- Market Structure
- Competition Intensity Mapping By Market
- Competition Dashboard
- Company Profiles (Details – Overview, Financials, Strategy, Recent Developments)
- Cryofab Inc.
- Overview
- Segments and Product Types
- Key Financials
- Market Developments
- Market Strategy
- Respironics, Inc. (Koninklijke Philips N.V.)
- MEDTRONIC
- Atlas Copco
- Terumo Medical Corporation
- Keen Compressed Gas Co
- Inogen Inc
- GF Health Products, Inc.
- Invacare Corporation
- Others
- Cryofab Inc.
- Appendix
- Research Methodology
- Research Assumptions
- Acronyms and Abbreviations


- Medical Devices
- Medical Oxygen Systems Market
Medical Oxygen Systems Market Size, Share, Growth, and Regional Forecast, 2026 to 2033
Global Medical Oxygen Systems Market by Product Type (Compressed Oxygen Cylinders, Oxygen Concentrators, Liquid Oxygen Systems), Modality (Portable Oxygen Systems, Stationary/Standalone Oxygen Systems), End User (Hospitals, Emergency Medical Centers, Ambulatory Surgical Centers, Home Care Settings), and Regional Analysis from 2026 to 2033
Key Industry Highlights
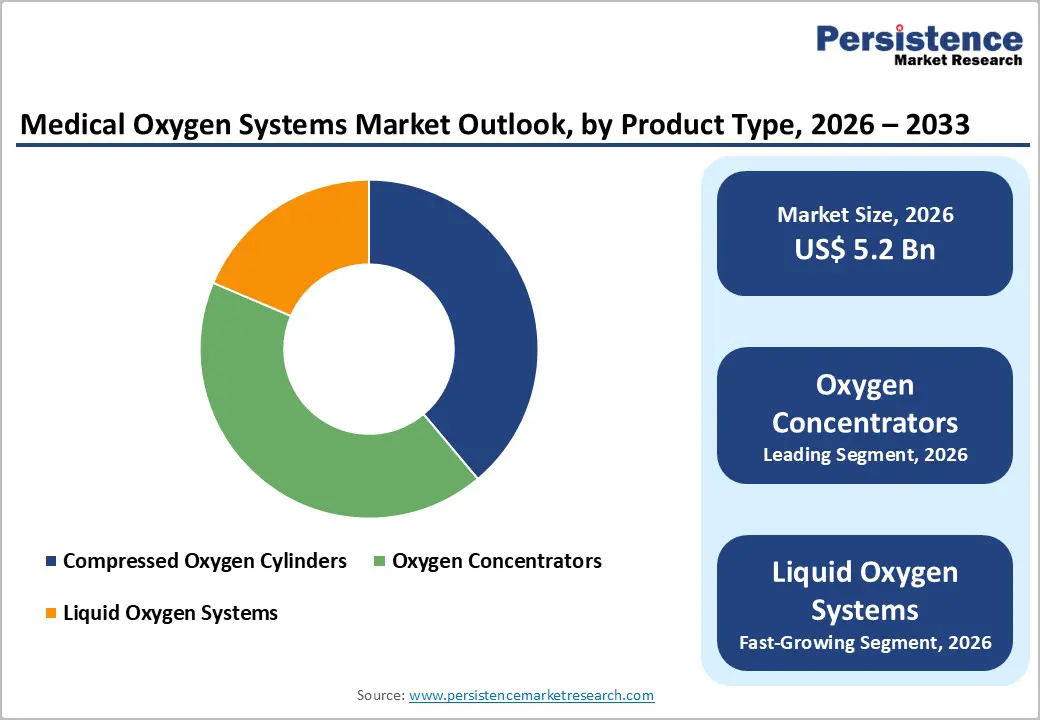
- Dominant Segment: Oxygen concentrators hold the largest market share in 2025 with 42.5% share, driven by ease of use, portability, cost-effectiveness, and suitability for home and hospital care. Adoption spans hospitals, emergency care units, and home healthcare settings.
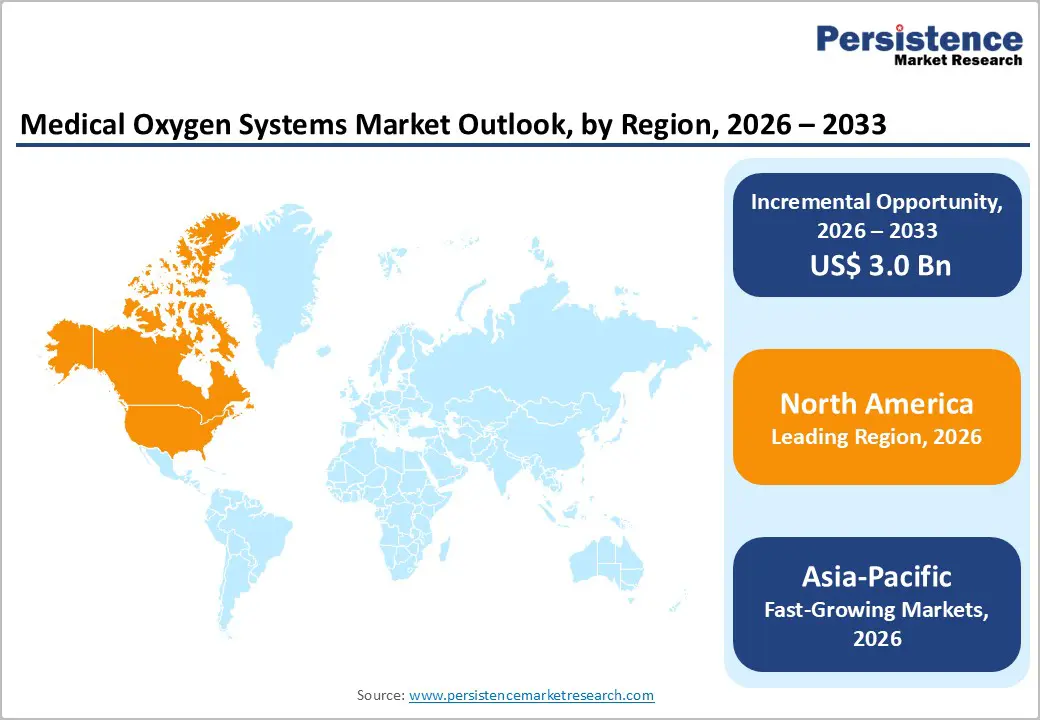
- Dominant Region: North America leads with a significant share with 39.6% share in 2025, supported by advanced healthcare infrastructure, early technology adoption, and high patient volumes. Asia-Pacific is the fastest-growing region, fueled by expanding facilities, rising respiratory disease prevalence, improved access, and growing awareness of early oxygen therapy.
- Market Drivers: Growth is driven by increasing prevalence of respiratory and cardiovascular diseases, rising emergency admissions, demand for precise oxygen delivery, home healthcare adoption, and technological innovations in oxygen systems.
- Market Opportunity: Key opportunities exist in portable and wearable oxygen systems, integration with monitoring devices, expansion in home healthcare, increasing adoption in emerging economies, and technological advancements in liquid oxygen and concentrator systems.
| Report Attribute | Details |
|---|---|
|
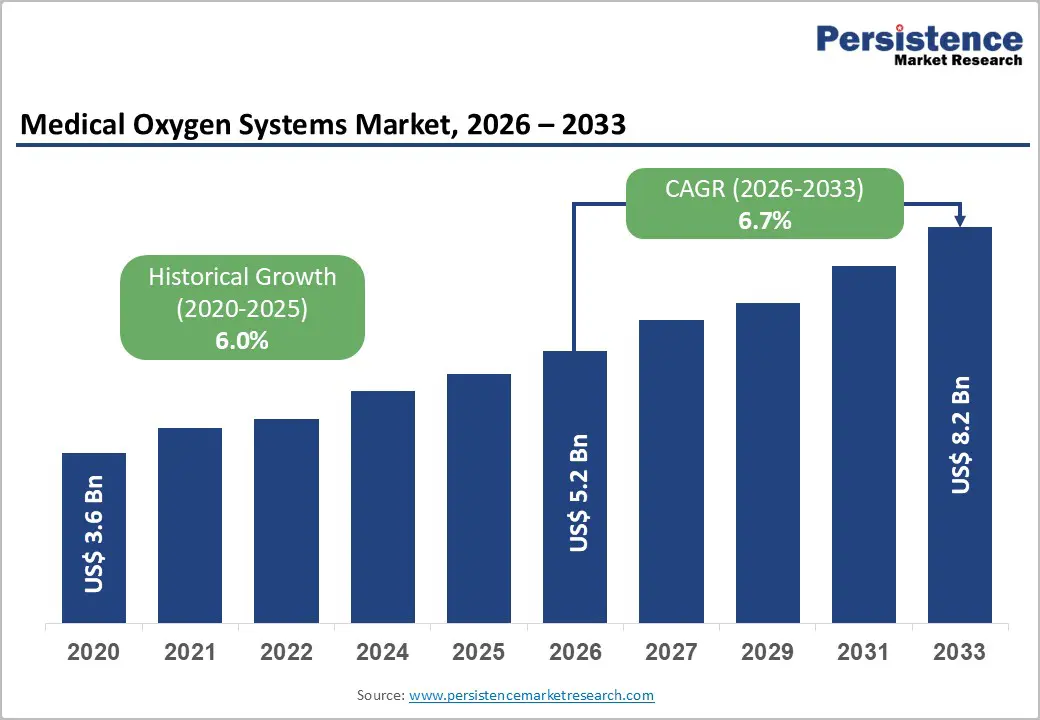
Global Medical Oxygen Systems Market Size (2026E) |
US$ 5.2 Bn |
|
Market Value Forecast (2033F) |
US$ 8.2 Bn |
|
Projected Growth (CAGR 2026 to 2033) |
6.7% |
|
Historical Market Growth (CAGR 2020 to 2025) |
6.0% |
Market Dynamics
Driver: Rising prevalence of respiratory and cardiovascular diseases
The rising prevalence of cardiovascular diseases (CVDs) significantly drives demand for medical oxygen systems, as acute cardiac events often require supplemental oxygen during emergency and critical care. According to the World Health Organization, CVDs are the leading cause of death globally, with an estimated 19.8 million deaths in 2022 about 32% of all global deaths largely due to heart attacks and strokes, conditions that frequently necessitate oxygen support to manage hypoxia and tissue perfusion during acute phases. Early detection and management of CVD are essential but many patients still present late with complications that intensify oxygen therapy needs.
In 2021, global incidence of CRDs was estimated at 55.2 million cases, primarily including asthma (37.9 million) and chronic obstructive pulmonary disease (COPD) (16.9 million), both of which impair pulmonary gas exchange and often require sustained oxygen supplementation. The United States CDC reports about 16 million adults living with COPD, a leading cause of death and chronic disability. Compounded by interactions between pulmonary and cardiac conditions for example, COPD patients show significantly higher cardiovascular disease prevalence heavy oxygen therapy use spans emergency, inpatient, and home care settings.
Restraints: Limited access to healthcare infrastructure in rural/low-income regions
Limited access to healthcare infrastructure in rural and low?income regions remains a significant restraint on the Medical Oxygen Systems Market because many facilities lack adequate beds, equipment, and trained staff to deliver oxygen therapy where needed. For example, in rural India, there are only 3.2 government hospital beds per 10,000 people, far below optimal standards, and community health centres exhibit severe specialist shortages, with up to 81.9% vacancy rates for critical clinicians. This scarcity limits the availability of oxygen delivery equipment and emergency care for severe respiratory cases outside urban centres.
The rural?urban healthcare divide further exacerbates access constraints, as rural populations comprise roughly 65 per cent of India’s population yet have a disproportionately lower share of healthcare resources, such as hospital beds and doctor availability. Estimates indicate rural India has a doctor?to?patient ratio of about 1:10,926, significantly below the WHO recommendation of 1:1000, reflecting severe workforce shortages that hinder timely oxygen therapy and critical care. This inequity forces many rural patients to travel long distances to urban hospitals or delay essential treatment, suppressing demand for localized oxygen systems.
Opportunity: Expansion of portable and wearable oxygen delivery devices
Expansion of portable and wearable oxygen delivery devices presents a key opportunity for the medical oxygen systems market by improving mobility, quality of life, and access to therapy outside hospital settings. Portable oxygen concentrators (POCs), designed to generate medical?grade oxygen from ambient air, have captured a significant share of the oxygen device landscape, with portable units representing around 58% of the medical oxygen concentrator segment in 2024 due to their convenience and mobility advantages. Lightweight, battery?operated POCs allow patients with chronic respiratory conditions, such as COPD, asthma, and pulmonary fibrosis, to receive continuous oxygen therapy during daily activities and travel, reducing reliance on stationary systems and frequent refills.
Global health data underline the demand for portable oxygen solutions, as chronic respiratory diseases affect hundreds of millions worldwide. According to the World Health Organization, chronic respiratory diseases including COPD and asthma constitute a major health burden with extensive prevalence and associated morbidity, driving long?term oxygen therapy needs. Nearly 213 million people globally live with COPD, a leading cause of long?term supplemental oxygen use, and portable devices increasingly support home?based care and ambulatory oxygen needs. The trend toward home healthcare and patient preference for independent living further boosts POC adoption, positioning wearable and transportable oxygen delivery systems as a growth area within the broader medical oxygen ecosystem.
Category-wise Analysis
By Product Type, Oxygen Concentrators Dominates the Medical Oxygen Systems Market
Oxygen Concentrators occupies 42.5% share of the global market in 2025, because they provide a continuous, reliable, and cost?effective source of medical oxygen without frequent refills or complex logistics. Unlike cylinders or liquid oxygen, concentrators use pressure?swing adsorption to extract ambient air and deliver oxygen at clinically acceptable purity (90–95%), suitable for most respiratory therapies in home and clinical settings. WHO guidance highlights concentrators as essential oxygen sources across health systems, particularly where supply chain and refill infrastructure are limited, because they can run continuously 24/7 with minimal maintenance. They are widely adopted for home care, accounting for a major share of usage globally, with portable units representing roughly 55–60% of the segment due to mobility and convenience benefits in chronic respiratory disease management.
By Modality, Portable Oxygen Systems dominates due to mobility, convenience, and growing chronic respiratory therapy demand
Portable oxygen systems dominate the medical oxygen systems market because they meet the growing clinical and lifestyle needs of patients requiring supplemental oxygen beyond fixed care settings. Portable oxygen concentrators are compact, lightweight, battery?operated devices that allow patients to receive prescribed oxygen while moving, traveling, or during daily activities, expanding therapy beyond static home or hospital units and enhancing independence. For instance, in the United States, over 1.5?million adults use supplemental oxygen for chronic respiratory disorders, and portable systems are increasingly preferred due to their mobility and convenience outside the home. Portable oxygen concentrators have surpassed stationary units in penetration, with portable systems showing higher adoption rates (e.g., 22?% vs. 17?% penetration in the U.S. oxygen concentrator market in 2021), indicating a clear trend toward ambulatory oxygen delivery. Portable devices are also now approved for use during air travel, further increasing their utility and patient acceptance as essential long?term oxygen therapy solutions.
Regional Insights
North America Medical Oxygen Systems Market Trends
North America dominates the medical oxygen systems market with 39.6% share in 2025, because of high demand driven by prevalent respiratory diseases and strong healthcare infrastructure. In the United States, nearly 16?million adults have chronic obstructive pulmonary disease (COPD), a major indication for supplemental oxygen and chronic lower respiratory diseases remain among the top causes of morbidity and hospital visits, underscoring persistent oxygen therapy demand.? Additionally, the region holds roughly 35–40?% of the global oxygen systems market, supported by advanced hospital networks with centralized oxygen pipelines and home?care adoption, along with robust reimbursement frameworks that improve access to oxygen delivery devices.? High healthcare spending and widespread technology adoption further reinforce North America’s leadership in medical oxygen solutions.?
Europe Medical Oxygen Systems Market Trends
Europe is an important region in the medical oxygen systems market because of its high burden of chronic respiratory diseases, aging population, and robust healthcare infrastructure. In the WHO European Region, over 80?million people live with chronic respiratory diseases such as COPD and asthma, which frequently require supplemental oxygen therapy; these conditions are among the leading contributors to disability and death, with COPD causing nearly 80?% of CRD?related fatalities and affecting millions annually. Additionally, respiratory diseases account for a significant share of mortality in the European Union, where diseases of the respiratory system represented about 6.7?% of all deaths in 2020, reinforcing sustained demand for oxygen delivery systems across hospitals, clinics, and homecare settings. The combination of high disease prevalence, economic burden, and strong healthcare services makes Europe a key market for medical oxygen technologies.
Asia-Pacific Medical Oxygen Systems Market Trends
Asia?Pacific is the fastest?growing region in the medical oxygen systems market because rapid expansion of healthcare infrastructure and a large respiratory disease burden are driving demand. Chronic respiratory disease prevalence, including COPD, is significant across Asia Pacific, with country?level estimates showing COPD rates from 4.4% to 16.7% in China and similar high levels in Korea and Australia, indicating a substantial oxygen therapy need.? In the WHO South?East Asia Region, chronic respiratory diseases caused approximately 1.56?million deaths in 2021, underscoring the heavy clinical burden.? Governments are expanding hospitals and clinics to meet these needs, improving access and fueling faster adoption of oxygen systems than in more mature markets.?
Market Competitive Landscape
The medical oxygen systems market is competitive, led by global and regional players offering stationary, portable, and wearable systems. Companies focus on device reliability, safety, energy efficiency, and regulatory compliance. Innovations in portable concentrators, liquid oxygen systems, and IoT-enabled devices, along with strategic partnerships and regional expansion, intensify competition and drive differentiation across the global oxygen delivery market.
Key Industry Developments:
- In December 2025, Cryofab Inc., based in New Jersey, completed the acquisition of Cryocomp Inc., a leading cryogenic valves supplier headquartered in California. The deal strengthens Cryofab’s portfolio in cryogenic systems and valve technologies, expands its U.S. market presence, and enhances capabilities in manufacturing and servicing critical cryogenic components for industrial and medical applications.
- In October 2025, Medtronic expanded its VitalFlow™ ECMO system operations in Europe, enhancing access to advanced extracorporeal membrane oxygenation technology. The expansion aims to support hospitals and critical care centers across the region with improved patient support, training, and service infrastructure, strengthening Medtronic’s presence in the European cardiopulmonary and critical care device market.
Companies Covered in Medical Oxygen Systems Market
- Cryofab Inc
- Respironics, Inc. (Koninklijke Philips N.V.)
- MEDTRONIC
- Atlas Copco
- Terumo Medical Corporation
- Keen Compressed Gas Co
- Inogen Inc
- GF Health Products, Inc.
- Invacare Corporation
- Others
Frequently Asked Questions
The global medical oxygen systems market is projected to be valued at US$ 5.2 Bn in 2026.
Rising respiratory and cardiovascular diseases, homecare adoption, technological advances, and growing demand drive market growth.
The global medical oxygen systems market is poised to witness a CAGR of 6.7% between 2026 and 2033.
Expansion of portable, wearable, IoT-enabled oxygen devices, homecare adoption, emerging markets, and technological innovations offer opportunities.
Cryofab Inc, Respironics, Inc. (Koninklijke Philips N.V.), MEDTRONIC, Atlas Copco, Terumo Medical Corporation, Keen Compressed Gas Co.


