

- Executive Summary
- Global Mechanical Mines Clearance System Market Snapshot 2026 and 2033
- Market Opportunity Assessment, 2026 - 2033, US$ Mn
- Key Market Trends
- Industry Developments and Key Market Events
- Demand Side and Supply Side Analysis
- PMR Analysis and Recommendations
- Market Overview
- Market Scope and Definitions
- Value Chain Analysis
- Macro-Economic Factors
- Global GDP Outlook
- Global Prison Growth Outlook
- Global Crime Rates by Country
- Global Prison Population by Country
- Global Private Prison Market Growth Outlook
- Other Macro-economic Factors
- Forecast Factors - Relevance and Impact
- COVID-19 Impact Assessment
- PESTLE Analysis
- Porter's Five Forces Analysis
- Geopolitical Tensions: Market Impact
- Regulatory and Technology Landscape
- Market Dynamics
- Drivers
- Restraints
- Opportunities
- Trends
- Price Trend Analysis, 2020 - 2033
- Region-wise Price Analysis
- Price by Segments
- Price Impact Factors
- Global Mechanical Mines Clearance System Market Outlook: Historical (2020 - 2025) and Forecast (2026 - 2033)
- Key Highlights
- Global Mechanical Mines Clearance System Market Outlook: Product Type
- Introduction/Key Findings
- Historical Market Size (US$ Mn) Analysis by Product Type, 2020-2025
- Current Market Size (US$ Mn) Forecast, by Product Type, 2026-2033
- Flails & Drum Cutters
- Rotary Tillers
- Rollers
- Othes
- Market Attractiveness Analysis: Product Type
- Global Mechanical Mines Clearance System Market Outlook: Operation
- Introduction/Key Findings
- Historical Market Size (US$ Mn) Analysis by Operation, 2020-2025
- Current Market Size (US$ Mn) Forecast, by Operation, 2026-2033
- Manual Operation
- Automatic Operation
- Market Attractiveness Analysis: Operation
- Global Mechanical Mines Clearance System Market Outlook: Application
- Introduction/Key Findings
- Historical Market Size (US$ Mn) Analysis by Application, 2020-2025
- Current Market Size (US$ Mn) Forecast, by Application, 2026-2033
- Military & Defense
- Humanitarian Demining
- Construction & Infrastructure
- Market Attractiveness Analysis: Application
- Global Mechanical Mines Clearance System Market Outlook: Region
- Key Highlights
- Historical Market Size (US$ Mn) Analysis by Region, 2020-2025
- Current Market Size (US$ Mn) Forecast, by Region, 2026-2033
- North America
- Europe
- East Asia
- South Asia & Oceania
- Latin America
- Middle East & Africa
- Market Attractiveness Analysis: Region
- North America Mechanical Mines Clearance System Market Outlook: Historical (2020 - 2025) and Forecast (2026 - 2033)
- Key Highlights
- Pricing Analysis
- North America Market Size (US$ Mn) Forecast, by Country, 2026-2033
- U.S.
- Canada
- North America Market Size (US$ Mn) Forecast, by Product Type, 2026-2033
- Flails & Drum Cutters
- Rotary Tillers
- Rollers
- Othes
- North America Market Size (US$ Mn) Forecast, by Operation, 2026-2033
- Manual Operation
- Automatic Operation
- North America Market Size (US$ Mn) Forecast, by Application, 2026-2033
- Military & Defense
- Humanitarian Demining
- Construction & Infrastructure
- Europe Mechanical Mines Clearance System Market Outlook: Historical (2020 - 2025) and Forecast (2026 - 2033)
- Key Highlights
- Pricing Analysis
- Europe Market Size (US$ Mn) Forecast, by Country, 2026-2033
- Germany
- Italy
- France
- U.K.
- Spain
- Russia
- Rest of Europe
- Europe Market Size (US$ Mn) Forecast, by Product Type, 2026-2033
- Flails & Drum Cutters
- Rotary Tillers
- Rollers
- Othes
- Europe Market Size (US$ Mn) Forecast, by Operation, 2026-2033
- Manual Operation
- Automatic Operation
- Europe Market Size (US$ Mn) Forecast, by Application, 2026-2033
- Military & Defense
- Humanitarian Demining
- Construction & Infrastructure
- East Asia Mechanical Mines Clearance System Market Outlook: Historical (2020 - 2025) and Forecast (2026 - 2033)
- Key Highlights
- Pricing Analysis
- East Asia Market Size (US$ Mn) Forecast, by Country, 2026-2033
- China
- Japan
- South Korea
- East Asia Market Size (US$ Mn) Forecast, by Product Type, 2026-2033
- Flails & Drum Cutters
- Rotary Tillers
- Rollers
- Othes
- East Asia Market Size (US$ Mn) Forecast, by Operation, 2026-2033
- Manual Operation
- Automatic Operation
- East Asia Market Size (US$ Mn) Forecast, by Application, 2026-2033
- Military & Defense
- Humanitarian Demining
- Construction & Infrastructure
- South Asia & Oceania Mechanical Mines Clearance System Market Outlook: Historical (2020 - 2025) and Forecast (2026 - 2033)
- Key Highlights
- Pricing Analysis
- South Asia & Oceania Market Size (US$ Mn) Forecast, by Country, 2026-2033
- India
- Southeast Asia
- ANZ
- Rest of SAO
- South Asia & Oceania Market Size (US$ Mn) Forecast, by Product Type, 2026-2033
- Flails & Drum Cutters
- Rotary Tillers
- Rollers
- Othes
- South Asia & Oceania Market Size (US$ Mn) Forecast, by Operation, 2026-2033
- Manual Operation
- Automatic Operation
- South Asia & Oceania Market Size (US$ Mn) Forecast, by Application, 2026-2033
- Military & Defense
- Humanitarian Demining
- Construction & Infrastructure
- Latin America Mechanical Mines Clearance System Market Outlook: Historical (2020 - 2025) and Forecast (2026 - 2033)
- Key Highlights
- Pricing Analysis
- Latin America Market Size (US$ Mn) Forecast, by Country, 2026-2033
- Brazil
- Mexico
- Rest of LATAM
- Latin America Market Size (US$ Mn) Forecast, by Product Type, 2026-2033
- Flails & Drum Cutters
- Rotary Tillers
- Rollers
- Othes
- Latin America Market Size (US$ Mn) Forecast, by Operation, 2026-2033
- Manual Operation
- Automatic Operation
- Latin America Market Size (US$ Mn) Forecast, by Application, 2026-2033
- Military & Defense
- Humanitarian Demining
- Construction & Infrastructure
- Middle East & Africa Mechanical Mines Clearance System Market Outlook: Historical (2020 - 2025) and Forecast (2026 - 2033)
- Key Highlights
- Pricing Analysis
- Middle East & Africa Market Size (US$ Mn) Forecast, by Country, 2026-2033
- GCC Countries
- South Africa
- Northern Africa
- Rest of MEA
- Middle East & Africa Market Size (US$ Mn) Forecast, by Product Type, 2026-2033
- Flails & Drum Cutters
- Rotary Tillers
- Rollers
- Othes
- Middle East & Africa Market Size (US$ Mn) Forecast, by Operation, 2026-2033
- Manual Operation
- Automatic Operation
- Middle East & Africa Market Size (US$ Mn) Forecast, by Application, 2026-2033
- Military & Defense
- Humanitarian Demining
- Construction & Infrastructure
- Competition Landscape
- Market Share Analysis, 2025
- Market Structure
- Competition Intensity Mapping
- Competition Dashboard
- Company Profiles
- Armtrac Limited
- Company Overview
- Product Portfolio/Offerings
- Key Financials
- SWOT Analysis
- Company Strategy and Key Developments
- Cefa Sas
- DOK-ING d.o.o
- FAE Group
- Hydrema Holding ApS
- Pearson Engineering
- ScanJack AB
- Scopex
- Way Industries
- Westminster Group Plc
- MineWolf Systems AG
- Aardvark Clear Mine Ltd.
- Rheinmetall AG
- Digger DTR - Demining Technologies
- Hitachi Construction Machinery
- Komatsu Limited
- Mahindra Defence Systems
- Bharat Electronics Limited
- ECA GROUP
- Milrem Robotics
- Armtrac Limited
- Appendix
- Research Methodology
- Research Assumptions
- Acronyms and Abbreviations


- Off-Road Equipment & Machinery
- Mechanical Mine Clearance System Market
Mechanical Mine Clearance System Market Size, Share, and Growth Forecast 2026 - 2033
Mechanical Mine Clearance System Market by Product Type (Flails & Drum Cutters, Rotary Tillers, Rollers, Others), Operation (Manual Operation, Automatic Operation), Application (Military & Defense, Humanitarian Demining, Construction & Infrastructure), and Regional Analysis, 2026 - 2033
Mechanical Mine Clearance System Market Size and Trend Analysis
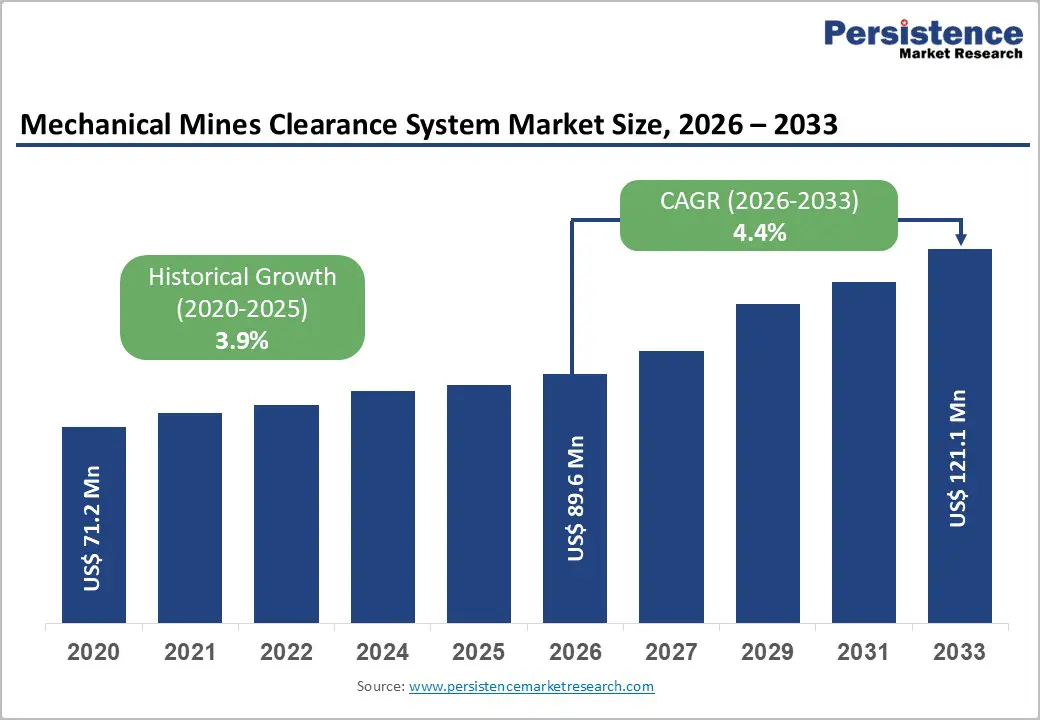
The global mechanical mine clearance system market is expected to be valued at US$ 89.6 million in 2026 and projected to reach US$ 121.1 million by 2033, growing at a CAGR of 4.4% between 2026 and 2033.
Market expansion is driven by escalating geopolitical tensions and increasing landmine contamination in post-conflict regions, with more than 60 countries currently facing active landmine threats that require mechanized clearance solutions. The United Nations estimates that more than 110 million landmines remain buried worldwide, creating sustained demand for advanced mechanical clearance technologies across military, humanitarian, and infrastructure development applications. Technological advancements in remote-controlled systems, artificial intelligence integration, and autonomous operation capabilities have substantially improved clearance efficiency and operator safety, achieving accuracy rates exceeding 95% while substantially reducing personnel risk during dangerous demining operations.
Key Market Highlights
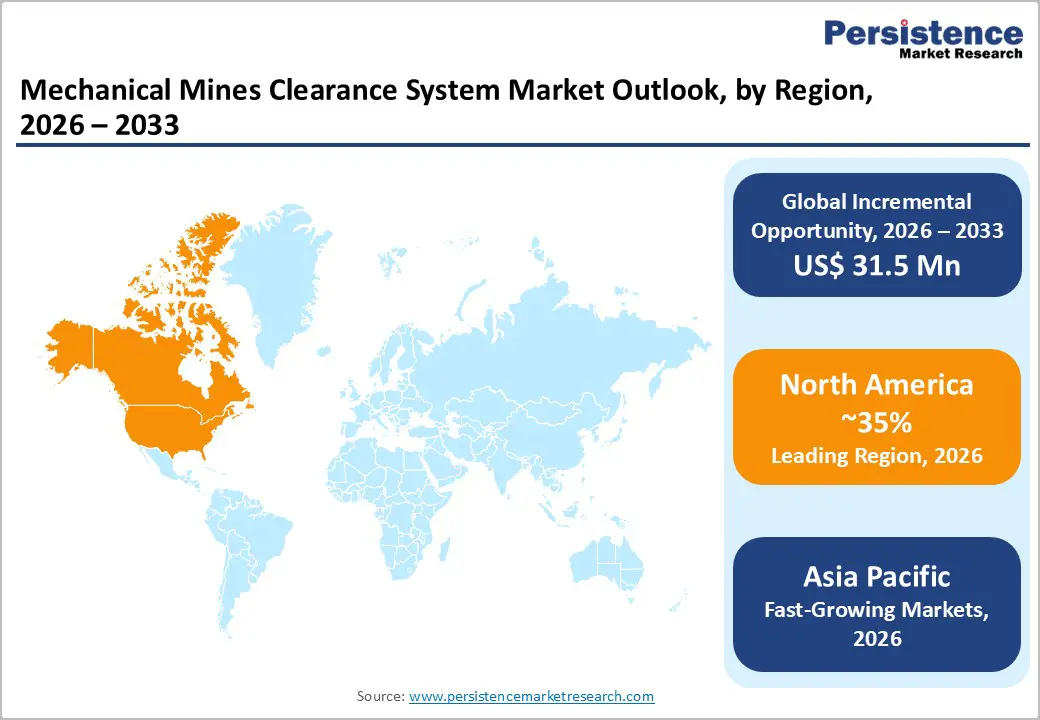
- Leading Region: North America maintains a substantial regional presence with approximately 35% market share, driven by exceptional defense budgets, technological leadership through major equipment manufacturers, and robust Army Humanitarian Demining R&D Program investment supporting international demining operations across multiple continents
- Fastest Growing Region: Asia Pacific demonstrates the fastest regional growth trajectory with 32.8% projected market share, driven by post-conflict rehabilitation in India, Vietnam, and Cambodia, expanding infrastructure development initiatives, and cost-optimized manufacturing capabilities enabling humanitarian organization equipment accessibility.
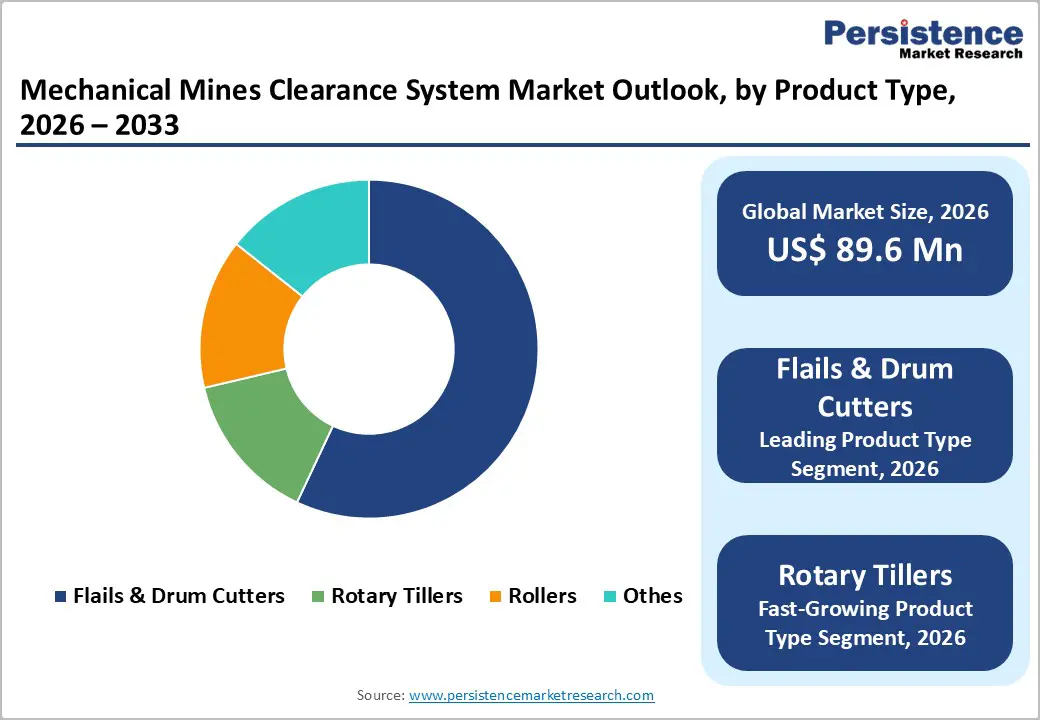
- Dominant Product Segment: Flail and drum cutter systems command approximately 57% market share, reflecting superior versatility across terrain types, proven effectiveness in shallow and mid-depth mine clearance, established operator expertise, and demonstrated track record across international demining programs spanning multiple decades and diverse operational contexts.
- Dominant Operation Segment: Manual operation systems maintain approximately 48% market share, reflecting fundamental cost advantages and accessibility for humanitarian organizations and developing nations with constrained financial resources, while automatic and remote-controlled systems are experiencing accelerated adoption in developed economies, driven by improved operator safety benefits that justify premium capital expenditures.
- Leading Application Segment: Humanitarian demining represents the leading application segment commanding the largest market share, supported by sustained international donor funding commitments, global humanitarian imperative to reduce casualty burden, and UN-established humanitarian demining as a distinct operational category with a focus on complete land clearance supporting civilian return and economic rehabilitation.
| Key Insights | Details |
|---|---|
| Mechanical Mine Clearance System Market Size (2026E) | US$ 89.6 million |
| Market Value Forecast (2033F) | US$ 121.1 million |
| Projected Growth CAGR (2026 - 2033) | 4.4% |
| Historical Market Growth (2020 - 2025) | 3.9% |
Market Dynamics
Drivers - Rise in Geopolitical Tensions and Rising Defense Expenditures for Mine Countermeasures
The mechanical mines-clearance system market is experiencing substantial growth, driven by increasing global military spending and defense budget allocations that prioritize demining capabilities and mine countermeasure technologies. Geopolitical conflicts, including the Russia-Ukraine war, have dramatically increased demand for mechanical clearance systems, with Ukraine clearing over 274,000 hectares of contaminated farmland in 2023 alone and projecting total demining costs of USD 37 billion over at least a decade. Military modernization programs across developing nations are allocating increased funding to humanitarian demining operations and specialized mine-clearance equipment, recognizing the strategic importance of rapid area clearing for battlefield mobility and post-conflict reconstruction.
The U.S. Government investment in humanitarian demining has grown from several million dollars annually in the early 2000s to approximately USD 33 million in 2024, reflecting political commitment to international demining partnerships and technology development. Defense research agencies, including DARPA and the U.S. Army Research Laboratory, maintain robust investments in advanced mine-clearance technologies, thereby driving innovation across the mechanical systems segment.
Technological Advancements in Autonomous Operation and AI-Powered Detection Capabilities
Technological innovation in mechanical mine clearance systems has fundamentally transformed demining operations, with modern systems incorporating advanced sensor integration, artificial intelligence algorithms, and autonomous remote-controlled capabilities. Recent innovations enabling uncrewed mechanical systems can achieve clearance rates of 4,500 square meters per hour, substantially exceeding traditional manual demining productivity while eliminating operator exposure to explosive ordnance risks. The integration of machine learning, computer vision, and sensor fusion technologies has enhanced mine pattern recognition and detection accuracy, enabling systems to distinguish between genuine explosive threats and ground clutter with exceptional precision.
Additive manufacturing and 3D printing technologies are enabling the production of specialized, customized demining attachments optimized for diverse terrains ranging from deserts to post-conflict urban environments. Modern platforms feature mesh-capable remote control systems that provide operational ranges exceeding 3,000 kilometers Line of Sight, comprehensive real-time video feeds, and integrated diagnostic capabilities, enabling effective deployment across vast contaminated territories. Lightweight composite materials and fuel cell power sources are enhancing machine mobility and operational endurance in geographically challenging regions, thereby addressing fundamental operational constraints that previously limited the deployment of mechanical systems.
Restraints - High Operational and Maintenance Costs Limiting Equipment Accessibility
The mechanical mines clearance system market faces significant constraints from elevated operational expenses and substantial maintenance requirements, which limit deployment in resource-constrained humanitarian demining environments. Advanced mechanical systems incorporating remote-controlled capabilities, sensor integration, and autonomous operation features entail substantial capital expenditures, which challenge procurement decisions for developing nations and humanitarian organizations operating with limited budgets.
Beyond initial equipment acquisition, organizations must allocate significant resources to specialized operator training, system maintenance and component replacement, repair services in remote operational areas, and the development of technical expertise. Difficult terrain operations, including dense forests, marshy lands, and mountainous regions, substantially increase operational costs due to frequent equipment repairs, component replacements, and fuel consumption that exceeds standard utility assumptions. The cumulative financial burden of acquiring, deploying, and maintaining sophisticated mechanical clearance systems creates accessibility barriers particularly in emerging economies and humanitarian contexts with constrained financial resources.
Lack of Standardization and Complex System Integration Challenges
The mechanical mines clearance system market faces operational challenges from incomplete international standardization of demining equipment specifications and complex integration requirements with diverse operational environments and threat scenarios. Different regions face unique explosive ordnance threats including anti-personnel mines, anti-vehicle mines, cluster munitions, unexploded ordnance (UXO), and IEDs, requiring customized demining approaches and specialized system configurations.
The absence of universally adopted technical standards creates compatibility challenges when deploying systems across international borders and transitioning equipment between operators with different maintenance protocols and operational procedures. Complex training requirements for specialized operator certification, maintenance technician qualification, and field deployment team coordination impose substantial human resource development burdens, extending implementation timelines and increasing total program costs.
Opportunities - Strategic European Joint Ventures and Unmanned Ground Vehicle Development Programs
The mechanical mines clearance system market is experiencing exceptional growth opportunities through strategic collaborative partnerships, advancing unmanned ground vehicle (UGV) development capabilities, and establishing European technological leadership in autonomous demining systems. Rheinmetall AG and DOK-ING d.o.o. signed a memorandum of understanding in October 2024 to establish a joint venture to develop fully European-origin unmanned and remotely controlled combat support vehicles, with an initial focus on developing an unmanned system for mine scattering and counter-mobility operations. The partnership is expected to present a system demonstrator in 2025 and position the joint venture as the market leader in unmanned ground systems for NATO and the broader European defense community.
Ukraine's ambitious plans to deploy 15,000 unmanned ground vehicles by the end of 2025 and localized manufacturing initiatives achieving 30% domestic production in mechanical clearance systems create substantial procurement opportunities for international suppliers and technology partners. The World Bank's estimate of USD 37 billion in required demining costs and multi-year clearing timelines establishes sustained demand for innovative solutions addressing cost reduction, productivity enhancement, and operator safety improvement.
Asia Pacific Post-Conflict Rehabilitation and Emerging Market Infrastructure Development
The Asia Pacific region represents the fastest-growing market opportunity for mechanical mines clearance systems, with 32.8% projected market share driven by extensive post-conflict demining requirements and expanding infrastructure development initiatives in mine-affected countries. Countries including India, Cambodia, Thailand, and Vietnam maintain active large-scale demining programs that address persistent landmine contamination, which threatens civilian populations, agricultural productivity, and economic development. India faces persistent landmine threats, particularly in border areas, where contaminated territories endanger civilian infrastructure and prevent productive land utilization, with government and private sector collaborations supporting domestic defense firm development of indigenous clearing solutions.
Regional manufacturers, including Komatsu Ltd., Mahindra Defense Systems, and emerging local suppliers, are increasingly developing and deploying mechanized clearance equipment adapted to regional soil conditions, vegetation types, and threat profiles. The region's manufacturing cost advantages enable the production of cost-optimized demining systems that meet humanitarian organization budget constraints while supporting employment generation in post-conflict recovery economies. Government infrastructure investment programs and international donor support for mine-affected countries are accelerating the expansion of technology procurement and deployment throughout the Asia-Pacific region.
Category-wise Insights
Product Type Analysis
Flails & Drum Cutters Establish Market Dominance Through Superior Versatility and Operational Effectiveness
Flails and drum cutters dominate the mechanical mine clearance market, accounting for approximately 57% of the market in 2025 due to their versatility and efficiency across diverse terrains. These systems use rotating drums with heavy chains that strike the ground to disrupt soil and trigger pressure-activated mines. Unlike rotary tillers, flails operate effectively in grasslands, forests, deserts, and rocky areas while handling obstacles such as trees or buildings. They can clear mines buried 10-20 cm deep, achieving daily coverage of 5,000-30,000 m² depending on configuration. Their proven track record in both military and humanitarian demining, coupled with technological maturity and operator familiarity, ensures continued market leadership throughout the forecast period.
Operation Mode Analysis
Manual Operation Systems Maintain Market Leadership Through Affordability and Accessibility in Resource-Constrained Environments
Manual operation systems lead the market with approximately 48% share in 2025, driven by low capital costs and accessibility in resource-limited regions. Manually operated equipment, including basic flails and tillers mounted on tractors, costs 60-80% less than remote or autonomous alternatives. Training requirements are minimal, enabling rapid deployment in areas lacking technical infrastructure. Modular designs allow swift procurement and use across multiple operational theaters. While remote-controlled systems are gaining traction in developed regions due to improved operator safety, manual systems remain essential for humanitarian programs in developing countries. This affordability and simplicity support sustained dominance in financially constrained operational environments throughout the forecast period.
Application Analysis
Humanitarian Demining Applications Command Market Focus Through International Donor Support and Casualty Reduction Imperatives
Humanitarian demining represents the largest application segment in 2025, propelled by global efforts to reduce landmine casualties and restore civilian access to contaminated areas. The UN and international organizations focus on clearing land for safe habitation, agriculture, and infrastructure, thereby distinguishing this from military operations. Countries such as Afghanistan, Cambodia, Zimbabwe, and Sudan face extensive mine contamination, creating ongoing equipment demand. International donors, including the UK, Germany, and the US, provide consistent funding, ensuring reliable demand for mechanical clearance systems. Longer operational timelines and sustained humanitarian programs support stable market growth, establishing humanitarian demining as the primary driver of mechanical mine-clearance equipment adoption over the forecast period.
Regional Insights
North America Mechanical Mine Clearance System Market Trends and Insights
North America maintains significant market presence with about 35% share through exceptional defense spending, technological innovation leadership, and robust investment in demining research and development through military institutions. The United States sustains the world's largest defense budget, allocating substantial resources toward mine countermeasure technologies and humanitarian demining partnerships supporting international operations across multiple continents, including Europe, Asia Pacific, and the Middle East.
The U.S. Department of Defense and the Army Humanitarian Demining Research and Development Program maintain sustained investment in advanced detection and clearance technologies, positioning the United States as the global epicenter of innovation for mechanical demining systems. Major original equipment manufacturers, including L3Harris Technologies and BAE Systems Inc., have established market leadership through continuous technological innovation, proprietary system designs, and comprehensive service support capabilities serving U.S. military and humanitarian organizations. The Army's Humanitarian Demining R&D Program has invested substantially in 95 different detection and clearance technologies deployed in 15 countries, directly supporting clearance operations of over 400,000 mines and unexploded ordnance across 44 countries with cumulative land rehabilitation exceeding 103 million square meters.
Europe Mechanical Mine Clearance System Market Trends and Insights
Europe dominates the global mechanical mines clearance system market through established manufacturing capabilities, substantial defense spending, and urgent post-conflict demining requirements, particularly concentrated in Ukraine and Southeastern European regions. European nations including Germany, United Kingdom, France, and Spain maintain advanced defense industrial bases supporting innovation in mechanical mine clearance systems, with Germany emerging as the technological and manufacturing leader through companies including Rheinmetall AG, one of the world's largest defense contractors.
Germany's comprehensive humanitarian demining commitment and technological leadership in remote-controlled systems and autonomous platforms have established the nation as the key market innovator, while the United Kingdom's Ministry of Defence has authorized procurement of advanced systems for Ukrainian Armed Forces equipping and support in 2024. Ukraine's intensive ongoing demining requirements, combined with EU-funded reconstruction initiatives and defense modernization support, are expected to sustain substantial equipment procurement demand supporting European manufacturer growth and technology advancement throughout the forecast period.
Asia Pacific Mechanical Mine Clearance System Market Trends and Insights
Asia Pacific represents the fastest-growing regional market for mechanical mines clearance systems, with 32.8% projected market share driven by extensive post-conflict demining requirements and accelerating infrastructure development initiatives throughout the region. China, India, Vietnam, Cambodia, and Thailand maintain large-scale demining operations addressing persistent landmine contamination threatening civilian livelihoods, agricultural productivity expansion, and sustainable economic development prospects.
India faces persistent landmine threats particularly in border regions where contaminated territories prevent productive land utilization and infrastructure development, driving strategic focus on domestic defense firm collaboration supporting indigenous mine clearance solutions development. Vietnam's ongoing demining programs addressing residual unexploded ordnance from historical conflicts continue generating substantial equipment procurement demand. Southeast Asian nations including Thailand, Malaysia, Singapore, and Indonesia are expanding healthcare and economic development initiatives requiring cleared, secured land, creating emerging market opportunities for cost-optimized demining systems adapted to regional requirements and budget constraints.
Competitive Landscape
The mechanical mine clearance system market exhibits a moderately consolidated structure, with a few specialized manufacturers controlling a significant portion of global share through proprietary technologies and established distribution networks. Simultaneously, the market shows notable fragmentation as smaller regional and emerging players offer tailored solutions for specific geographic and operational needs. Competitive strategies focus on advancing autonomous and remote-controlled systems, integrating AI technologies, and enhancing operator safety and clearance productivity.
Partnerships and collaborations are increasingly used to consolidate market presence, streamline R&D, and expand regional footprint, particularly in Europe. Localization efforts in certain countries are reshaping competitive dynamics by enabling cost-effective production and supply of customized mechanical clearance systems for domestic and regional markets. Overall, the market balance between established global players leveraging technological leadership and agile regional manufacturers pursuing niche applications creates a dynamic competitive environment that is expected to evolve with growing emphasis on automation, safety, and operational efficiency.
Key Developments:
- October 2024: Rheinmetall AG and DOK-ING d.o.o. announced accelerated development timeline for unmanned mine-clearing vehicle platform, incorporating autonomous navigation, real-time environmental sensing, and remote operation capabilities designed to substantially reduce operator exposure while maintaining clearance effectiveness across challenging terrain.
- September 2024: Croatia formally transferred robotic mine clearance system to Ukraine during Globsec international conference in Prague, establishing framework for ongoing technical cooperation and demining expertise sharing between the two nations to support Ukraine’s accelerated clearance operations.
Companies Covered in Mechanical Mine Clearance System Market
- Armtrac Limited
- Cefa Sas
- DOK-ING d.o.o.
- FAE Group
- Hydrema Holding ApS
- Pearson Engineering
- ScanJack AB
- Scopex
- Way Industries
- Westminster Group Plc
- MineWolf Systems AG
- Aardvark Clear Mine Ltd.
- Rheinmetall AG
- Digger DTR - Demining Technologies
- Hitachi Construction Machinery
- Komatsu Limited
- Mahindra Defence Systems
- Bharat Electronics Limited
- ECA GROUP
- Milrem Robotics
Frequently Asked Questions
The market is expected to reach US$ 89.6 million in 2026, up from US$ 71.2 million in 2020, driven by humanitarian demining needs and sustained government funding.
Key drivers include the global landmine burden exceeding 110 million mines, rising casualties in conflict zones, government defense spending, international donor funding, and technology advancements.
Europe and North America dominate the market due to strong manufacturer presence, advanced technologies, mature regulations, and substantial international demining funding.
Major opportunities lie in autonomous and AI-enabled clearance systems and long-term post-conflict rehabilitation programs across emerging regions.
Leading market players Rheinmetall AG, Pearson Engineering, DOK-ING d.o.o., Armtrac Limited, Hydrema Holding ApS, MineWolf Systems AG, Hitachi Construction Machinery and Komatsu Limited, and Mahindra Defence Systems.


