


- Industrial Machinery
- Liquid Filling Machines Market
Liquid Filling Machines Market Size, Share, and Growth Forecast, 2026 - 2033
Liquid Filling Machines Market by Function Type (Automatic and Semi-automatic), by Filling Capacity (Upto 50 ml, 51 to 250 ml, 251 to 1000 ml and Above 1000 ml), Product Type (Glass, Plastics, Tetra Pack and Cardboards and Others), (Dominating Segment- Plastics - 32.1% and Fastest Growing - 251 to 1000 ml), Filling Type (Vacuum Filling, Volumetric Filling, Weigh Filling and Others), End-user, and Regional Analysis for 2026 - 2033
Liquid Filling Machines Market Size and Trends Analysis
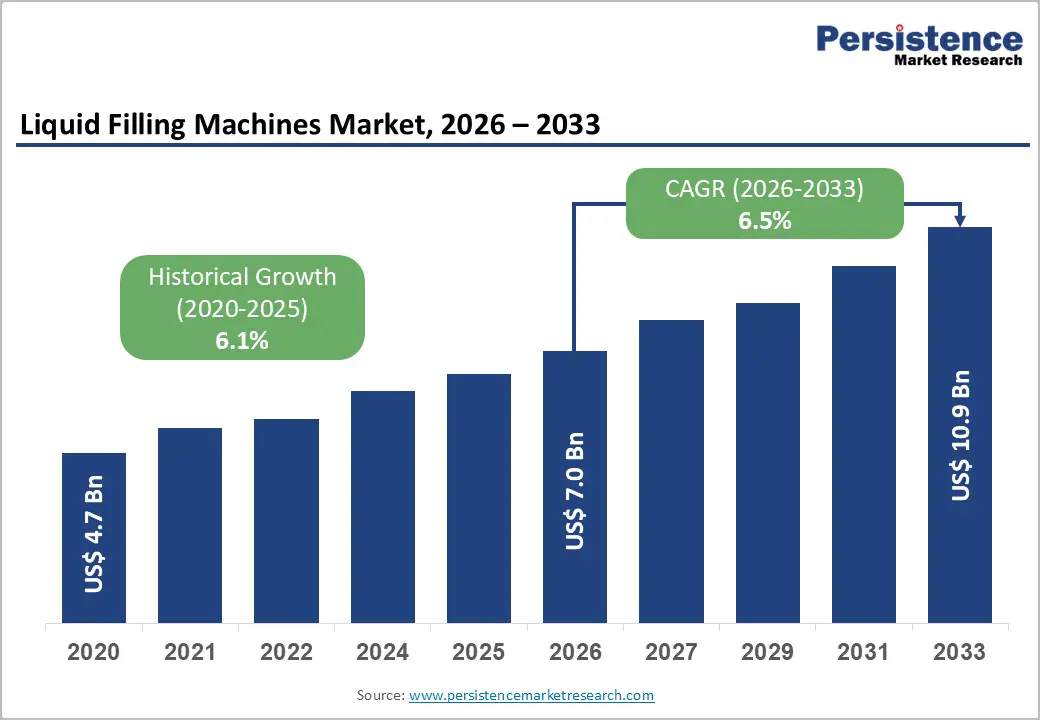
The global liquid filling machines market size is likely to be valued at US$ 7.0 billion in 2026 and is projected to reach US$ 10.9 billion by 2033, growing at a CAGR of 6.5% between 2026 and 2033.
The market is driven by a transition from manual to automated filling systems, improving speed and accuracy, Industry 4.0 implementation enabling real-time monitoring and control, and the expansion of packaged consumer goods consumption in emerging markets.
Key Industry Highlights:
- Leading Filling Capacity: 51-250 ml segment dominates with 43.2% market share addressing beverage and pharmaceutical applications; Above 1000 ml represents fastest growing at 9% CAGR, driven by industrial and bulk packaging expansion.
- Dominant Product Type: Plastics command 32.1% market share through cost efficiency advantages; Tetra Pack and Cardboard represent fastest growing at 12% CAGR, driven by sustainability mandate acceleration.
- Primary Filling Technology: Volumetric filling holds 36.4% market share, reflecting technology maturity and cost-effectiveness; Weigh filling is the fastest-growing at a 10% CAGR, driven by precision requirements and waste-reduction economics.
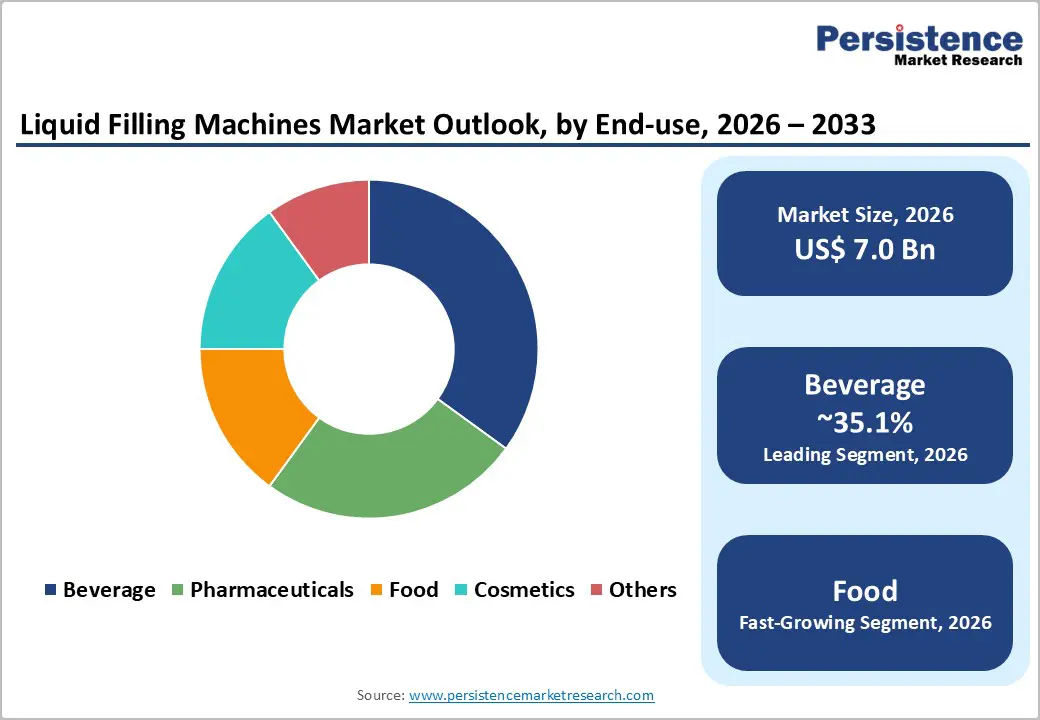
- Leading Industry: Beverage dominates with 35.1% market share, reflecting production scale and automation leadership; the Food sector represents the fastest growing at 8% CAGR, driven by emerging market food manufacturing expansion.
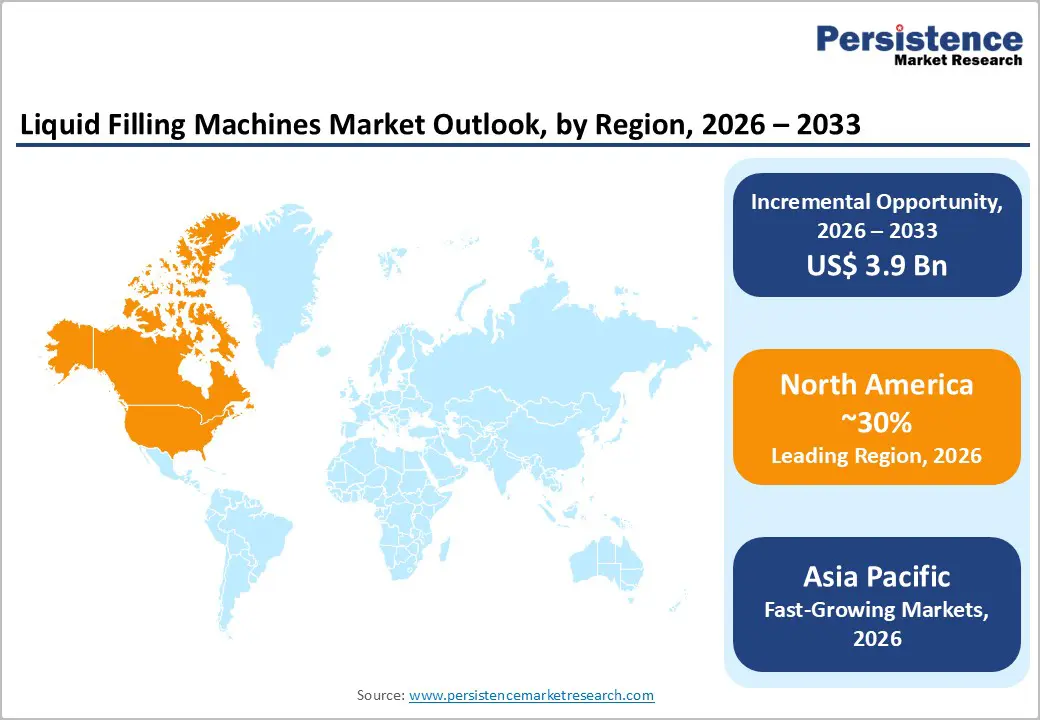
- Regional Market Dominance and Growth: North America maintains 30% global market share driven by pharmaceutical manufacturing and cannabis industry expansion; Asia Pacific demonstrates fastest regional growth at 12% CAGR, expanding from 30% current share to 38% by 2033 through manufacturing infrastructure expansion.
- Technology and Investment Momentum: Top 10 suppliers control 55% market share (Krones, GEA, Tetra Pak leading); AI/ML integration advancing quality control accuracy to 99.8%; Sustainability-focused filling technology development establishing market differentiation; Emerging Asian manufacturers establishing 20% cost advantages, creating competitive pricing pressure on established suppliers.
| Key Insights | Details |
|---|---|
| Liquid Filling Machines Market Size (2026E) | US$ 7.0 Bn |
| Market Value Forecast (2033F) | US$ 10.9 Bn |
| Projected Growth (CAGR 2026 to 2033) | 6.5% |
| Historical Market Growth (CAGR 2020 to 2024) | 6.1% |
Market Dynamics
Drivers - Food and Beverage Industry Expansion and Production Volume Scaling
Global packaged beverages consumption has expanded exponentially, with industry revenues reaching US$ 1.8-2.0 trillion annually and growing 5% year-over-year through 2033 forecast period. Production volume scaling, with beverage manufacturers operating 500,000+ production facilities globally producing 500+ billion liters annually, establishes substantial filling machine demand. E-commerce expansion, with online beverage sales representing 15-20% of total beverage retail and growing 20% annually, drives packaged product demand requiring efficient filling infrastructure.
Emerging market consumption growth, with the middle-income demographics in Asia Pacific expanding to 1.5+ billion consumers and driving packaged beverage consumption 15-20% annually, establishes proportionate filling capacity requirements. Brand differentiation trends, with manufacturers producing 100+ SKUs per category, creating frequent product changeovers, and driving demand for flexible multi-format filling machines.
Pharmaceutical and Cosmetic Industry Automation and Regulatory Compliance Requirements
Pharmaceutical production expansion, with the global pharmaceutical market valued at US$ 400-450 billion and growing 6.6% annually, establishes proportionate filling equipment demand. Healthcare supply chain complexity, with pharmaceutical distribution requiring strict dosage accuracy and contamination prevention, mandates advanced filling technology adoption. Regulatory compliance escalation, with FDA, EMA, and regional pharmaceutical authorities establishing increasingly stringent Good Manufacturing Practice (GMP) requirements, creates mandatory filling machine upgrades.
Cosmetic industry growth, with global cosmetics market valued at US$ 400+ billion and growing 8.1% annually, drives sophisticated filling machine demand for diverse product viscosities. Quality assurance requirements, with pharmaceutical and cosmetic manufacturers operating testing protocols requiring 99.9%+ filling accuracy, mandate precision filling technology adoption. Supply chain resilience, with pharmaceutical manufacturers establishing regional manufacturing hubs to address supply chain vulnerabilities, creates new opportunities for filling machine installation.
Restraints - High Capital Investment Requirements and Equipment Maintenance Complexity
Automatic filling machine investment barriers, with entry-level systems requiring US$ 100,000-500,000+ capital investment and advanced multi-head systems exceeding US$ 2,000,000, constrain SME adoption. The complexity of production line integration, requiring specialized engineering expertise and 3-6-month installation timelines, creates implementation barriers and delays. Maintenance cost escalation, with preventive maintenance requirements consuming 10-15% of equipment acquisition cost annually, increases the total cost of ownership. Spare parts availability challenges, with specialized components requiring 8-12-week lead times and constrained supply during semiconductor shortages, create operational disruptions. Training and skill requirements, including specialized technician training that can take 6-12 months and command premium compensation, limit local support availability in emerging markets.
Supply Chain Volatility and Component Sourcing Constraints
Semiconductor component shortages, with critical microcontroller and sensor production concentrated among limited suppliers, create 6-12-month procurement delays. Steel and aluminum price volatility, with raw material costs fluctuating 20-30% quarterly impacting equipment margins and pricing predictability. Geopolitical supply chain risks, including Taiwan's production of 60%+ of advanced semiconductors and US-China tensions that create trade uncertainties, constrain component sourcing. Skilled labor shortages, with specialized engineers and technicians in critically short supply, commanding premium compensation, increase manufacturing costs. Container material supply constraints, with diverse packaging material sourcing (glass, plastic, carton, metal) requiring multiple suppliers, create supply chain fragmentation. Logistical complexity, with oversized equipment requiring specialized transportation and installation expertise, increases supply chain costs.
Opportunity - Emerging Market Manufacturing Infrastructure Expansion and Localized Production
Emerging market manufacturing investment, with China, India, Vietnam, and Indonesia collectively attracting US$ 100-150 billion annually in manufacturing facility investments, establishes proportionate filling machine demand. Government manufacturing incentives, such as "Make in India," "Made in China 2025," and similar programs, that provide subsidies and tax incentives for industrial equipment reduce customer acquisition costs. Export-oriented manufacturing growth, with developing nations establishing regional manufacturing hubs for global brand operations, drives procurement of filling equipment.
Packaged beverage consumption growth, with per-capita packaged beverage consumption in emerging markets growing 15-20% annually as incomes rise, establish growing demand. Local manufacturing capacity, with regional filling machine manufacturers in the Asia Pacific offering 20-30% cost advantages versus established Western suppliers, creates competitive alternatives.
Sustainable Packaging and Eco-Friendly Filling Technology Solutions
Sustainability mandate expansion, with 60%+ of major consumer brands committing to 100% recyclable packaging by 2030, drives demand for alternative packaging material filling machines. Adoption of biodegradable packaging materials, with compostable and plant-based packaging materials growing 20-25% annually, requires specialized filling equipment tailored to their unique material characteristics. Circular economy initiatives, with mandatory packaging-recycling content requirements in the EU, China, and North America that reach 50-75% by 2030, drive the redesign of filling machines.
Energy-efficiency mandates, which increasingly require 30-40% energy reductions in manufacturing processes, create demand for energy-optimized filling equipment. Waste reduction requirements, with corporate targets establishing zero-waste-to-landfill objectives, drive adoption of filling technologies, reducing product spillage and material waste.
Segmentation Analysis
Filling Capacity Analysis
The 51-250 ml capacity segment holds 43.2% market share, driven by its wide applicability across beverages, pharmaceuticals, and personal care products. Use cases span energy drinks (250 ml), juices (100-200 ml), pharmaceutical bottles (50-100 ml), and cosmetics (50-250 ml), creating a broad addressable market. Rising on-the-go consumption supports sustained demand for small-to-medium pack sizes. From an operational perspective, this range enables 1,000-3,000 units/hour throughput using modular multi-head systems, balancing flexibility and efficiency.
In contrast, the above-1000 ml segment is the fastest growing, expanding at 9-12% CAGR through 2033. Growth is driven by bulk packaging demand in cooking oils, lubricants, industrial chemicals, food service, agriculture, and family-size beverages, reflecting accelerating industrial and institutional consumption trends.
Product Type Insights
Plastic container filling accounts for 32.1% share, driven by cost efficiency and advantages of lightweight. PET bottles dominate, representing 60-65% of plastic beverage packaging and growing at 6-8% annually, while polyethylene (PE) and polypropylene (PP) applications expand at 8-10% CAGR. Plastic containers offer a 20-30% cost advantage over glass and reduce transportation weight by 70-80%, significantly improving supply-chain economics.
In contrast, Tetra Pack and cardboard packaging is the fastest-growing segment, projected to expand at 11-14% CAGR through 2033. Growth is driven by accelerating consumer preference for paper-based packaging, supportive environmental regulations, and advances in barrier coatings that deliver aluminum-equivalent protection and 12+ month shelf life. Expanded regional manufacturing capacity further enhances scalability and commercial viability.
Filling Type Insights
Volumetric filling technology holds 36.4% market share, supported by technology maturity and cost efficiency. Flow-meter and piston-based systems dominate, with around 60% of beverage filling machines using piston fillers. These systems achieve ±0.5-1.0% accuracy, sufficient for most commercial applications, while enabling 1,500-3,500 containers/hour throughput. Compatibility with free-flowing and semi-viscous liquids, from water to oils, broadens applicability. Lower total cost of ownership, typically 25% less than gravimetric systems, underpins widespread industrial adoption, reinforcing volumetric filling’s dominance.
Conversely, weigh-filling technology is the fastest-growing segment, projected to expand at a 10% CAGR through 2033. Gravimetric systems deliver ±0.25% accuracy, reduce product waste by 15-20%, and meet tightening regulatory requirements. Superior handling of high-viscosity products, Industry 4.0 integration through smart sensors, and demand from pharmaceuticals, cosmetics, and specialty foods are driving accelerated adoption in premium applications.
Industry Insights
The beverage sector holds 35.1% market share, driven by massive global production scale and early adoption of automation. Global beverage output exceeds 500 billion liters annually, growing at 5.5%, creating sustained demand for high-capacity filling systems. The sector leads in high-speed automation, with filling lines achieving 1,500-3,500 units/hour. Broad product diversity, including water, carbonated drinks, juices, energy drinks, and ready-to-drink coffee drives continuous equipment innovation. Strong export activity, with revenues above US$200 billion and rising by 8-10% annually, alongside intense competition among 500+ major brands, is accelerating investment in advanced, high-precision filling solutions.
The food sector is the fastest-growing end-use segment, expanding at 8.4% CAGR through 2033. Growth is fueled by rising packaged food consumption, the rapid expansion of liquid foods such as sauces and oils, emerging-market manufacturing hubs, increasing processed food exports, the adoption of cold-fill technology, and sustainability-driven demand for precision filling to reduce product waste.
Regional Insights
North America Liquid Filling Machines Market Insights
North America commands approximately 30% of the global market share, valued at approximately US$ 2.1 billion in 2026 with projections approaching US$ 3.4 billion by 2033. The United States represents the dominant regional market contributor, accounting for 85% of North American market value, driven by advanced beverage and pharmaceutical manufacturing infrastructure.
Pharmaceutical manufacturing leadership, with US biopharmaceutical and pharmaceutical production valued at US$ 600+ billion and growing 6% annually, establishes primary regional advantage. Cannabis industry legalization, with 37 US states legalizing cannabis for medical and recreational purposes, creating demand for specialized liquid filling equipment for cannabis-infused beverages and tinctures estimated at US$ 500+ million market. Healthcare facility expansion, with US healthcare system expanding and requiring pharmaceutical production capacity growth, drives medical filling equipment demand.
Europe Liquid Filling Machines Market Insights
Europe represents approximately 24% of the global liquid filling machines market, valued at approximately US$ 1.68 billion in 2026. Germany, Italy, France, and Spain collectively represent 72% of European market value, reflecting established equipment manufacturing presence and precision engineering expertise.
Manufacturing excellence tradition, with Germany's packaging machinery sector leading technological innovation and establishing 500+ specialized manufacturers. Sustainability mandate leadership, with EU circular economy directives requiring 55% recycled content packaging by 2030, driving innovative filling equipment development. Pharmaceutical manufacturing concentration, with European pharmaceutical production valued at US$ 200+ billion annually, establish regional competitive advantage.
Asia Pacific Liquid Filling Machines Market Insights
Asia Pacific demonstrates robust growth dynamics, commanding approximately 25% market share with projections increasing to 35% by 2033. The regional growth valued at approximately US$ 2.1 billion in 2026 is anticipated to reach US$ 4.8 billion by 2033, representing the fastest-growing regional market with an estimated CAGR of 12%.
Manufacturing infrastructure expansion, with China, India, Vietnam, and Thailand attracting 100-150 billion annually in manufacturing investments, drives filling equipment procurement. Beverage industry scaling, with Asian beverage production and consumption growing 8-12% annually, establishes proportionate filling capacity requirements. Pharmaceutical manufacturing growth, with India and China establishing dominance in pharmaceutical manufacturing and serving 40% of global markets, drives demand for specialized equipment. Export-oriented manufacturing, with manufacturers establishing regional production hubs for global brands, requires filling equipment investments.
Competitive Landscape
The global liquid filling machines industry is highly competitive owing to the presence of several large- and small-scale companies. The field of automatic bottle filler machines is characterized by a mix of established players and emerging companies offering a wide range of filling technologies tailored to various industries. These include beverages, food, pharmaceuticals, and chemicals.
Key market players also focus on innovation, with an emphasis on automation, precision, and efficiency. They mainly aim to meet the increasing demand for high-volume, superior-quality filling solutions.
Key Industry Developments:
- In March 2024, KHS GmbH introduced new Plasmax, a coating technology, which manufactures tech-advanced filler machines. The benefits associated with this technology include higher output, better production efficiency, low energy consumption, flexibility, low maintenance cost, and extended durability. It has a filling capacity of around 48,000 PET bottles per hour.
- In February 2024, Ampack, a subsidiary of Syntegon Technology GmbH, introduced a new FBL filling machine for PP, HDPE, and PET bottles. It is used to fill products such as dairy products, soups, milk and plant-based drinks. This machine can fill bottles between 50 ml and 1,500 ml efficiently, with a production capacity of 36,000 bottles per hour.
Companies Covered in Liquid Filling Machines Market
- Adelphi Group of Companies
- ATS Corporation
- GEA Group Aktiengesellschaft
- JBT Corporation
- KHS GmbH
- Krones AG
- ProMach Inc.
- Tetra Laval S.A.
- Syntegon
- Mitsubishi Heavy Industries Ltd.
- Filling Equipment Co. Inc.
- Others Key Players
Frequently Asked Questions
The liquid filling machines market is estimated to be valued at US$ 7.0 Bn in 2026.
The key demand drivers for the liquid filling machines market are Increasing consumption of bottled drinks (water, juices, dairy, sauces, etc.) and other liquid foods and growth in production of medicinal liquids, syrups, injectables, and vaccines.
In 2026, the North America is likely to dominate with an exceeding 30% revenue share in the global Liquid Filling Machines market.
Among the end- user, beverage holds the highest preference, capturing beyond 35.1% of the market revenue share in 2026, surpassing other End - user type.
The key players in liquid filling machines are Adelphi Group of Companies, ATS Corporation, JBT Corporation and KHS GmbH.


