


1. Executive Summary
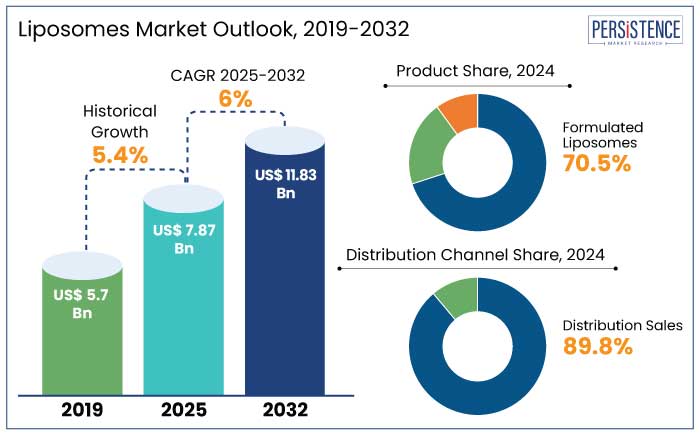
1.1. Global Liposomes Market Snapshot, 2025 and 2032
1.2. Market Opportunity Assessment, 2025 - 2032, US$ Mn
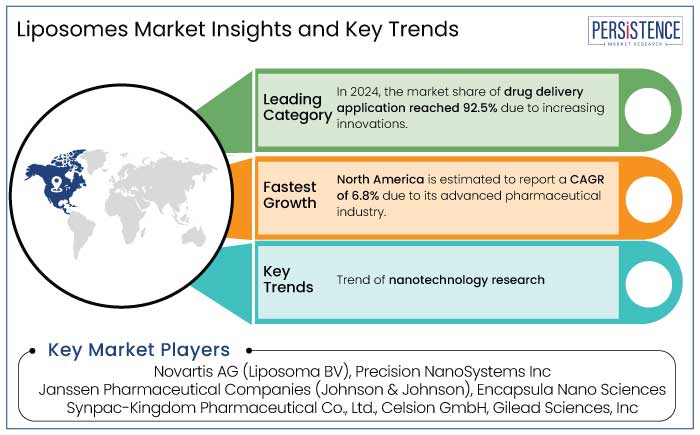
1.3. Key Market Trends
1.4. Future Market Projections
1.5. Premium Market Insights
1.6. Industry Developments and Key Market Events
1.7. PMR Analysis and Recommendations
2. Market Overview
2.1. Market Scope and Definition
2.2. Market Dynamics
2.2.1. Drivers
2.2.2. Restraints
2.2.3. Opportunity
2.2.4. Challenges
2.2.5. Key Trends
2.3. Macro-Economic Factors
2.3.1. Global Sectorial Outlook
2.3.2. Global GDP Growth Outlook
2.4. COVID-19 Impact Analysis
2.5. Forecast Factors - Relevance and Impact
3. Value Added Insights
3.1. Regulatory Landscape
3.2. Product Adoption Analysis
3.3. Value Chain Analysis
3.4. Key Deals and Mergers
3.5. PESTLE Analysis
3.6. Porter’s Five Force Analysis
4. Global Liposomes Market Outlook: Historical (2019 - 2024) and Forecast (2025 - 2032)
4.1. Key Highlights
4.1.1. Market Size (US$ Mn) and Y-o-Y Growth
4.1.2. Absolute $ Opportunity
4.2. Market Size (US$ Mn) Analysis and Forecast
4.2.1. Historical Market Size (US$ Mn) Analysis, 2019-2024
4.2.2. Current Market Size (US$ Mn) Analysis and Forecast, 2025-2032
4.3. Global Liposomes Market Outlook: Product
4.3.1. Introduction / Key Findings
4.3.2. Historical Market Size (US$ Mn) Analysis, By Product, 2019 - 2024
4.3.3. Current Market Size (US$ Mn) Analysis and Forecast, By Product, 2025 - 2032
4.3.3.1. Simple Liposomes
4.3.3.2. Formulated Liposomes
4.3.3.2.1. Doxorubicin Liposomes
4.3.3.2.2. Amphotericin B Liposomes
4.3.3.2.3. Paclitaxel Liposomes
4.3.3.2.4. Cytarabine Liposomes
4.3.3.2.5. Irinotecan Liposomes
4.3.3.2.6. Cisplatin Liposomes
4.3.3.2.7. Others
4.3.3.3. Vaccines
4.3.4. Market Attractiveness Analysis: Product
4.4. Global Liposomes Market Outlook: Application
4.4.1. Introduction / Key Findings
4.4.2. Historical Market Size (US$ Mn) Analysis, By Application, 2019 - 2024
4.4.3. Current Market Size (US$ Mn) Analysis and Forecast, By Application, 2025 - 2032
4.4.3.1. Retail Sales
4.4.3.1.1. Academic & Research Laboratories
4.4.3.1.2. Biopharmaceutical Companies
4.4.3.1.3. Clinical Research Organizations
4.4.3.1.4. Others
4.4.3.2. Distribution Sales
4.4.3.2.1. Hospital Pharmacies
4.4.3.2.2. Retail Pharmacies
4.4.3.2.3. Mail Order Pharmacies
4.4.3.2.4. Drug Stores
4.4.4. Market Attractiveness Analysis: Application
4.5. Global Liposomes Market Outlook: Distribution Channel
4.5.1. Introduction / Key Findings
4.5.2. Historical Market Size (US$ Mn) Analysis, By Distribution Channel, 2019 - 2024
4.5.3. Current Market Size (US$ Mn) Analysis and Forecast, By Distribution Channel, 2025 - 2032
4.5.3.1. Oral
4.5.3.2. Injectable
4.5.3.3. Others
4.5.4. Market Attractiveness Analysis: Distribution Channel
5. Global Liposomes Market Outlook: Region
5.1. Key Highlights
5.2. Historical Market Size (US$ Mn) Analysis, By Region, 2019 - 2024
5.3. Current Market Size (US$ Mn) Analysis and Forecast, By Region, 2025 - 2032
5.3.1. North America
5.3.2. Europe
5.3.3. East Asia
5.3.4. South Asia and Oceania
5.3.5. Latin America
5.3.6. Middle East & Africa
5.4. Market Attractiveness Analysis: Region
6. North America Liposomes Market Outlook: Historical (2019 - 2024) and Forecast (2025 - 2032)
6.1. Key Highlights
6.2. Historical Market Size (US$ Mn) Analysis, By Market, 2019 - 2024
6.2.1. By Country
6.2.2. By Product
6.2.3. By Application
6.2.4. By Distribution Channel
6.3. Current Market Size (US$ Mn) Analysis and Forecast, By Country, 2025 - 2032
6.3.1. U.S.
6.3.2. Canada
6.4. Current Market Size (US$ Mn) Analysis and Forecast, By Product, 2025 - 2032
6.4.1. Simple Liposomes
6.4.2. Formulated Liposomes
6.4.2.1. Doxorubicin Liposomes
6.4.2.2. Amphotericin B Liposomes
6.4.2.3. Paclitaxel Liposomes
6.4.2.4. Cytarabine Liposomes
6.4.2.5. Irinotecan Liposomes
6.4.2.6. Cisplatin Liposomes
6.4.2.7. Others
6.4.3. Vaccines
6.5. Current Market Size (US$ Mn) Analysis and Forecast, By Application, 2025 - 2032
6.5.1. Drug delivery
6.5.1.1. Cancer
6.5.1.2. Fungal Infection
6.5.1.3. Viral & Parasite Infection
6.5.1.4. Others
6.5.2. Gene Delivery/Transfection
6.5.3. Contrast agents for medical imaging
6.5.4. Model Cell Membranes
6.6. Current Market Size (US$ Mn) Analysis and Forecast, By Distribution Channel, 2025 - 2032
6.6.1. Retail Sales
6.6.1.1. Academic & Research Laboratories
6.6.1.2. Biopharmaceutical Companies
6.6.1.3. Clinical Research Organizations
6.6.1.4. Others
6.6.2. Distribution Sales
6.6.2.1. Hospital Pharmacies
6.6.2.2. Retail Pharmacies
6.6.2.3. Mail Order Pharmacies
6.6.2.4. Drug Stores
6.7. Market Attractiveness Analysis
7. Europe Liposomes Market Outlook: Historical (2019 - 2024) and Forecast (2025 - 2032)
7.1. Key Highlights
7.2. Historical Market Size (US$ Mn) Analysis, By Market, 2019 - 2024
7.2.1. By Country
7.2.2. By Product
7.2.3. By Application
7.2.4. By Distribution Channel
7.3. Current Market Size (US$ Mn) Analysis and Forecast, By Country, 2025 - 2032
7.3.1. Germany
7.3.2. France
7.3.3. U.K.
7.3.4. Italy
7.3.5. Spain
7.3.6. Russia
7.3.7. Türkiye
7.3.8. Rest of Europe
7.4. Current Market Size (US$ Mn) Analysis and Forecast, By Product, 2025 - 2032
7.4.1. Simple Liposomes
7.4.2. Formulated Liposomes
7.4.2.1. Doxorubicin Liposomes
7.4.2.2. Amphotericin B Liposomes
7.4.2.3. Paclitaxel Liposomes
7.4.2.4. Cytarabine Liposomes
7.4.2.5. Irinotecan Liposomes
7.4.2.6. Cisplatin Liposomes
7.4.2.7. Others
7.4.3. Vaccines
7.5. Current Market Size (US$ Mn) Analysis and Forecast, By Application, 2025 - 2032
7.5.1. Drug delivery
7.5.1.1. Cancer
7.5.1.2. Fungal Infection
7.5.1.3. Viral & Parasite Infection
7.5.1.4. Others
7.5.2. Gene Delivery/Transfection
7.5.3. Contrast agents for medical imaging
7.5.4. Model Cell Membranes
7.6. Current Market Size (US$ Mn) Analysis and Forecast, By Distribution Channel, 2025 - 2032
7.6.1. Retail Sales
7.6.1.1. Academic & Research Laboratories
7.6.1.2. Biopharmaceutical Companies
7.6.1.3. Clinical Research Organizations
7.6.1.4. Others
7.6.2. Distribution Sales
7.6.2.1. Hospital Pharmacies
7.6.2.2. Retail Pharmacies
7.6.2.3. Mail Order Pharmacies
7.6.2.4. Drug Stores
7.7. Market Attractiveness Analysis
8. East Asia Liposomes Market Outlook: Historical (2019 - 2024) and Forecast (2025 - 2032)
8.1. Key Highlights
8.2. Historical Market Size (US$ Mn) Analysis, By Market, 2019 - 2024
8.2.1. By Country
8.2.2. By Product
8.2.3. By Application
8.2.4. By Distribution Channel
8.3. Current Market Size (US$ Mn) Analysis and Forecast, By Country, 2025 - 2032
8.3.1. China
8.3.2. Japan
8.3.3. South Korea
8.4. Current Market Size (US$ Mn) Analysis and Forecast, By Product, 2025 - 2032
8.4.1. Simple Liposomes
8.4.2. Formulated Liposomes
8.4.2.1. Doxorubicin Liposomes
8.4.2.2. Amphotericin B Liposomes
8.4.2.3. Paclitaxel Liposomes
8.4.2.4. Cytarabine Liposomes
8.4.2.5. Irinotecan Liposomes
8.4.2.6. Cisplatin Liposomes
8.4.2.7. Others
8.4.3. Vaccines
8.5. Current Market Size (US$ Mn) Analysis and Forecast, By Application, 2025 - 2032
8.5.1. Drug delivery
8.5.1.1. Cancer
8.5.1.2. Fungal Infection
8.5.1.3. Viral & Parasite Infection
8.5.1.4. Others
8.5.2. Gene Delivery/Transfection
8.5.3. Contrast agents for medical imaging
8.5.4. Model Cell Membranes
8.6. Current Market Size (US$ Mn) Analysis and Forecast, By Distribution Channel, 2025 - 2032
8.6.1. Retail Sales
8.6.1.1. Academic & Research Laboratories
8.6.1.2. Biopharmaceutical Companies
8.6.1.3. Clinical Research Organizations
8.6.1.4. Others
8.6.2. Distribution Sales
8.6.2.1. Hospital Pharmacies
8.6.2.2. Retail Pharmacies
8.6.2.3. Mail Order Pharmacies
8.6.2.4. Drug Stores
8.7. Market Attractiveness Analysis
9. South Asia & Oceania Liposomes Market Outlook: Historical (2019 - 2024) and Forecast (2025 - 2032)
9.1. Key Highlights
9.2. Historical Market Size (US$ Mn) Analysis, By Market, 2019 - 2024
9.2.1. By Country
9.2.2. By Product
9.2.3. By Application
9.2.4. By Distribution Channel
9.3. Current Market Size (US$ Mn) Analysis and Forecast, By Country, 2025 - 2032
9.3.1. India
9.3.2. Southeast Asia
9.3.3. ANZ
9.3.4. Rest of South Asia & Oceania
9.4. Current Market Size (US$ Mn) Analysis and Forecast, By Product, 2025 - 2032
9.4.1. Simple Liposomes
9.4.2. Formulated Liposomes
9.4.2.1. Doxorubicin Liposomes
9.4.2.2. Amphotericin B Liposomes
9.4.2.3. Paclitaxel Liposomes
9.4.2.4. Cytarabine Liposomes
9.4.2.5. Irinotecan Liposomes
9.4.2.6. Cisplatin Liposomes
9.4.2.7. Others
9.4.3. Vaccines
9.5. Current Market Size (US$ Mn) Analysis and Forecast, By Application, 2025 - 2032
9.5.1. Drug delivery
9.5.1.1. Cancer
9.5.1.2. Fungal Infection
9.5.1.3. Viral & Parasite Infection
9.5.1.4. Others
9.5.2. Gene Delivery/Transfection
9.5.3. Contrast agents for medical imaging
9.5.4. Model Cell Membranes
9.6. Current Market Size (US$ Mn) Analysis and Forecast, By Distribution Channel, 2025 - 2032
9.6.1. Retail Sales
9.6.1.1. Academic & Research Laboratories
9.6.1.2. Biopharmaceutical Companies
9.6.1.3. Clinical Research Organizations
9.6.1.4. Others
9.6.2. Distribution Sales
9.6.2.1. Hospital Pharmacies
9.6.2.2. Retail Pharmacies
9.6.2.3. Mail Order Pharmacies
9.6.2.4. Drug Stores
9.7. Market Attractiveness Analysis
10. Latin America Liposomes Market Outlook: Historical (2019 - 2024) and Forecast (2025 - 2032)
10.1. Key Highlights
10.2. Historical Market Size (US$ Mn) Analysis, By Market, 2019 - 2024
10.2.1. By Country
10.2.2. By Product
10.2.3. By Application
10.2.4. By Distribution Channel
10.3. Current Market Size (US$ Mn) Analysis and Forecast, By Country, 2025 - 2032
10.3.1. Brazil
10.3.2. Mexico
10.3.3. Rest of Latin America
10.4. Current Market Size (US$ Mn) Analysis and Forecast, By Product, 2025 - 2032
10.4.1. Simple Liposomes
10.4.2. Formulated Liposomes
10.4.2.1. Doxorubicin Liposomes
10.4.2.2. Amphotericin B Liposomes
10.4.2.3. Paclitaxel Liposomes
10.4.2.4. Cytarabine Liposomes
10.4.2.5. Irinotecan Liposomes
10.4.2.6. Cisplatin Liposomes
10.4.2.7. Others
10.4.3. Vaccines
10.5. Current Market Size (US$ Mn) Analysis and Forecast, By Application, 2025 - 2032
10.5.1. Drug delivery
10.5.1.1. Cancer
10.5.1.2. Fungal Infection
10.5.1.3. Viral & Parasite Infection
10.5.1.4. Others
10.5.2. Gene Delivery/Transfection
10.5.3. Contrast agents for medical imaging
10.5.4. Model Cell Membranes
10.6. Current Market Size (US$ Mn) Analysis and Forecast, By Distribution Channel, 2025 - 2032
10.6.1. Retail Sales
10.6.1.1. Academic & Research Laboratories
10.6.1.2. Biopharmaceutical Companies
10.6.1.3. Clinical Research Organizations
10.6.1.4. Others
10.6.2. Distribution Sales
10.6.2.1. Hospital Pharmacies
10.6.2.2. Retail Pharmacies
10.6.2.3. Mail Order Pharmacies
10.6.2.4. Drug Stores
10.7. Market Attractiveness Analysis
11. Middle East & Africa Liposomes Market Outlook: Historical (2019 - 2024) and Forecast (2025 - 2032)
11.1. Key Highlights
11.2. Historical Market Size (US$ Mn) Analysis, By Market, 2019 - 2024
11.2.1. By Country
11.2.2. By Product
11.2.3. By Application
11.2.4. By Distribution Channel
11.3. Current Market Size (US$ Mn) Analysis and Forecast, By Country, 2025 - 2032
11.3.1. GCC Countries
11.3.2. Egypt
11.3.3. South Africa
11.3.4. Northern Africa
11.3.5. Rest of Middle East & Africa
11.4. Current Market Size (US$ Mn) Analysis and Forecast, By Product, 2025 - 2032
11.4.1. Simple Liposomes
11.4.2. Formulated Liposomes
11.4.2.1. Doxorubicin Liposomes
11.4.2.2. Amphotericin B Liposomes
11.4.2.3. Paclitaxel Liposomes
11.4.2.4. Cytarabine Liposomes
11.4.2.5. Irinotecan Liposomes
11.4.2.6. Cisplatin Liposomes
11.4.2.7. Others
11.4.3. Vaccines
11.5. Current Market Size (US$ Mn) Analysis and Forecast, By Application, 2025 - 2032
11.5.1. Drug delivery
11.5.1.1. Cancer
11.5.1.2. Fungal Infection
11.5.1.3. Viral & Parasite Infection
11.5.1.4. Others
11.5.2. Gene Delivery/Transfection
11.5.3. Contrast agents for medical imaging
11.5.4. Model Cell Membranes
11.6. Current Market Size (US$ Mn) Analysis and Forecast, By Distribution Channel, 2025 - 2032
11.6.1. Retail Sales
11.6.1.1. Academic & Research Laboratories
11.6.1.2. Biopharmaceutical Companies
11.6.1.3. Clinical Research Organizations
11.6.1.4. Others
11.6.2. Distribution Sales
11.6.2.1. Hospital Pharmacies
11.6.2.2. Retail Pharmacies
11.6.2.3. Mail Order Pharmacies
11.6.2.4. Drug Stores
11.7. Market Attractiveness Analysis
12. Competition Landscape
12.1. Market Share Analysis, 2024
12.2. Market Structure
12.2.1. Competition Intensity Mapping By Market
12.2.2. Competition Dashboard
12.3. Company Profiles (Details - Overview, Financials, Strategy, Recent Developments)
12.3.1. Novartis AG (Liposoma BV)
12.3.1.1. Overview
12.3.1.2. Segments and Products
12.3.1.3. Key Financials
12.3.1.4. Market Developments
12.3.1.5. Market Strategy
12.3.2. Precision NanoSystems Inc
12.3.3. Janssen Pharmaceutical Companies (Johnson & Johnson)
12.3.4. Encapsula Nano Sciences
12.3.5. Synpac-Kingdom Pharmaceutical Co., Ltd
12.3.6. Celsion GmbH
12.3.7. Gilead Sciences, Inc
12.3.8. Pacira BioSciences, Inc.
12.3.9. Luye Pharma Group
12.3.10. Sun Pharma Industries Ltd
12.3.11. Shanghai New Asia Pharmaceutical Co., Ltd.
12.3.12. ENERGY DELIVERY SOLUTIONs
12.3.13. Creative Biolabs
12.3.14. Nanovex Biotechnologies SL
12.3.15. Insys Therapeutics Inc
12.3.16. Fujifilm Holdings Corporation
12.3.17. Virpax Pharmaceuticals
12.3.18. Azaya Therapeutics
12.3.19. Avanti Polar Lipids, Inc.
12.3.20. Breath Therapeutics (Zambon company)
12.3.21. Getwell
12.3.22. Taiwan Liposome Company Ltd
12.3.23. Fresenius Health Care Group
12.3.24. Xellia Pharmaceuticals (Novo Holdings A/S)
12.3.25. Jazz Pharmaceuticals plc
12.3.26. Ipsen Biopharmaceuticals, Inc.
12.3.27. Baxter
12.3.28. GMPriority Pharma
12.3.29. S. G. Biopharm Pvt. Ltd
13. Appendix
13.1. Research Methodology
13.2. Research Assumptions
13.3. Acronyms and Abbreviations

Loading page data
Please wait a moment


