


- Executive Summary
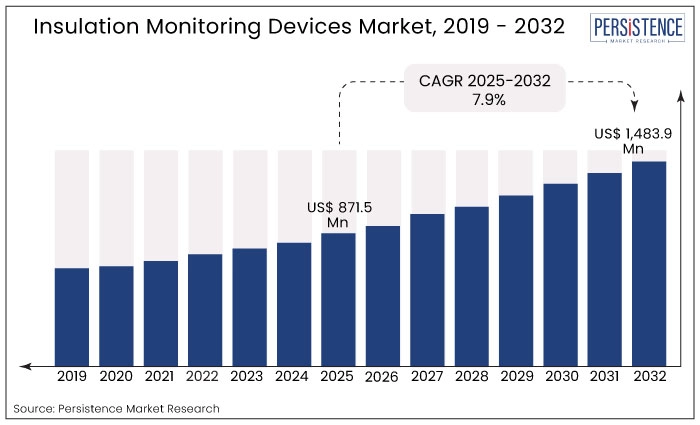
- Global Insulation Monitoring Devices Market Snapshot 2025 and 2032
- Market Opportunity Assessment, 2025-2032, US$ Mn
- Key Market Trends
- Industry Developments and Key Market Events
- Demand Side and Supply Side Analysis
- PMR Analysis and Recommendations
- Market Overview
- Market Scope and Definitions
- Value Chain Analysis
- Macro-Economic Factors
- Global GDP Outlook
- Global Construction Industry Overview
- Global Mining Industry Overview
- Forecast Factors – Relevance and Impact
- COVID-19 Impact Assessment
- PESTLE Analysis
- Porter's Five Forces Analysis
- Geopolitical Tensions: Market Impact
- Regulatory and Technology Landscape
- Market Dynamics
- Drivers
- Restraints
- Opportunities
- Trends
- Price Trend Analysis, 2019 – 2032
- Region-wise Price Analysis
- Price by Segments
- Price Impact Factors
- Global Insulation Monitoring Devices Market Outlook: Historical (2019 – 2024) and Forecast (2025 – 2032)
- Key Highlights
- Global Insulation Monitoring Devices Market Outlook: Type
- Introduction/Key Findings
- Historical Market Size (US$ Mn) Analysis by Type, 2019-2024
- Current Market Size (US$ Mn) Forecast, by Type, 2025-2032
- 1 Phase Insulation Monitoring Devices
- 3 Phase Insulation Monitoring Devices
- DC Insulation Monitoring Devices
- Market Attractiveness Analysis: Type
- Global Insulation Monitoring Devices Market Outlook: Application
- Introduction/Key Findings
- Historical Market Size (US$ Mn) Analysis by Application, 2019-2024
- Current Market Size (US$ Mn) Forecast, by Application, 2025-2032
- Power Utilities Industry
- Healthcare Industry
- Transportation Industry
- Mining Industry
- Factory Automation
- Market Attractiveness Analysis: Application
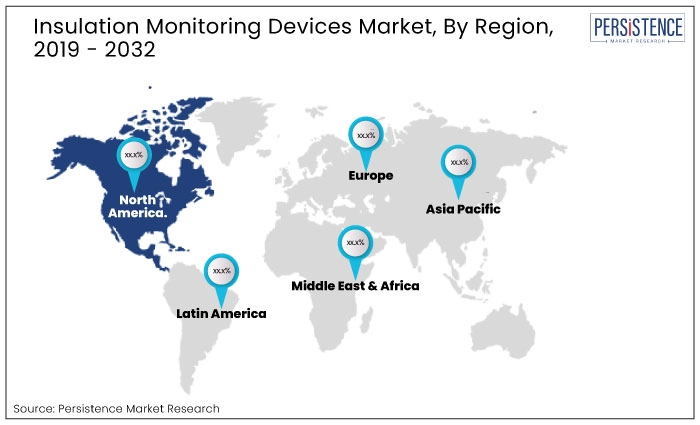
- Global Insulation Monitoring Devices Market Outlook: Region
- Key Highlights
- Historical Market Size (US$ Mn) Analysis by Region, 2019-2024
- Current Market Size (US$ Mn) Forecast, by Region, 2025-2032
- North America
- Europe
- East Asia
- South Asia & Oceania
- Latin America
- Middle East & Africa
- Market Attractiveness Analysis: Region
- North America Insulation Monitoring Devices Market Outlook: Historical (2019 – 2024) and Forecast (2025 – 2032)
- Key Highlights
- Pricing Analysis
- North America Market Size (US$ Mn) Forecast, by Country, 2025-2032
- U.S.
- Canada
- North America Market Size (US$ Mn) Forecast, by Type, 2025-2032
- 1 Phase Insulation Monitoring Devices
- 3 Phase Insulation Monitoring Devices
- DC Insulation Monitoring Devices
- North America Market Size (US$ Mn) Forecast, by Application, 2025-2032
- Power Utilities Industry
- Healthcare Industry
- Transportation Industry
- Mining Industry
- Factory Automation
- Europe Insulation Monitoring Devices Market Outlook: Historical (2019 – 2024) and Forecast (2025 – 2032)
- Key Highlights
- Pricing Analysis
- Europe Market Size (US$ Mn) Forecast, by Country, 2025-2032
- Germany
- Italy
- France
- U.K.
- Spain
- Russia
- Rest of Europe
- Europe Market Size (US$ Mn) Forecast, by Type, 2025-2032
- 1 Phase Insulation Monitoring Devices
- 3 Phase Insulation Monitoring Devices
- DC Insulation Monitoring Devices
- Europe Market Size (US$ Mn) Forecast, by Application, 2025-2032
- Power Utilities Industry
- Healthcare Industry
- Transportation Industry
- Mining Industry
- Factory Automation
- East Asia Insulation Monitoring Devices Market Outlook: Historical (2019 – 2024) and Forecast (2025 – 2032)
- Key Highlights
- Pricing Analysis
- East Asia Market Size (US$ Mn) Forecast, by Country, 2025-2032
- China
- Japan
- South Korea
- East Asia Market Size (US$ Mn) Forecast, by Type, 2025-2032
- 1 Phase Insulation Monitoring Devices
- 3 Phase Insulation Monitoring Devices
- DC Insulation Monitoring Devices
- East Asia Market Size (US$ Mn) Forecast, by Application, 2025-2032
- Power Utilities Industry
- Healthcare Industry
- Transportation Industry
- Mining Industry
- Factory Automation
- South Asia & Oceania Insulation Monitoring Devices Market Outlook: Historical (2019 – 2024) and Forecast (2025 – 2032)
- Key Highlights
- Pricing Analysis
- South Asia & Oceania Market Size (US$ Mn) Forecast, by Country, 2025-2032
- India
- Southeast Asia
- ANZ
- Rest of SAO
- South Asia & Oceania Market Size (US$ Mn) Forecast, by Type, 2025-2032
- 1 Phase Insulation Monitoring Devices
- 3 Phase Insulation Monitoring Devices
- DC Insulation Monitoring Devices
- South Asia & Oceania Market Size (US$ Mn) Forecast, by Application, 2025-2032
- Power Utilities Industry
- Healthcare Industry
- Transportation Industry
- Mining Industry
- Factory Automation
- Latin America Insulation Monitoring Devices Market Outlook: Historical (2019 – 2024) and Forecast (2025 – 2032)
- Key Highlights
- Pricing Analysis
- Latin America Market Size (US$ Mn) Forecast, by Country, 2025-2032
- Brazil
- Mexico
- Rest of LATAM
- Latin America Market Size (US$ Mn) Forecast, by Type, 2025-2032
- 1 Phase Insulation Monitoring Devices
- 3 Phase Insulation Monitoring Devices
- DC Insulation Monitoring Devices
- Latin America Market Size (US$ Mn) Forecast, by Application, 2025-2032
- Power Utilities Industry
- Healthcare Industry
- Transportation Industry
- Mining Industry
- Factory Automation
- Middle East & Africa Insulation Monitoring Devices Market Outlook: Historical (2019 – 2024) and Forecast (2025 – 2032)
- Key Highlights
- Pricing Analysis
- Middle East & Africa Market Size (US$ Mn) Forecast, by Country, 2025-2032
- GCC Countries
- South Africa
- Northern Africa
- Rest of MEA
- Middle East & Africa Market Size (US$ Mn) Forecast, by Type, 2025-2032
- 1 Phase Insulation Monitoring Devices
- 3 Phase Insulation Monitoring Devices
- DC Insulation Monitoring Devices
- Middle East & Africa Market Size (US$ Mn) Forecast, by Application, 2025-2032
- Power Utilities Industry
- Healthcare Industry
- Transportation Industry
- Mining Industry
- Factory Automation
- Competition Landscape
- Market Share Analysis, 2024
- Market Structure
- Competition Intensity Mapping
- Competition Dashboard
- Company Profiles
- ABB
- Company Overview
- Product Portfolio/Offerings
- Key Financials
- SWOT Analysis
- Company Strategy and Key Developments
- Eaton
- Littelfuse
- Mitsubishi Electric
- Schneider Electric
- Bender
- Cirprotec
- Dold
- Hakel
- Martens
- Megacon
- PPO Elektroniikka
- Siemens
- TRAFOX
- ABB
- Appendix
- Research Methodology
- Research Assumptions
- Acronyms and Abbreviations

Loading page data
Please wait a moment


