


- Executive Summary
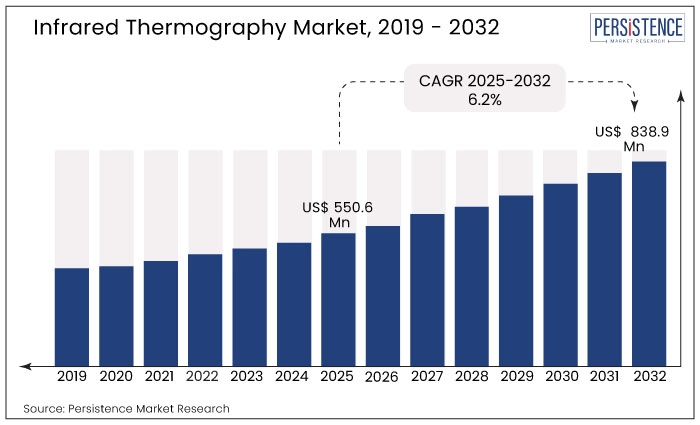
- Global Infrared Thermography Market Snapshot 2025 and 2032
- Market Opportunity Assessment, 2025-2032, US$ Mn
- Key Market Trends
- Industry Developments and Key Market Events
- Demand Side and Supply Side Analysis
- PMR Analysis and Recommendations
- Market Overview
- Market Scope and Definitions
- Value Chain Analysis
- Macro-Economic Factors
- Global GDP Outlook
- Global GDP Outlook
- Global economic Growth Forecast
- Global Urbanization Growth
- Other Macro-economic Factors
- Forecast Factors – Relevance and Impact
- COVID-19 Impact Assessment
- PESTLE Analysis
- Porter's Five Forces Analysis
- Geopolitical Tensions: Market Impact
- Regulatory and Technology Landscape
- Market Dynamics
- Drivers
- Restraints
- Opportunities
- Trends
- Price Trend Analysis, 2019 – 2032
- Region-wise Price Analysis
- Price by Segments
- Price Impact Factors
- Global Infrared Thermography Market Outlook: Historical (2019 – 2024) and Forecast (2025 – 2032)
- Key Highlights
- Global Infrared Thermography Market Outlook: Technology
- Introduction/Key Findings
- Historical Market Size (US$ Mn) Analysis by Technology, 2019-2024
- Current Market Size (US$ Mn) Forecast, by Technology, 2025-2032
- Active IR Thermography
- Passive IR Thermography
- Market Attractiveness Analysis: Technology
- Global Infrared Thermography Market Outlook: Subsector
- Introduction/Key Findings
- Historical Market Size (US$ Mn) Analysis by Subsector, 2019-2024
- Current Market Size (US$ Mn) Forecast, by Subsector, 2025-2032
- Commercial
- Residential
- Defence
- Market Attractiveness Analysis: Subsector
- Global Infrared Thermography Market Outlook: Thermometer Type
- Introduction/Key Findings
- Historical Market Size (US$ Mn) Analysis by Thermometer Type, 2019-2024
- Current Market Size (US$ Mn) Forecast, by Thermometer Type, 2025-2032
- Spot Infrared Thermometer
- Infrared Scanner Systems
- Infrared Thermal Imaging Cameras
- Market Attractiveness Analysis: Thermometer Type
- Global Infrared Thermography Market Outlook: Application
- Introduction/Key Findings
- Historical Market Size (US$ Mn) Analysis by Application, 2019-2024
- Current Market Size (US$ Mn) Forecast, by Application, 2025-2032
- Transportation
- Unmanned Systems
- Building Technology
- Market Attractiveness Analysis: Application
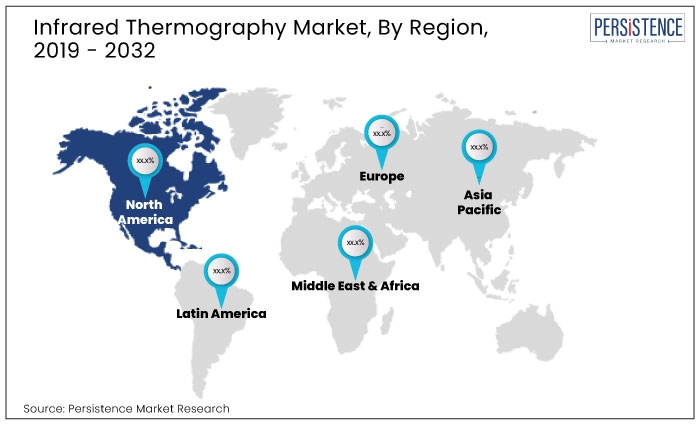
- Global Infrared Thermography Market Outlook: Region
- Key Highlights
- Historical Market Size (US$ Mn) Analysis by Region, 2019-2024
- Current Market Size (US$ Mn) Forecast, by Region, 2025-2032
- North America
- Europe
- East Asia
- South Asia & Oceania
- Latin America
- Middle East & Africa
- Market Attractiveness Analysis: Region
- North America Infrared Thermography Market Outlook: Historical (2019 – 2024) and Forecast (2025 – 2032)
- Key Highlights
- Pricing Analysis
- North America Market Size (US$ Mn) Forecast, by Country, 2025-2032
- U.S.
- Canada
- North America Market Size (US$ Mn) Forecast, by Technology, 2025-2032
- Active IR Thermography
- Passive IR Thermography
- North America Market Size (US$ Mn) Forecast, by Subsector, 2025-2032
- Commercial
- Residential
- Defence
- North America Market Size (US$ Mn) Forecast, by Thermometer Type, 2025-2032
- Spot Infrared Thermometer
- Infrared Scanner Systems
- Infrared Thermal Imaging Cameras
- North America Market Size (US$ Mn) Forecast, by Application, 2025-2032
- Transportation
- Unmanned Systems
- Building Technology
- Europe Infrared Thermography Market Outlook: Historical (2019 – 2024) and Forecast (2025 – 2032)
- Key Highlights
- Pricing Analysis
- Europe Market Size (US$ Mn) Forecast, by Country, 2025-2032
- Germany
- Italy
- France
- U.K.
- Spain
- Russia
- Rest of Europe
- Europe Market Size (US$ Mn) Forecast, by Technology, 2025-2032
- Active IR Thermography
- Passive IR Thermography
- Europe Market Size (US$ Mn) Forecast, by Subsector, 2025-2032
- Commercial
- Residential
- Defence
- Europe Market Size (US$ Mn) Forecast, by Thermometer Type, 2025-2032
- Spot Infrared Thermometer
- Infrared Scanner Systems
- Infrared Thermal Imaging Cameras
- Europe Market Size (US$ Mn) Forecast, by Application, 2025-2032
- Transportation
- Unmanned Systems
- Building Technology
- East Asia Infrared Thermography Market Outlook: Historical (2019 – 2024) and Forecast (2025 – 2032)
- Key Highlights
- Pricing Analysis
- East Asia Market Size (US$ Mn) Forecast, by Country, 2025-2032
- China
- Japan
- South Korea
- East Asia Market Size (US$ Mn) Forecast, by Technology, 2025-2032
- Active IR Thermography
- Passive IR Thermography
- East Asia Market Size (US$ Mn) Forecast, by Subsector, 2025-2032
- Commercial
- Residential
- Defence
- East Asia Market Size (US$ Mn) Forecast, by Thermometer Type, 2025-2032
- Spot Infrared Thermometer
- Infrared Scanner Systems
- Infrared Thermal Imaging Cameras
- East Asia Market Size (US$ Mn) Forecast, by Application, 2025-2032
- Transportation
- Unmanned Systems
- Building Technology
- South Asia & Oceania Infrared Thermography Market Outlook: Historical (2019 – 2024) and Forecast (2025 – 2032)
- Key Highlights
- Pricing Analysis
- South Asia & Oceania Market Size (US$ Mn) Forecast, by Country, 2025-2032
- India
- Southeast Asia
- ANZ
- Rest of SAO
- South Asia & Oceania Market Size (US$ Mn) Forecast, by Technology, 2025-2032
- Active IR Thermography
- Passive IR Thermography
- South Asia & Oceania Market Size (US$ Mn) Forecast, by Subsector, 2025-2032
- Commercial
- Residential
- Defence
- South Asia & Oceania Market Size (US$ Mn) Forecast, by Thermometer Type, 2025-2032
- Spot Infrared Thermometer
- Infrared Scanner Systems
- Infrared Thermal Imaging Cameras
- South Asia & Oceania Market Size (US$ Mn) Forecast, by Application, 2025-2032
- Transportation
- Unmanned Systems
- Building Technology
- Latin America Infrared Thermography Market Outlook: Historical (2019 – 2024) and Forecast (2025 – 2032)
- Key Highlights
- Pricing Analysis
- Latin America Market Size (US$ Mn) Forecast, by Country, 2025-2032
- Brazil
- Mexico
- Rest of LATAM
- Latin America Market Size (US$ Mn) Forecast, by Technology, 2025-2032
- Active IR Thermography
- Passive IR Thermography
- Latin America Market Size (US$ Mn) Forecast, by Subsector, 2025-2032
- Commercial
- Residential
- Defence
- Latin America Market Size (US$ Mn) Forecast, by Thermometer Type, 2025-2032
- Spot Infrared Thermometer
- Infrared Scanner Systems
- Infrared Thermal Imaging Cameras
- Latin America Market Size (US$ Mn) Forecast, by Application, 2025-2032
- Transportation
- Unmanned Systems
- Building Technology
- Middle East & Africa Infrared Thermography Market Outlook: Historical (2019 – 2024) and Forecast (2025 – 2032)
- Key Highlights
- Pricing Analysis
- Middle East & Africa Market Size (US$ Mn) Forecast, by Country, 2025-2032
- GCC Countries
- South Africa
- Northern Africa
- Rest of MEA
- Middle East & Africa Market Size (US$ Mn) Forecast, by Technology, 2025-2032
- Active IR Thermography
- Passive IR Thermography
- Middle East & Africa Market Size (US$ Mn) Forecast, by Subsector, 2025-2032
- Commercial
- Residential
- Defence
- Middle East & Africa Market Size (US$ Mn) Forecast, by Thermometer Type, 2025-2032
- Spot Infrared Thermometer
- Infrared Scanner Systems
- Infrared Thermal Imaging Cameras
- Middle East & Africa Market Size (US$ Mn) Forecast, by Application, 2025-2032
- Transportation
- Unmanned Systems
- Building Technology
- Competition Landscape
- Market Share Analysis, 2024
- Market Structure
- Competition Intensity Mapping
- Competition Dashboard
- Company Profiles
- FLIR Systems
- Company Overview
- Product Portfolio/Offerings
- Key Financials
- SWOT Analysis
- Company Strategy and Key Developments
- Jenoptik AG
- Fluke Corporation
- SKF AB
- Keysight Technologies, Inc.
- Testo AG
- Reytek Corporation
- Optris GmbH
- R. Stahl Cameras Systems
- Opgal Optronic Industries, Ltd.
- Finmeccanica S.p.A.
- BAE Systems
- L-3 Communications
- Infratec GmbH
- Raytheon Company
- FLIR Systems
- Appendix
- Research Methodology
- Research Assumptions
- Acronyms and Abbreviations

Loading page data
Please wait a moment


