


- Executive Summary
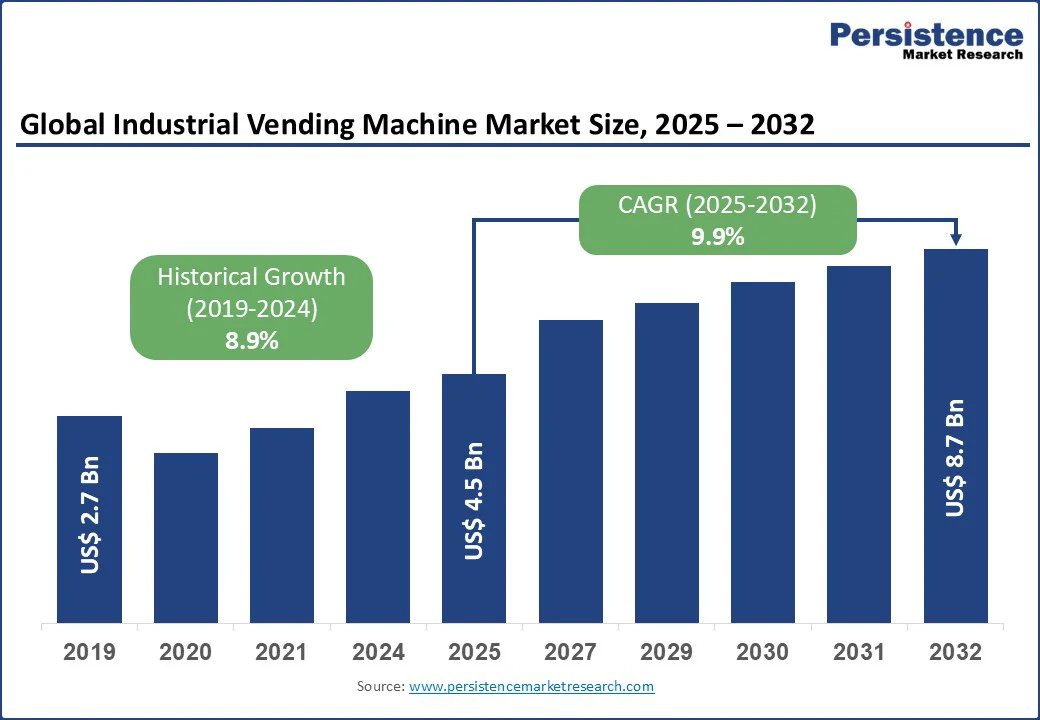
- Global Industrial Vending Machine Market Snapshot, 2025 and 2032
- Market Opportunity Assessment, 2025 - 2032, US$ Bn
- Key Market Trends
- Future Market Projections
- Premium Market Insights
- Industry Developments and Key Market Events
- PMR Analysis and Recommendations
- Market Overview
- Market Scope and Definition
- Market Dynamics
- Drivers
- Restraints
- Opportunity
- Challenges
- Key Trends
- COVID-19 Impact Analysis
- Forecast Factors - Relevance and Impact
- Value Chain Analysis
- Supply Chain Analysis
- List of Key Market Players
- Value Added Insights
- PESTLE Analysis
- Porter’s Five Force Analysis
- Price Trend Analysis, 2019 - 2032
- Pricing Analysis, By Machine Type
- Key Factors Impacting Prices, By Product Type
- Global Industrial Vending Machine Market Outlook
- Key Highlihgts
- Market Size (US$ Bn) and Y-o-Y Growth
- Absolute $ Opportunity
- Market Size (US$ Bn) Analysis and Forecast
- Historical Market Size (US$ Bn) Analysis, 2019-2024
- Market Size (US$ Bn) Analysis and Forecast, 2025-2032
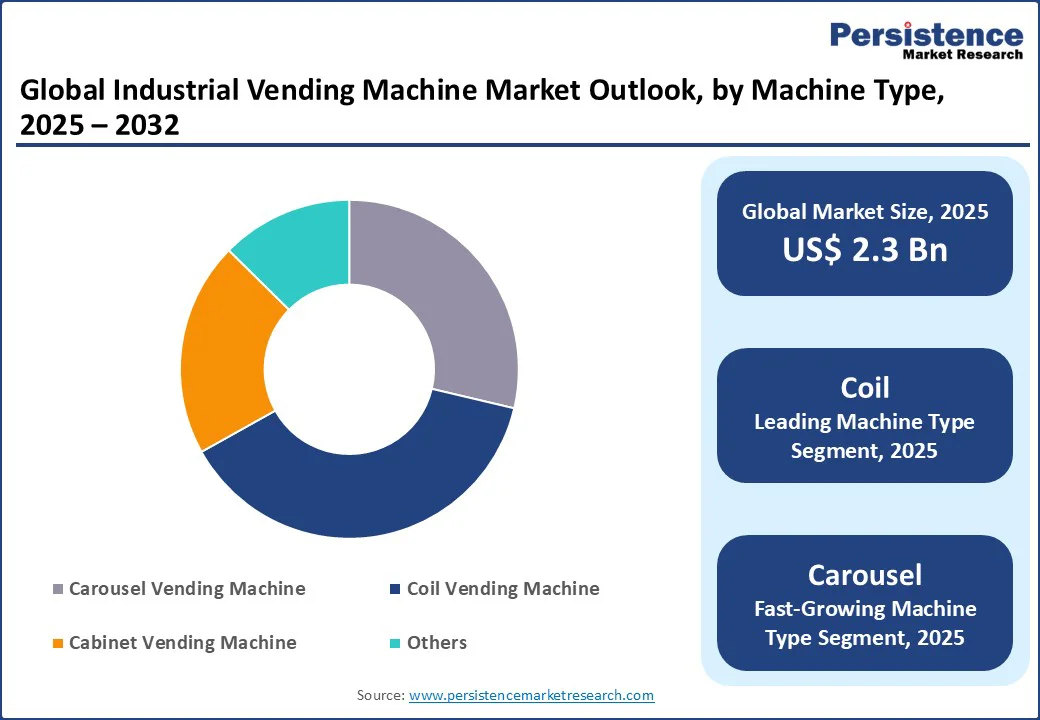
- Global Industrial Vending Machine Market Outlook: Machine Type
- Historical Market Size (US$ Bn) Analysis, By Machine Type, 2019-2024
- Market Size (US$ Bn) Analysis and Forecast, By Machine Type, 2025-2032
- Carousel Vending Machine
- Coil Vending Machine
- Cabinet Vending Machine
- Others
- Market Attractiveness Analysis: Machine Type
- Global Industrial Vending Machine Market Outlook: Product Type
- Historical Market Size (US$ Bn) Analysis, By Product Type, 2019-2024
- Market Size (US$ Bn) Analysis and Forecast, By Product Type, 2025-2032
- Maintenance, Repair, and Operations (MRO) Tools
- Personal Protective Equipment (PPE)
- Others (Cutting Tools)
- Market Attractiveness Analysis: Product Type
- Global Industrial Vending Machine Market Outlook: End Use
- Historical Market Size (US$ Bn) Analysis, By End Use, 2019-2024
- Market Size (US$ Bn) Analysis and Forecast, By End Use, 2025-2032
- Manufacturing
- Oil and Gas
- Construction
- Aerospace
- Others
- Market Attractiveness Analysis: End Use
- Key Highlihgts
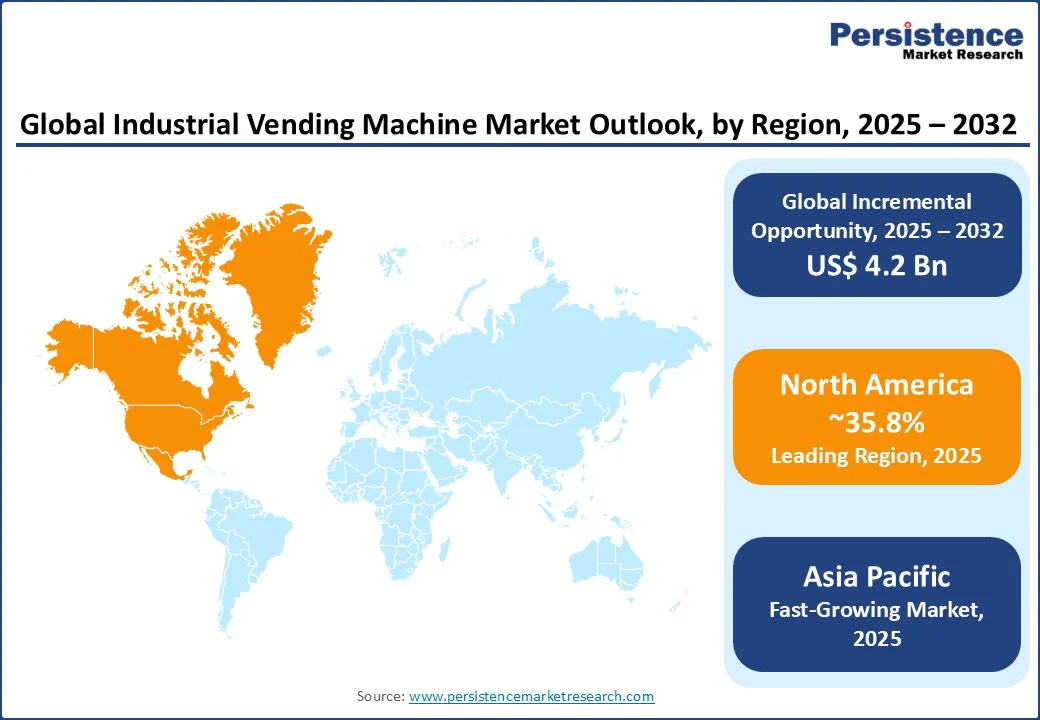
- Global Industrial Vending Machine Market Outlook: Region
- Historical Market Size (US$ Bn) Analysis, By Region, 2019-2024
- Market Size (US$ Bn) Analysis and Forecast, By Region, 2025-2032
- North America
- Europe
- East Asia
- South Asia and Oceania
- Latin America
- Middle East & Africa
- Market Attractiveness Analysis: Region
- North America Industrial Vending Machine Market Outlook
- Historical Market Size (US$ Bn) Analysis, By Market, 2019-2024
- By Country
- By Machine Type
- By Product Type
- By End Use
- Market Size (US$ Bn) Analysis and Forecast, By Country, 2025-2032
- U.S.
- Canada
- Market Size (US$ Bn) Analysis and Forecast, By Machine Type, 2025-2032
- Carousel Vending Machine
- Coil Vending Machine
- Cabinet Vending Machine
- Others
- Market Size (US$ Bn) Analysis and Forecast, By Product Type, 2025-2032
- Maintenance, Repair, and Operations (MRO) Tools
- Personal Protective Equipment (PPE)
- Others (Cutting Tools)
- Market Size (US$ Bn) Analysis and Forecast, By End Use, 2025-2032
- Manufacturing
- Oil and Gas
- Construction
- Aerospace
- Others
- Market Attractiveness Analysis
- Historical Market Size (US$ Bn) Analysis, By Market, 2019-2024
- Europe Industrial Vending Machine Market Outlook
- Historical Market Size (US$ Bn) Analysis, By Market, 2019-2024
- By Country
- By Machine Type
- By Product Type
- By End Use
- Market Size (US$ Bn) Analysis and Forecast, By Country, 2025-2032
- Germany
- France
- U.K.
- Italy
- Spain
- Russia
- Türkiye
- Rest of Europe
- Market Size (US$ Bn) Analysis and Forecast, By Machine Type, 2025-2032
- Carousel Vending Machine
- Coil Vending Machine
- Cabinet Vending Machine
- Others
- Market Size (US$ Bn) Analysis and Forecast, By Product Type, 2025-2032
- Maintenance, Repair, and Operations (MRO) Tools
- Personal Protective Equipment (PPE)
- Others (Cutting Tools)
- Market Size (US$ Bn) Analysis and Forecast, By End Use, 2025-2032
- Manufacturing
- Oil and Gas
- Construction
- Aerospace
- Others
- Market Attractiveness Analysis
- Historical Market Size (US$ Bn) Analysis, By Market, 2019-2024
- East Asia Industrial Vending Machine Market Outlook
- Historical Market Size (US$ Bn) Analysis, By Market, 2019-2024
- By Country
- By Machine Type
- By Product Type
- By End Use
- Market Size (US$ Bn) Analysis and Forecast, By Country, 2025-2032
- China
- Japan
- South Korea
- Market Size (US$ Bn) Analysis and Forecast, By Machine Type, 2025-2032
- Carousel Vending Machine
- Coil Vending Machine
- Cabinet Vending Machine
- Others
- Market Size (US$ Bn) Analysis and Forecast, By Product Type, 2025-2032
- Maintenance, Repair, and Operations (MRO) Tools
- Personal Protective Equipment (PPE)
- Others (Cutting Tools)
- Market Size (US$ Bn) Analysis and Forecast, By End Use, 2025-2032
- Manufacturing
- Oil and Gas
- Construction
- Aerospace
- Others
- Market Attractiveness Analysis
- Historical Market Size (US$ Bn) Analysis, By Market, 2019-2024
- South Asia & Oceania Industrial Vending Machine Market Outlook
- Historical Market Size (US$ Bn) Analysis, By Market, 2019-2024
- By Country
- By Machine Type
- By Product Type
- By End Use
- Market Size (US$ Bn) Analysis and Forecast, By Country, 2025-2032
- India
- Southeast Asia
- ANZ
- Rest of South Asia & Oceania
- Market Size (US$ Bn) Analysis and Forecast, By Machine Type, 2025-2032
- Carousel Vending Machine
- Coil Vending Machine
- Cabinet Vending Machine
- Others
- Market Size (US$ Bn) Analysis and Forecast, By Product Type, 2025-2032
- Maintenance, Repair, and Operations (MRO) Tools
- Personal Protective Equipment (PPE)
- Others (Cutting Tools)
- Market Size (US$ Bn) Analysis and Forecast, By End Use, 2025-2032
- Manufacturing
- Oil and Gas
- Construction
- Aerospace
- Others
- Market Attractiveness Analysis
- Historical Market Size (US$ Bn) Analysis, By Market, 2019-2024
- Latin America Industrial Vending Machine Market Outlook
- Historical Market Size (US$ Bn) Analysis, By Market, 2019-2024
- By Country
- By Machine Type
- By Product Type
- By End Use
- Market Size (US$ Bn) Analysis and Forecast, By Country, 2025-2032
- Brazil
- Mexico
- Rest of Latin America
- Market Size (US$ Bn) Analysis and Forecast, By Machine Type, 2025-2032
- Carousel Vending Machine
- Coil Vending Machine
- Cabinet Vending Machine
- Others
- Market Size (US$ Bn) Analysis and Forecast, By Product Type, 2025-2032
- Maintenance, Repair, and Operations (MRO) Tools
- Personal Protective Equipment (PPE)
- Others (Cutting Tools)
- Market Size (US$ Bn) Analysis and Forecast, By End Use, 2025-2032
- Manufacturing
- Oil and Gas
- Construction
- Aerospace
- Others
- Market Attractiveness Analysis
- Historical Market Size (US$ Bn) Analysis, By Market, 2019-2024
- Middle East & Africa Industrial Vending Machine Market Outlook
- Historical Market Size (US$ Bn) Analysis, By Market, 2019-2024
- By Country
- By Machine Type
- By Product Type
- By End Use
- Market Size (US$ Bn) Analysis and Forecast, By Country, 2025-2032
- GCC Countries
- Egypt
- South Africa
- Northern Africa
- Rest of Middle East & Africa
- Market Size (US$ Bn) Analysis and Forecast, By Machine Type, 2025-2032
- Carousel Vending Machine
- Coil Vending Machine
- Cabinet Vending Machine
- Others
- Market Size (US$ Bn) Analysis and Forecast, By Product Type, 2025-2032
- Maintenance, Repair, and Operations (MRO) Tools
- Personal Protective Equipment (PPE)
- Others (Cutting Tools)
- Market Size (US$ Bn) Analysis and Forecast, By End Use, 2025-2032
- Manufacturing
- Oil and Gas
- Construction
- Aerospace
- Others
- Market Attractiveness Analysis
- Historical Market Size (US$ Bn) Analysis, By Market, 2019-2024
- Competition Landscape
- Market Share Analysis, 2025
- Market Structure
- Competition Intensity Mapping By Market
- Competition Dashboard
- Company Profiles (Details - Overview, Financials, Strategy, Recent Developments)
- Apex Industrial Technologies, LLC
- Overview
- Segments and Machine Type
- Key Financials
- Market Developments
- Market Strategy
- MSC Industrial Direct Co., Inc.
- Auto Crib, Inc.
- IVM Ltd.
- IMC Group
- Airgas Inc.
- Fastenal Company
- CribMaster
- SecuraStock
- Brammer
- Others
- Apex Industrial Technologies, LLC
- Appendix
- Research Methodology
- Research Assumptions
- Acronyms and Abbreviations

Loading page data
Please wait a moment


