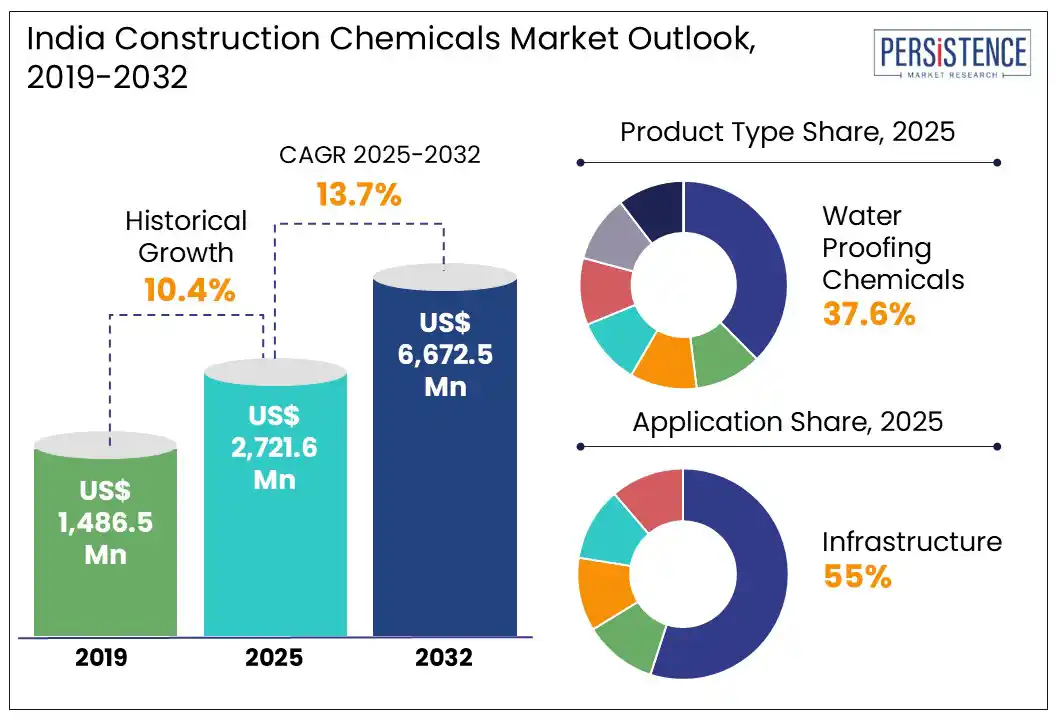
India Construction Chemicals Market

India Market Study on Construction Chemicals: Demand for Plaster and Adhesives & Sealants to Surge across the Country

India Construction Chemicals Market Product Type (Water Proofing Chemicals, Protective Coating, Concrete Admixture, Adhesives and Sealants, Asphalt Additives, Concrete Repair Mortar, etc.)

- Table of Content -

1. Executive Summary

    1.1. India Market Outlook

    1.2. Demand Side Trends

    1.3. Supply Side Trends

    1.4. Analysis and Recommendations

2. Market Overview

    2.1. Market Coverage / Taxonomy

    2.2. Market Definition / Scope / Limitations

    2.3. Porter’s Analysis

    2.4. Key Success Factors

3. Market View Point

    3.1. Macro-Economic Factors

        3.1.1. India Construction Industry Outlook

        3.1.2. Global Chemical Sales overviews

        3.1.3. India Economy Outlook

        3.1.4. India Construction Chemical Outlook

        3.1.5. World Cement Production

        3.1.6. India Cement Production Outlook

        3.1.7. India Construction Project Overview

        3.1.8. India Real Estate Industry Overview

    3.2. Forecast Factors: Relevance and Impact

4. Market Dynamics

    4.1. Key Trends Impacting the Market

        4.1.1. Drivers

        4.1.2. Restraints

        4.1.3. Opportunity Analysis

5. India Market Demand Analysis 2017-2024 and Forecast, 2023-2030

    5.1. Historical Market Volume (Units) Analysis, 2017-2024

    5.2. Current and Future Market Volume (Units) Projections, 2023-2030

    5.3. Y-o-Y Growth Trend Analysis

    5.4. India Market - Pricing Analysis

    5.5. Pricing Break-up

        5.5.1. Manufacturer-Level Pricing

        5.5.2. Distributor Level Pricing

    5.6. Global Average Pricing Analysis Benchmark

    5.7. Value Chain

6. India Market Analysis 2017-2024 and Forecast 2023-2030, By Product Type

    6.1. Introduction / Key Findings

    6.2. Historical Market Size (US$ Mn) and Volume Analysis By Product Type, 2017-2024

    6.3. Current and Future Market Size (US$ Mn) and Volume Analysis and Forecast By Product Type, 2023 – 2030

        6.3.1. Concrete Admixture

            6.3.1.1. Plasticizer

            6.3.1.2. Accelerator

            6.3.1.3. Retarder

            6.3.1.4. Air-Entrainer

        6.3.2. Water Proofing Chemicals

            6.3.2.1. Bitumen

            6.3.2.2. Acrylic Polymer

            6.3.2.3. SBR Styrene-Butadiene

            6.3.2.4. Cementitious Membrane

            6.3.2.5. PU Membrane – Liquid Applied Membrane

            6.3.2.6. Crystalline

            6.3.2.7. Additives in Waterproofing

            6.3.2.8. PVC

            6.3.2.9. EPDM

            6.3.2.10. TPO

            6.3.2.11. PTFE

            6.3.2.12. Silicone

        6.3.3. Adhesives & Sealants

            6.3.3.1. Adhesives

                6.3.3.1.1. Tile Adhesive

                    6.3.3.1.1.1. Cementitious

                    6.3.3.1.1.2. Epoxy

                6.3.3.1.2. Tile Grouts

                    6.3.3.1.2.1. Cementitious

                    6.3.3.1.2.2. Epoxy

                6.3.3.1.3. Masonry Mortar

            6.3.3.2. Sealants

                6.3.3.2.1. Silicone

                6.3.3.2.2. MS Hybrid

                6.3.3.2.3. PU

                6.3.3.2.4. Weatherproof Silicone

                6.3.3.2.5. Polysulfide

        6.3.4. Protective Coating

            6.3.4.1. Epoxy

            6.3.4.2. Polyurethane

            6.3.4.3. Acrylic

            6.3.4.4. Alkyd

            6.3.4.5. Polyester

            6.3.4.6. Others

        6.3.5. Concrete Repair Mortar

            6.3.5.1. Cement Based

            6.3.5.2. Epoxy Based

            6.3.5.3. Micro Concrete

        6.3.6. Plaster

            6.3.6.1. Cement Based

            6.3.6.2. Gypsum Based

        6.3.7. Asphalt Additives

7. India Market Analysis 2017-2024 and Forecast 2023-2030, by Application

    7.1. Introduction / Key Findings

    7.2. Historical Market Size (US$ Mn) and Volume Analysis By Application, 2017-2024

    7.3. Current and Future Market Size (US$ Mn) and Volume Analysis and Forecast By Application, 2023 – 2030

        7.3.1. Infrastructure

        7.3.2. Industrial & Commercial

        7.3.3. Residential

8. India Market Analysis 2017-2024 and Forecast 2023-2030, by Region

    8.1. Introduction

    8.2. Historical Market Size (US$ Mn) and Volume Analysis By Region, 2017-2024

    8.3. Current Market Size (US$ Mn) and Volume Analysis and Forecast By Region, 2023 – 2030

        8.3.1. North

        8.3.2. South

        8.3.3. East

        8.3.4. West

    8.4. Market Attractiveness Analysis By Region

9. North India Market Analysis 2017-2024 and Forecast 2023-2030

    9.1. Introduction

    9.2. Pricing Analysis

    9.3. Historical Market Size (US$ Mn) and Volume Trend Analysis By Market Taxonomy, 2017- 2024

    9.4. Market Size (US$ Mn) and Volume Forecast By Market Taxonomy, 2023-2030

        9.4.1. By Product Type

        9.4.2. By Application

    9.5. Market Attractiveness Analysis

        9.5.1. By Product Type

        9.5.2. By Application

        9.5.3. Infrastructure Projects by States

10. South India Market Analysis 2017-2024 and Forecast 2023-2030

    10.1. Introduction

    10.2. Pricing Analysis

    10.3. Historical Market Size (US$ Mn) and Volume Trend Analysis By Market Taxonomy, 2017-2024

    10.4. Market Size (US$ Mn) and Volume Forecast By Market Taxonomy, 2023-2030

        10.4.1. By Product Type

        10.4.2. By Application

    10.5. Market Attractiveness Analysis

        10.5.1. By Product Type

        10.5.2. By Application

    10.6. Infrastructure Projects by States

11. East India Market Analysis 2017-2024 and Forecast 2023-2030

    11.1. Introduction

    11.2. Pricing Analysis

    11.3. Historical Market Size (US$ Mn) and Volume Trend Analysis By Market Taxonomy, 2017-2024

    11.4. Market Size (US$ Mn) and Volume Forecast By Market Taxonomy, 2023-2030

        11.4.1. By Product Type

        11.4.2. By Application

    11.5. Market Attractiveness Analysis

        11.5.1. By Product Type

        11.5.2. By Application

    11.6. Infrastructure Projects by States

12. West India Market Analysis 2017-2024 and Forecast 2023-2030

    12.1. Introduction

    12.2. Pricing Analysis

    12.3. Historical Market Size (US$ Mn) and Volume Trend Analysis By Market Taxonomy, 2017-2024

    12.4. Market Size (US$ Mn) and Volume Forecast By Market Taxonomy, 2023-2030

        12.4.1. By Product Type

        12.4.2. By Application

    12.5. Market Attractiveness Analysis

        12.5.1. By Product Type

        12.5.2. By Application

    12.6. Infrastructure Projects by States

13. Competition Landscape

    13.1. Tier Structure Analysis

    13.2. Prominent Players in India Construction Chemicals Market

    13.3. Product Mapping by Key Players

    13.4. Market Concentration

    13.5. Market Dashboard

    13.6. Company Profiles

        13.6.1. SIKA AG

            13.6.1.1. Overview

            13.6.1.2. Product Portfolio

            13.6.1.3. Profitability by Market Segments (Product/Channel/Region)

            13.6.1.4. Sales Footprint

            13.6.1.5. Strategy Overview

                13.6.1.5.1. Marketing Strategy

                13.6.1.5.2. Product Strategy

                13.6.1.5.3. Channel Strategy

        13.6.2. Master Builder Solutions

            13.6.2.1. Overview

            13.6.2.2. Product Portfolio

            13.6.2.3. Profitability by Market Segments (Product/Channel/Region)

            13.6.2.4. Sales Footprint

            13.6.2.5. Strategy Overview

                13.6.2.5.1. Marketing Strategy

                13.6.2.5.2. Product Strategy

                13.6.2.5.3. Channel Strategy

        13.6.3. Dow Chemicals

            13.6.3.1. Overview

            13.6.3.2. Product Portfolio

            13.6.3.3. Profitability by Market Segments (Product/Channel/Region)

            13.6.3.4. Sales Footprint

            13.6.3.5. Strategy Overview

                13.6.3.5.1. Marketing Strategy

                13.6.3.5.2. Product Strategy

                13.6.3.5.3. Channel Strategy

        13.6.4. RPM International Inc.

            13.6.4.1. Overview

            13.6.4.2. Product Portfolio

            13.6.4.3. Profitability by Market Segments (Product/Channel/Region)

            13.6.4.4. Sales Footprint

            13.6.4.5. Strategy Overview

                13.6.4.5.1. Marketing Strategy

                13.6.4.5.2. Product Strategy

                13.6.4.5.3. Channel Strategy

        13.6.5. MAPEI Construction Products India Pvt. Ltd.

            13.6.5.1. Overview

            13.6.5.2. Product Portfolio

            13.6.5.3. Profitability by Market Segments (Product/Channel/Region)

            13.6.5.4. Sales Footprint

            13.6.5.5. Strategy Overview

                13.6.5.5.1. Marketing Strategy

                13.6.5.5.2. Product Strategy

                13.6.5.5.3. Channel Strategy

        13.6.6. Akzo Nobel NV

            13.6.6.1. Overview

            13.6.6.2. Product Portfolio

            13.6.6.3. Profitability by Market Segments (Product/Channel/Region)

            13.6.6.4. Sales Footprint

            13.6.6.5. Strategy Overview

                13.6.6.5.1. Marketing Strategy

                13.6.6.5.2. Product Strategy

                13.6.6.5.3. Channel Strategy

        13.6.7. Pidilite Industries

            13.6.7.1. Overview

            13.6.7.2. Product Portfolio

            13.6.7.3. Profitability by Market Segments (Product/Channel/Region)

            13.6.7.4. Sales Footprint

            13.6.7.5. Strategy Overview

                13.6.7.5.1. Marketing Strategy

                13.6.7.5.2. Product Strategy

                13.6.7.5.3. Channel Strategy

        13.6.8. Chembond Chemicals Ltd.

            13.6.8.1. Overview

            13.6.8.2. Product Portfolio

            13.6.8.3. Profitability by Market Segments (Product/Channel/Region)

            13.6.8.4. Sales Footprint

            13.6.8.5. Strategy Overview

                13.6.8.5.1. Marketing Strategy

                13.6.8.5.2. Product Strategy

                13.6.8.5.3. Channel Strategy

        13.6.9. Flowcrete India

            13.6.9.1. Overview

            13.6.9.2. Product Portfolio

            13.6.9.3. Profitability by Market Segments (Product/Channel/Region)

            13.6.9.4. Sales Footprint

            13.6.9.5. Strategy Overview

                13.6.9.5.1. Marketing Strategy

                13.6.9.5.2. Product Strategy

                13.6.9.5.3. Channel Strategy

        13.6.10. Fosroc International

            13.6.10.1. Overview

            13.6.10.2. Product Portfolio

            13.6.10.3. Profitability by Market Segments (Product/Channel/Region)

            13.6.10.4. Sales Footprint

            13.6.10.5. Strategy Overview

                13.6.10.5.1. Marketing Strategy

                13.6.10.5.2. Product Strategy

                13.6.10.5.3. Channel Strategy

        13.6.11. CICO Technologies Limited

            13.6.11.1. Overview

            13.6.11.2. Product Portfolio

            13.6.11.3. Profitability by Market Segments (Product/Channel/Region)

            13.6.11.4. Sales Footprint

            13.6.11.5. Strategy Overview

                13.6.11.5.1. Marketing Strategy

                13.6.11.5.2. Product Strategy

                13.6.11.5.3. Channel Strategy

        13.6.12. MC-Bauchemie

            13.6.12.1. Overview

            13.6.12.2. Product Portfolio

            13.6.12.3. Profitability by Market Segments (Product/Channel/Region)

            13.6.12.4. Sales Footprint

            13.6.12.5. Strategy Overview

                13.6.12.5.1. Marketing Strategy

                13.6.12.5.2. Product Strategy

                13.6.12.5.3. Channel Strategy

        13.6.13. W. R. Grace & Co.-Conn.

            13.6.13.1. Overview

            13.6.13.2. Product Portfolio

            13.6.13.3. Profitability by Market Segments (Product/Channel/Region)

            13.6.13.4. Sales Footprint

            13.6.13.5. Strategy Overview

                13.6.13.5.1. Marketing Strategy

                13.6.13.5.2. Product Strategy

                13.6.13.5.3. Channel Strategy

        13.6.14. Saint-Gobain S.A.

            13.6.14.1. Overview

            13.6.14.2. Product Portfolio

            13.6.14.3. Profitability by Market Segments (Product/Channel/Region)

            13.6.14.4. Sales Footprint

            13.6.14.5. Strategy Overview

                13.6.14.5.1. Marketing Strategy

                13.6.14.5.2. Product Strategy

                13.6.14.5.3. Channel Strategy

        13.6.15. KERAKOLL India Pvt. Ltd

            13.6.15.1. Overview

            13.6.15.2. Product Portfolio

            13.6.15.3. Profitability by Market Segments (Product/Channel/Region)

            13.6.15.4. Sales Footprint

            13.6.15.5. Strategy Overview

                13.6.15.5.1. Marketing Strategy

                13.6.15.5.2. Product Strategy

                13.6.15.5.3. Channel Strategy

        13.6.16. Ardex Endura

            13.6.16.1. Overview

            13.6.16.2. Product Portfolio

            13.6.16.3. Profitability by Market Segments (Product/Channel/Region)

            13.6.16.4. Sales Footprint

            13.6.16.5. Strategy Overview

                13.6.16.5.1. Marketing Strategy

                13.6.16.5.2. Product Strategy

                13.6.16.5.3. Channel Strategy

        13.6.17. Magicrete

            13.6.17.1. Overview

            13.6.17.2. Product Portfolio

            13.6.17.3. Profitability by Market Segments (Product/Channel/Region)

            13.6.17.4. Sales Footprint

            13.6.17.5. Strategy Overview

                13.6.17.5.1. Marketing Strategy

                13.6.17.5.2. Product Strategy

                13.6.17.5.3. Channel Strategy

        13.6.18. Balmer Lawrie & Co. Ltd

            13.6.18.1. Overview

            13.6.18.2. Product Portfolio

            13.6.18.3. Profitability by Market Segments (Product/Channel/Region)

            13.6.18.4. Sales Footprint

            13.6.18.5. Strategy Overview

                13.6.18.5.1. Marketing Strategy

                13.6.18.5.2. Product Strategy

                13.6.18.5.3. Channel Strategy

        13.6.19. Cera-Chem Pvt. Ltd.

            13.6.19.1. Overview

            13.6.19.2. Product Portfolio

            13.6.19.3. Profitability by Market Segments (Product/Channel/Region)

            13.6.19.4. Sales Footprint

            13.6.19.5. Strategy Overview

                13.6.19.5.1. Marketing Strategy

                13.6.19.5.2. Product Strategy

                13.6.19.5.3. Channel Strategy

        13.6.20. Choksey Chemicals Private Limited

            13.6.20.1. Overview

            13.6.20.2. Product Portfolio

            13.6.20.3. Profitability by Market Segments (Product/Channel/Region)

            13.6.20.4. Sales Footprint

            13.6.20.5. Strategy Overview

                13.6.20.5.1. Marketing Strategy

                13.6.20.5.2. Product Strategy

                13.6.20.5.3. Channel Strategy

        13.6.21. MYK LATICRETE

            13.6.21.1. Overview

            13.6.21.2. Product Portfolio

            13.6.21.3. Profitability by Market Segments (Product/Channel/Region)

            13.6.21.4. Sales Footprint

            13.6.21.5. Strategy Overview

                13.6.21.5.1. Marketing Strategy

                13.6.21.5.2. Product Strategy

                13.6.21.5.3. Channel Strategy

        13.6.22. GCP Applied Technologies

            13.6.22.1. Overview

            13.6.22.2. Product Portfolio

            13.6.22.3. Profitability by Market Segments (Product/Channel/Region)

            13.6.22.4. Sales Footprint

            13.6.22.5. Strategy Overview

                13.6.22.5.1. Marketing Strategy

                13.6.22.5.2. Product Strategy

                13.6.22.5.3. Channel Strategy

Note: List of companies may be further augmented and refined during the course of research study

14. Assumptions and Acronyms Used

15. Research Methodology

Sample Report

FREE Report Sample is Available

In-depth report coverage is now just a few seconds away

Download PDF Get FREE Report Sample

- List Of Table -

Table 01: India Construction Chemicals Market Size (US$ Mn) and Volume (Tons) Forecast By Product Type, 2017–2030

Table 02: India Construction Chemicals Market Size (US$ Mn) and Volume (Tons) Forecast by Concrete Admixture, 2017–2030

Table 03: India Construction Chemicals Volume (Tons) Forecast by Water Proofing, 2017–2030

Table 04: India Construction Chemicals Market Size (US$ Mn) Forecast by Water Proofing, 2017–2030

Table 05: India Construction Chemicals Market Size (US$ Mn) and Volume (Tons) Forecast by Adhesives & Sealants, 2017–2030

Table 06: India Construction Chemicals Market Size (US$ Mn) and Volume (Tons) Forecast by Adhesives, 2017–2030

Table 07: India Construction Chemicals Market Size (US$ Mn) and Volume (Tons) Forecast by Sealants, 2017–2030

Table 08: India Construction Chemicals Market Size (US$ Mn) and Volume (Tons) Forecast by Protective Coatings, 2017–2030

Table 09: India Construction Chemicals Market Size (US$ Mn) and Volume (Tons) Forecast by Concrete Repair Mortar, 2017–2030

Table 10: India Construction Chemicals Market Size (US$ Mn) and Volume (Tons) Forecast by Plaster, 2017–2030

Table 11: India Construction Chemicals Market Size (US$ Mn) and Volume (Tons) Forecast by Application, 2017–2030

Table 12: India Construction Chemicals Market Size (US$ Mn) and Volume (Tons) Forecast by Region, 2017–2030

Table 13: North India Construction Chemicals Market Size (US$ Mn) and Volume (Tons) Forecast By Product Type, 2017–2030

Table 14: North India Construction Chemicals Market Size (US$ Mn) and Volume (Tons) Forecast by Concrete Admixture, 2017–2030

Table 15: North India Construction Chemicals Volume (Tons) Forecast by Water Proofing, 2017–2030

Table 16: North India Construction Chemicals Market Size (US$ Mn) Forecast by Water Proofing, 2017–2030

Table 17: North India Construction Chemicals Market Size (US$ Mn) and Volume (Tons) Forecast by Adhesives & Sealants, 2017–2030

Table 18: North India Construction Chemicals Market Size (US$ Mn) and Volume (Tons) Forecast by Adhesives, 2017–2030

Table 19: North India Construction Chemicals Market Size (US$ Mn) and Volume (Tons) Forecast by Sealants, 2017–2030

Table 20: North India Construction Chemicals Market Size (US$ Mn) and Volume (Tons) Forecast by Protective Coatings, 2017–2030

Table 21: North India Construction Chemicals Market Size (US$ Mn) and Volume (Tons) Forecast by Concrete Repair Mortar, 2017–2030

Table 22: North India Construction Chemicals Market Size (US$ Mn) and Volume (Tons) Forecast by Plaster, 2017–2030

Table 23: North India Construction Chemicals Market Size (US$ Mn) and Volume (Tons) Forecast by Application, 2017–2030

Table 24: West India Construction Chemicals Market Size (US$ Mn) and Volume (Tons) Forecast By Product Type, 2017–2030

Table 25: West India Construction Chemicals Market Size (US$ Mn) and Volume (Tons) Forecast by Concrete Admixture, 2017–2030

Table 26: West India Construction Chemicals Volume (Tons) Forecast by Water Proofing, 2017–2030

Table 27: West India Construction Chemicals Market Size (US$ Mn) Forecast by Water Proofing, 2017–2030

Table 28: West India Construction Chemicals Market Size (US$ Mn) and Volume (Tons) Forecast by Adhesives & Sealants, 2017–2030

Table 29: West India Construction Chemicals Market Size (US$ Mn) and Volume (Tons) Forecast by Adhesives, 2017–2030

Table 30: West India Construction Chemicals Market Size (US$ Mn) and Volume (Tons) Forecast by Sealants, 2017–2030

Table 31: West India Construction Chemicals Market Size (US$ Mn) and Volume (Tons) Forecast by Protective Coatings, 2017–2030

Table 32: West India Construction Chemicals Market Size (US$ Mn) and Volume (Tons) Forecast by Concrete Repair Mortar, 2017–2030

Table 33: West India Construction Chemicals Market Size (US$ Mn) and Volume (Tons) Forecast by Plaster, 2017–2030

Table 34: West India Construction Chemicals Market Size (US$ Mn) and Volume (Tons) Forecast by Application, 2017–2030

Table 35: East India Construction Chemicals Market Size (US$ Mn) and Volume (Tons) Forecast By Product Type, 2017–2030

Table 36: East India Construction Chemicals Market Size (US$ Mn) and Volume (Tons) Forecast by Concrete Admixture, 2017–2030

Table 37: East India Construction Chemicals Volume (Tons) Forecast by Water Proofing, 2017–2030

Table 38: East India Construction Chemicals Market Size (US$ Mn) Forecast by Water Proofing, 2017–2030

Table 39: East India Construction Chemicals Market Size (US$ Mn) and Volume (Tons) Forecast by Adhesives & Sealants, 2017–2030

Table 40: East India Construction Chemicals Market Size (US$ Mn) and Volume (Tons) Forecast by Adhesives, 2017–2030

Table 41: East India Construction Chemicals Market Size (US$ Mn) and Volume (Tons) Forecast by Sealants, 2017–2030

Table 42: East India Construction Chemicals Market Size (US$ Mn) and Volume (Tons) Forecast by Protective Coatings, 2017–2030

Table 43: East India Construction Chemicals Market Size (US$ Mn) and Volume (Tons) Forecast by Concrete Repair Mortar, 2017–2030

Table 44: East India Construction Chemicals Market Size (US$ Mn) and Volume (Tons) Forecast by Plaster, 2017–2030

Table 45: East India Construction Chemicals Market Size (US$ Mn) and Volume (Tons) Forecast by Application, 2017–2030

Table 46: South India Construction Chemicals Market Size (US$ Mn) and Volume (Tons) Forecast By Product Type, 2017–2030

Table 47: South India Construction Chemicals Market Size (US$ Mn) and Volume (Tons) Forecast by Concrete Admixture, 2017–2030

Table 48: South India Construction Chemicals Volume (Tons) Forecast by Water Proofing, 2017–2030

Table 49: South India Construction Chemicals Market Size (US$ Mn) Forecast by Water Proofing, 2017–2030

Table 50: South India Construction Chemicals Market Size (US$ Mn) and Volume (Tons) Forecast by Adhesives & Sealants, 2017–2030

Table 51: South India Construction Chemicals Market Size (US$ Mn) and Volume (Tons) Forecast by Adhesives, 2017–2030

Table 52: South India Construction Chemicals Market Size (US$ Mn) and Volume (Tons) Forecast by Sealants, 2017–2030

Table 53: South India Construction Chemicals Market Size (US$ Mn) and Volume (Tons) Forecast by Protective Coatings, 2017–2030

Table 54: South India Construction Chemicals Market Size (US$ Mn) and Volume (Tons) Forecast by Concrete Repair Mortar, 2017–2030

Table 55: South India Construction Chemicals Market Size (US$ Mn) and Volume (Tons) Forecast by Plaster, 2017–2030

Table 56: South India Construction Chemicals Market Size (US$ Mn) and Volume (Tons) Forecast by Application, 2017–2030

Custom Report Cover

Make This Report Your Own

Take Advantage of Intelligence Tailored to your Business Objective

> Get a Customized Version

- List Of Chart -

Figure 01: India Construction Chemicals Market Historical Tons, 2017-2024

Figure 02: India Construction Chemicals Market Forecasted Tons, 2024 - 2030

Figure 03: India Construction Chemicals Market Value (US$ Mn) Forecast & Y-o-Y Growth (%), 2024–2030

Figure 04: India Construction Chemicals Market Absolute $ Opportunity, 2017–2030

Figure 05: India Construction Chemicals Market Y-o-Y Growth (%) By Product Type and Absolute $ Opportunity, 2024-2030

Figure 06: India Construction Chemicals Market Y-o-Y Growth (%) By Product Type and Absolute $ Opportunity, 2024-2030

Figure 07: India Construction Chemicals Market Y-o-Y Growth (%) By Product Type and Absolute $ Opportunity, 2024-2030

Figure 08: India Construction Chemicals Market Y-o-Y Growth (%) By Product Type and Absolute $ Opportunity, 2024-2030

Figure 09: India Construction Chemicals Market Attractiveness Analysis By Product Type, 2024-2030

Figure 10: India Construction Chemicals Market Y-o-Y Growth (%) by Concrete Admixture and Absolute $ Opportunity, 2024-2030

Figure 11: India Construction Chemicals Market Y-o-Y Growth (%) by Concrete Admixture and Absolute $ Opportunity, 2024-2030

Figure 12: India Construction Chemicals Market Attractiveness Analysis by Concrete Admixture, 2024-2030

Figure 13: India Construction Chemicals Market Y-o-Y Growth (%) by Water Proofing and Absolute $ Opportunity, 2024-2030

Figure 14: India Construction Chemicals Market Y-o-Y Growth (%) by Water Proofing and Absolute $ Opportunity, 2024-2030

Figure 15: India Construction Chemicals Market Y-o-Y Growth (%) by Water Proofing and Absolute $ Opportunity, 2024-2030

Figure 16: India Construction Chemicals Market Y-o-Y Growth (%) by Water Proofing and Absolute $ Opportunity, 2024-2030

Figure 17: India Construction Chemicals Market Y-o-Y Growth (%) by Water Proofing and Absolute $ Opportunity, 2024-2030

Figure 18: India Construction Chemicals Market Y-o-Y Growth (%) by Water Proofing and Absolute $ Opportunity, 2024-2030

Figure 19: India Construction Chemicals Market Attractiveness Analysis by Water Proofing, 2024-2030

Figure 20: India Construction Chemicals Market Y-o-Y Growth (%) by Adhesives & Sealants and Absolute $ Opportunity, 2024-2030

Figure 21: India Construction Chemicals Market Attractiveness Analysis by Adhesives & Sealants, 2024-2030

Figure 22: India Construction Chemicals Market Y-o-Y Growth (%) by Adhesives and Absolute $ Opportunity, 2024-2030

Figure 23: India Construction Chemicals Market Y-o-Y Growth (%) By Product Type and Absolute $ Opportunity, 2024-2030

Figure 24: India Construction Chemicals Market Y-o-Y Growth (%) by Sealants and Absolute $ Opportunity, 2024-2030

Figure 25: India Construction Chemicals Market Y-o-Y Growth (%) by Sealants and Absolute $ Opportunity, 2024-2030

Figure 26: India Construction Chemicals Market Y-o-Y Growth (%) by Sealants and Absolute $ Opportunity, 2024-2030

Figure 27: India Construction Chemicals Market Y-o-Y Growth (%) by Protective Coatings and Absolute $ Opportunity, 2024-2030

Figure 28: India Construction Chemicals Market Y-o-Y Growth (%) by Protective Coatings and Absolute $ Opportunity, 2024-2030

Figure 29: India Construction Chemicals Market Y-o-Y Growth (%) by Protective Coatings and Absolute $ Opportunity, 2024-2030

Figure 30: India Construction Chemicals Market Attractiveness Analysis by Protective Coatings, 2024-2030

Figure 31: India Construction Chemicals Market Y-o-Y Growth (%) by Concrete Repair Mortar and Absolute $ Opportunity, 2024-2030

Figure 32: India Construction Chemicals Market Y-o-Y Growth (%) by Concrete Repair Mortar and Absolute $ Opportunity, 2024-2030

Figure 33: India Construction Chemicals Market Attractiveness Analysis by Concrete Repair Mortar, 2024-2030

Figure 34: India Construction Chemicals Market Y-o-Y Growth (%) by Plaster and Absolute $ Opportunity, 2024-2030

Figure 35: India Construction Chemicals Market Attractiveness Analysis by Plaster, 2024-2030

Figure 36: India Construction Chemicals Market Share and BPS Analysis by Application, 2024 & 2030

Figure 37: India Construction Chemicals Market Y-o-Y Growth by Application, 2024-2030

Figure 38: India Construction Chemicals Market Attractiveness Analysis by Application, 2024-2030

Figure 39: India Construction Chemicals Market Absolute $ Opportunity by Infrastructural Segment, 2017–2030

Figure 40: India Construction Chemicals Market Absolute $ Opportunity by Industrial & Commercial, 2017–2030

Figure 41: India Construction Chemicals Market Absolute $ Opportunity by Residential Segment, 2017–2030

Figure 42: India Construction Chemicals Market Share and BPS Analysis by Region, 2024 & 2030

Figure 43: India Construction Chemicals Market Y-o-Y Growth by Region, 2024-2030

Figure 44: India Construction Chemicals Market Attractiveness Analysis by Region, 2024-2030

Figure 45: North India Construction Chemicals Market Absolute $ Opportunity, 2024–2030

Figure 46: South India Construction Chemicals Market Absolute $ Opportunity, 2024–2030

Figure 47: East India Construction Chemicals Market Absolute $ Opportunity, 2024–2030

Figure 48: West India Construction Chemicals Market Absolute $ Opportunity, 2024–2030

Figure 49: North India Construction Chemicals Market Share and BPS Analysis By Product Type, 2024 & 2030

Figure 50: North India Construction Chemicals Market Y-o-Y Growth By Product Type, 2024-2030

Figure 51: North India Construction Chemicals Market Attractiveness Analysis By Product Type, 2024-2030

Figure 52: North India Construction Chemicals Market Share and BPS Analysis by Application, 2024 & 2030

Figure 53: North India Construction Chemicals Market Y-o-Y Growth by Application, 2024-2030

Figure 54: North India Construction Chemicals Market Attractiveness Analysis by Application, 2024-2030

Figure 55: West India Construction Chemicals Market Share and BPS Analysis By Product Type, 2024 & 2030

Figure 56: West India Construction Chemicals Market Y-o-Y Growth By Product Type, 2024-2030

Figure 57: West India Construction Chemicals Market Attractiveness Analysis By Product Type, 2024-2030

Figure 58: West India Construction Chemicals Market Share and BPS Analysis by Application, 2024 & 2030

Figure 59: West India Construction Chemicals Market Y-o-Y Growth by Application, 2024-2030

Figure 60: West India Construction Chemicals Market Attractiveness Analysis by Application, 2024-2030

Figure 61: East India Construction Chemicals Market Share and BPS Analysis By Product Type, 2024 & 2030

Figure 62: East India Construction Chemicals Market Y-o-Y Growth By Product Type, 2024-2030

Figure 63: East India Construction Chemicals Market Attractiveness Analysis By Product Type, 2024-2030

Figure 64: East India Construction Chemicals Market Share and BPS Analysis by Application, 2024 & 2030

Figure 65: East India Construction Chemicals Market Y-o-Y Growth by Application, 2024-2030

Figure 66: East India Construction Chemicals Market Attractiveness Analysis by Application, 2024-2030

Figure 67: South India Construction Chemicals Market Share and BPS Analysis By Product Type, 2024 & 2030

Figure 68: South India Construction Chemicals Market Y-o-Y Growth By Product Type, 2024-2030

Figure 69: South India Construction Chemicals Market Attractiveness Analysis By Product Type, 2024-2030

Figure 70: South India Construction Chemicals Market Share and BPS Analysis by Application, 2024 & 2030

Figure 71: South India Construction Chemicals Market Y-o-Y Growth by Application, 2024-2030

Figure 72: South India Construction Chemicals Market Attractiveness Analysis by Application, 2024-2030

This site uses cookies, including third-party cookies, that help us to provide and improve our services. Privacy Policy
Google translate