

- Executive Summary
- Global Glycomic Therapeutics Market Snapshot, 2026 and 2033
- Market Opportunity Assessment, 2026 - 2033, US$ Mn
- Key Market Trends
- Future Market Projections
- Premium Market Insights
- Industry Developments and Key Market Events
- PMR Analysis and Recommendations
- Market Overview
- Market Scope and Definition
- Market Dynamics
- Drivers
- Restraints
- Opportunity
- Challenges
- Key Trends
- Macro-Economic Factors
- Global Sectorial Outlook
- Global GDP Growth Outlook
- COVID-19 Impact Analysis
- Forecast Factors - Relevance and Impact
- Value Added Insights
- Regulatory Landscape
- Product Adoption Analysis
- Value Chain Analysis
- Key Deals and Mergers
- PESTLE Analysis
- Porter’s Five Force Analysis
- Global Glycomic Therapeutics Market Outlook:
- Key Highlights
- Market Size (US$ Mn) and Y-o-Y Growth
- Absolute $ Opportunity
- Market Size (US$ Mn) Analysis and Forecast
- Historical Market Size (US$ Mn) Analysis, 2020-2025
- Market Size (US$ Mn) Analysis and Forecast, 2026-2033
- Global Glycomic Therapeutics Market Outlook: Class
- Introduction / Key Findings
- Historical Market Size (US$ Mn) Analysis, By Class, 2020-2025
- Market Size (US$ Mn) Analysis and Forecast, By Class, 2026-2033
- Isolated
- Synthetic
- Market Attractiveness Analysis: Class
- Global Glycomic Therapeutics Market Outlook: Structure
- Introduction / Key Findings
- Historical Market Size (US$ Mn) Analysis, By Structure, 2020-2025
- Market Size (US$ Mn) Analysis and Forecast, By Structure, 2026-2033
- Glycoproteins
- Targeting Sialic Acid
- Proteoglycans
- Targeting Glycosaminoglycans
- Targeting Glycosylphosphatidylinositol (GPI) - Anchored Proteins and Heparin Based Glycans
- Targeting Glycosphingolipids
- Others
- Market Attractiveness Analysis: Structure
- Global Glycomic Therapeutics Market Outlook: Indication
- Introduction / Key Findings
- Historical Market Size (US$ Mn) Analysis, By Indication, 2020-2025
- Market Size (US$ Mn) Analysis and Forecast, By Indication, 2026-2033
- Thrombosis and Chemoprophylaxis
- Anaemia
- Anti-adhesive and Anti-inflammatory
- Cataracts
- Gaucher’s disease
- Others
- Market Attractiveness Analysis: Indication
- Global Glycomic Therapeutics Market Outlook: Mode of Action
- Introduction / Key Findings
- Historical Market Size (US$ Mn) Analysis, By Mode of Action, 2020-2025
- Market Size (US$ Mn) Analysis and Forecast, By Mode of Action, 2026-2033
- Inhibits Neuraminidase
- Inhibits Heparanase and Selectins and Blocks Interactions between Growth Factors and Heparan Sulfate
- Erythropoietin and Enzyme Replacement Therapy
- Tissue Plasminogen Activator
- Others
- Market Attractiveness Analysis: Mode of Action
- Key Highlights
- Global Glycomic Therapeutics Market Outlook: Region
- Key Highlights
- Historical Market Size (US$ Mn) Analysis, By Region, 2020-2025
- Market Size (US$ Mn) Analysis and Forecast, By Region, 2026-2033
- North America
- Europe
- East Asia
- South Asia and Oceania
- Latin America
- Middle East & Africa
- Market Attractiveness Analysis: Region
- North America Glycomic Therapeutics Market Outlook:
- Key Highlights
- Historical Market Size (US$ Mn) Analysis, By Market, 2020-2025
- By Country
- By Class
- By Structure
- By Indication
- By Mode of Action
- Market Size (US$ Mn) Analysis and Forecast, By Country, 2026-2033
- U.S.
- Canada
- Market Size (US$ Mn) Analysis and Forecast, By Class, 2026-2033
- Isolated
- Synthetic
- Market Size (US$ Mn) Analysis and Forecast, By Indication, 2026-2033
- Glycoproteins
- Targeting Sialic Acid
- Proteoglycans
- Targeting Glycosaminoglycans
- Targeting Glycosylphosphatidylinositol (GPI) - Anchored Proteins and Heparin Based Glycans
- Targeting Glycosphingolipids
- Others
- Market Size (US$ Mn) Analysis and Forecast, By Structure, 2026-2033
- Thrombosis and Chemoprophylaxis
- Anaemia
- Anti-adhesive and Anti-inflammatory
- Cataracts
- Gaucher’s disease
- Others
- Market Size (US$ Mn) Analysis and Forecast, By Mode of Action, 2026-2033
- Inhibits Neuraminidase
- Inhibits Heparanase and Selectins and Blocks Interactions between Growth Factors and Heparan Sulfate
- Erythropoietin and Enzyme Replacement Therapy
- Tissue Plasminogen Activator
- Others
- Market Attractiveness Analysis
- Europe Glycomic Therapeutics Market Outlook:
- Key Highlights
- Historical Market Size (US$ Mn) Analysis, By Market, 2020-2025
- By Country
- By Class
- By Structure
- By Indication
- By Mode of Action
- Market Size (US$ Mn) Analysis and Forecast, By Country, 2026-2033
- Germany
- France
- U.K.
- Italy
- Spain
- Russia
- Rest of Europe
- Market Size (US$ Mn) Analysis and Forecast, By Class, 2026-2033
- Isolated
- Synthetic
- Market Size (US$ Mn) Analysis and Forecast, By Indication, 2026-2033
- Glycoproteins
- Targeting Sialic Acid
- Proteoglycans
- Targeting Glycosaminoglycans
- Targeting Glycosylphosphatidylinositol (GPI) - Anchored Proteins and Heparin Based Glycans
- Targeting Glycosphingolipids
- Others
- Market Size (US$ Mn) Analysis and Forecast, By Structure, 2026-2033
- Thrombosis and Chemoprophylaxis
- Anaemia
- Anti-adhesive and Anti-inflammatory
- Cataracts
- Gaucher’s disease
- Others
- Market Size (US$ Mn) Analysis and Forecast, By Mode of Action, 2026-2033
- Inhibits Neuraminidase
- Inhibits Heparanase and Selectins and Blocks Interactions between Growth Factors and Heparan Sulfate
- Erythropoietin and Enzyme Replacement Therapy
- Tissue Plasminogen Activator
- Others
- Market Attractiveness Analysis
- East Asia Glycomic Therapeutics Market Outlook:
- Key Highlights
- Historical Market Size (US$ Mn) Analysis, By Market, 2020-2025
- By Country
- By Class
- By Structure
- By Indication
- By Mode of Action
- Market Size (US$ Mn) Analysis and Forecast, By Country, 2026-2033
- China
- Japan
- South Korea
- Market Size (US$ Mn) Analysis and Forecast, By Class, 2026-2033
- Isolated
- Synthetic
- Market Size (US$ Mn) Analysis and Forecast, By Indication, 2026-2033
- Glycoproteins
- Targeting Sialic Acid
- Proteoglycans
- Targeting Glycosaminoglycans
- Targeting Glycosylphosphatidylinositol (GPI) - Anchored Proteins and Heparin Based Glycans
- Targeting Glycosphingolipids
- Others
- Market Size (US$ Mn) Analysis and Forecast, By Structure, 2026-2033
- Thrombosis and Chemoprophylaxis
- Anaemia
- Anti-adhesive and Anti-inflammatory
- Cataracts
- Gaucher’s disease
- Others
- Market Size (US$ Mn) Analysis and Forecast, By Mode of Action, 2026-2033
- Inhibits Neuraminidase
- Inhibits Heparanase and Selectins and Blocks Interactions between Growth Factors and Heparan Sulfate
- Erythropoietin and Enzyme Replacement Therapy
- Tissue Plasminogen Activator
- Others
- Market Attractiveness Analysis
- South Asia & Oceania Glycomic Therapeutics Market Outlook:
- Key Highlights
- Historical Market Size (US$ Mn) Analysis, By Market, 2020-2025
- By Country
- By Class
- By Structure
- By Indication
- By Mode of Action
- Market Size (US$ Mn) Analysis and Forecast, By Country, 2026-2033
- India
- Southeast Asia
- ANZ
- Rest of South Asia & Oceania
- Market Size (US$ Mn) Analysis and Forecast, By Class, 2026-2033
- Isolated
- Synthetic
- Market Size (US$ Mn) Analysis and Forecast, By Indication, 2026-2033
- Glycoproteins
- Targeting Sialic Acid
- Proteoglycans
- Targeting Glycosaminoglycans
- Targeting Glycosylphosphatidylinositol (GPI) - Anchored Proteins and Heparin Based Glycans
- Targeting Glycosphingolipids
- Others
- Market Size (US$ Mn) Analysis and Forecast, By Structure, 2026-2033
- Thrombosis and Chemoprophylaxis
- Anaemia
- Anti-adhesive and Anti-inflammatory
- Cataracts
- Gaucher’s disease
- Others
- Market Size (US$ Mn) Analysis and Forecast, By Mode of Action, 2026-2033
- Inhibits Neuraminidase
- Inhibits Heparanase and Selectins and Blocks Interactions between Growth Factors and Heparan Sulfate
- Erythropoietin and Enzyme Replacement Therapy
- Tissue Plasminogen Activator
- Others
- Market Attractiveness Analysis
- Latin America Glycomic Therapeutics Market Outlook:
- Key Highlights
- Historical Market Size (US$ Mn) Analysis, By Market, 2020-2025
- By Country
- By Class
- By Structure
- By Indication
- By Mode of Action
- Market Size (US$ Mn) Analysis and Forecast, By Country, 2026-2033
- Brazil
- Mexico
- Rest of Latin America
- Market Size (US$ Mn) Analysis and Forecast, By Class, 2026-2033
- Isolated
- Synthetic
- Market Size (US$ Mn) Analysis and Forecast, By Indication, 2026-2033
- Glycoproteins
- Targeting Sialic Acid
- Proteoglycans
- Targeting Glycosaminoglycans
- Targeting Glycosylphosphatidylinositol (GPI) - Anchored Proteins and Heparin Based Glycans
- Targeting Glycosphingolipids
- Others
- Market Size (US$ Mn) Analysis and Forecast, By Structure, 2026-2033
- Thrombosis and Chemoprophylaxis
- Anaemia
- Anti-adhesive and Anti-inflammatory
- Cataracts
- Gaucher’s disease
- Others
- Market Size (US$ Mn) Analysis and Forecast, By Mode of Action, 2026-2033
- Inhibits Neuraminidase
- Inhibits Heparanase and Selectins and Blocks Interactions between Growth Factors and Heparan Sulfate
- Erythropoietin and Enzyme Replacement Therapy
- Tissue Plasminogen Activator
- Others
- Market Attractiveness Analysis
- Middle East & Africa Glycomic Therapeutics Market Outlook:
- Key Highlights
- Historical Market Size (US$ Mn) Analysis, By Market, 2020-2025
- By Country
- By Class
- By Structure
- By Indication
- By Mode of Action
- Market Size (US$ Mn) Analysis and Forecast, By Country, 2026-2033
- GCC Countries
- Egypt
- South Africa
- Northern Africa
- Rest of Middle East & Africa
- Market Size (US$ Mn) Analysis and Forecast, By Class, 2026-2033
- Isolated
- Synthetic
- Market Size (US$ Mn) Analysis and Forecast, By Indication, 2026-2033
- Glycoproteins
- Targeting Sialic Acid
- Proteoglycans
- Targeting Glycosaminoglycans
- Targeting Glycosylphosphatidylinositol (GPI) - Anchored Proteins and Heparin Based Glycans
- Targeting Glycosphingolipids
- Others
- Market Size (US$ Mn) Analysis and Forecast, By Structure, 2026-2033
- Thrombosis and Chemoprophylaxis
- Anaemia
- Anti-adhesive and Anti-inflammatory
- Cataracts
- Gaucher’s disease
- Others
- Market Size (US$ Mn) Analysis and Forecast, By Mode of Action, 2026-2033
- Inhibits Neuraminidase
- Inhibits Heparanase and Selectins and Blocks Interactions between Growth Factors and Heparan Sulfate
- Erythropoietin and Enzyme Replacement Therapy
- Tissue Plasminogen Activator
- Others
- Market Attractiveness Analysis
- Competition Landscape
- Market Share Analysis, 2025
- Market Structure
- Competition Intensity Mapping By Market
- Competition Dashboard
- Company Profiles (Details - Overview, Financials, Strategy, Recent Developments)
- Intellihep Ltd
- Overview
- Segments and Products
- Key Financials
- Market Developments
- Market Strategy
- Protalix Biotherapeutics
- BioMarin Pharmaceutical Inc.
- Genzyme Corporation (Sanofi)
- Halozyme Therapeutics, Inc.
- Bayer AG
- Alzheon, Inc.
- GlycoMar
- GlaxoSmithKline plc
- Others
- Intellihep Ltd
- Appendix
- Research Methodology
- Research Assumptions
- Acronyms and Abbreviations


- Biotechnology
- Glycomic Therapeutics Market
Glycomic Therapeutics Market Size, Share, Growth, and Regional Forecast, 2026 to 2033
Glycomic Therapeutics Market by Class (Isolated, Synthetic), Structure (Glycoprotein, Targeting Sialic Acid, Proteoglycans, Targeting Glycosaminoglycans, Targeting Glycosylphosphatidylinositol (GPI) - Anchored Proteins and Heparin Based Glycans, Targeting Glycosphingolipids, Others), Indication (Thrombosis and Chemoprophylaxis, Anaemia, Anti-adhesive and Anti-inflammatory, Cataracts, Gaucher’s disease, Others) Mode of Action, and Regional Analysis from 2026 to 2033
Key Industry Highlights:
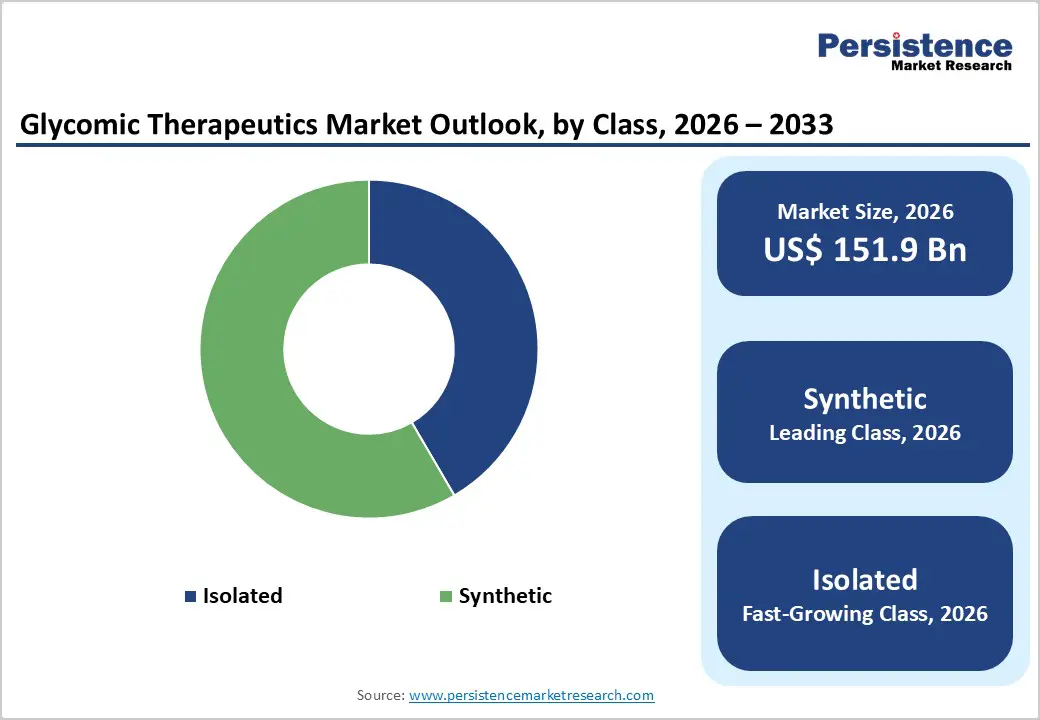
- Dominant Class: Synthetic glycan analogs account for about 58.4% of the market, driven by their scalable manufacturing, superior structural precision, and expanding use in enzyme modulation, receptor targeting, and glycobiology-based drug design, which supports consistent clinical and commercial uptake.
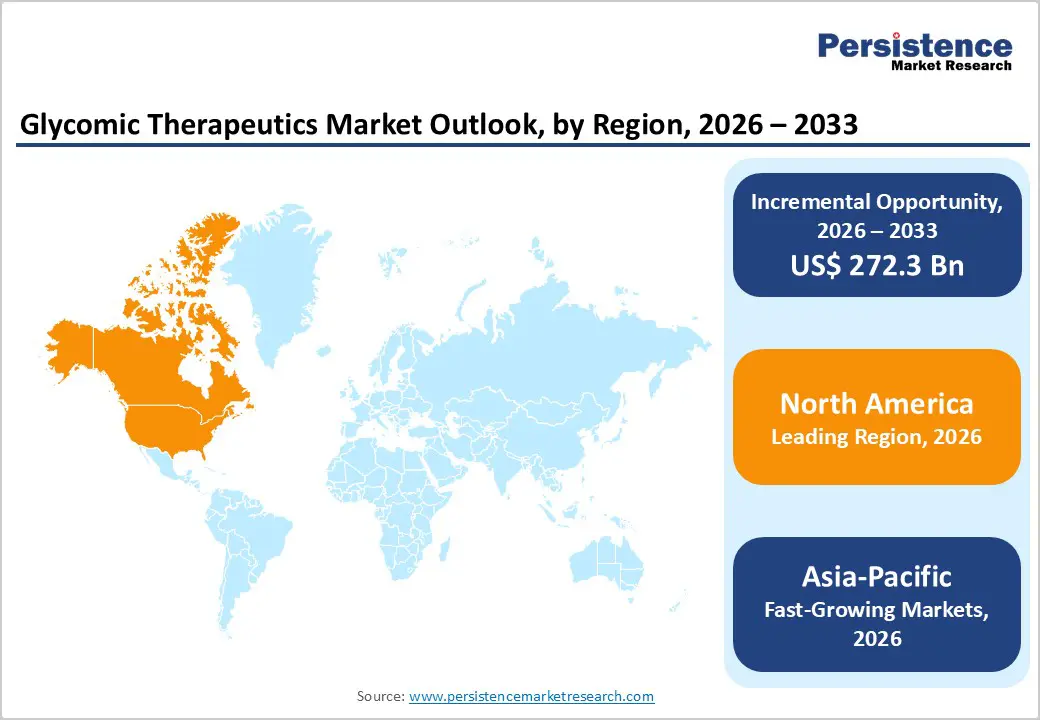
- Dominant Region: North America accounts for roughly 39.3% of global revenue, driven by advanced biotechnology ecosystems, strong regulatory support, high R&D spending, and extensive clinical trial activity focused on glycan-engineered therapeutics.
- Investment Plans: Asia-Pacific is the fastest-growing region, fueled by expanding biotechnology hubs, government-led innovation programs, rising academic-industry collaborations in glycomics, and increasing clinical trial capabilities across China, Japan, South Korea, and India.
- Growth Indicators: Rising prevalence of metabolic and oncologic diseases, rapid advancements in glycan analysis tools, expanding pipeline of glyco-engineered biologics, and strong interest from pharmaceutical companies in precision-targeted therapeutic platforms.
- Market Opportunity: Development of next-generation glycan-modifying enzymes, synthetic glycan libraries, AI-enabled glycomics discovery platforms, localized biomanufacturing, and expansion into emerging markets adopting advanced biologic therapies.
| Key Insights | Details |
|---|---|
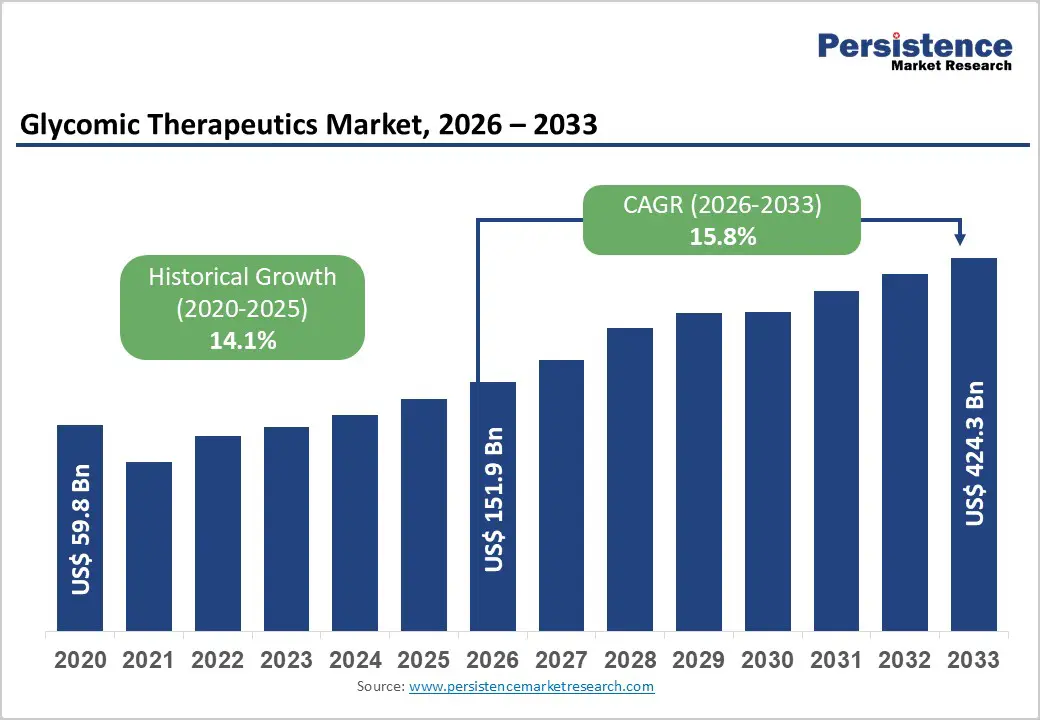
| Glycomic Therapeutics Market Size (2026E) | US$151.9 Bn |
| Market Value Forecast (2033F) | US$424.3 Bn |
| Projected Growth (CAGR 2026 to 2033) | 15.8% |
| Historical Market Growth (CAGR 2020 to 2025) | 14.1% |
Market Dynamics
Driver - Rising Burden of Cancer, Metabolic, and Rare Genetic Disorders
The rising burden of cancer, metabolic disorders, and rare genetic diseases is a major driver for the glycomic therapeutics market. Cancer cases continue to increase worldwide; for example, WHO data shows nearly 20 million new cancer cases in 2022, with projections expected to exceed 30 million annually by 2040. Metabolic diseases are also surging. The International Diabetes Federation reports that 537 million adults had diabetes in 2021, projected to reach 643 million by 2030, significantly increasing demand for advanced biologic and glycan-targeted treatments. Rare genetic disorders further amplify this need, with the WHO estimating 300 million people globally affected by more than 7,000 rare diseases, many lacking effective therapies. These conditions often involve glycosylation abnormalities, making glycan-targeted biologics, enzyme therapies, and synthetic glycomimetics highly relevant. As disease prevalence rises, so does the urgency for precise, mechanism-based glycomic therapeutics that can address complex molecular pathways.
Restraints - High Complexity of Glycan Structures and Biosynthesis
The high complexity of glycan structures and biosynthesis remains one of the strongest restraints in the glycomic therapeutics market. Unlike proteins or DNA, glycans are not directly template-driven; instead, cells generate hundreds of thousands of glycan structures through branching, variable linkages, and chemical modifications. Studies published in Biomolecules note that the human glycome may contain an immense diversity of structures, far exceeding what is currently mapped. This complexity arises from the action of more than 160 human glycosyltransferases, each contributing to specific steps in glycan assembly, as documented in the NIH Gene database. Further, global glycan databases still struggle to fully annotate existing structures. GlycomeDB reports that out of nearly 40,000 cataloged glycans, fewer than 15,000 have complete structural information, including linkage details. Such biosynthetic and analytical complexity significantly slows drug development, complicates standardization, increases manufacturing variability, and makes regulatory validation of glycomic therapeutics far more challenging.
Opportunity - Development of Next-Generation Synthetic Glycans and Glycan Analogs
The development of next-generation synthetic glycans and glycan analogs presents a significant opportunity for the glycomic therapeutics market, as synthetic constructs offer greater control over structure, purity, and functional specificity. Unlike natural glycans, which are highly heterogeneous, synthetic glycans can be produced with exact linkages and sequences, improving reproducibility and regulatory acceptance. A clear proof of concept is the synthetic pentasaccharide fondaparinux, an FDA-approved anticoagulant, demonstrating that fully synthetic glycan drugs can achieve clinical and commercial success. Scientific progress is accelerating: the U.S. National Center for Biotechnology Information (NCBI) reports that humans express more than 160 glycosyltransferases, enabling researchers to design chemoenzymatic pathways for highly defined glycan analogs. Additionally, chemical biology studies indicate the rapid expansion of synthetic glycan libraries and glycomimetic platforms targeting cancer, inflammation, and infectious diseases. As precision medicine grows, synthetic glycans provide scalable, customizable, and mechanistically targeted therapeutic options, positioning this category as one of the most promising future growth drivers in glycomics.
Category-wise Analysis
By Class Insights
Synthetic glycans accounted for 58.4% of the global market in 2024 because they provide structural homogeneity, scalable manufacturing, and clearer regulatory precedent than heterogeneous natural glycans. The FDA-approved synthetic pentasaccharide fondaparinux (Arixtra) shows that fully synthetic glycan drugs can achieve clinical and regulatory success. Chemoenzymatic and chemical synthesis permit exact linkage control and batch-to-batch consistency, improving potency and analytical comparability. Rapid advances in synthetic glycobiology and glycoengineering accelerate design and scale-up, while modern analytical platforms enable robust characterization. Researchers can exploit more than 200 human glycosyltransferases to engineer enzymatic routes for tailored glycan analogs, thereby enabling predictable synthesis pathways. By lowering manufacturing variability and easing quality control, synthetic approaches reduce development risk and cost, making the synthetic class the practical market leader.
By Structure Insights
Glycoproteins dominate the glycomic therapeutics market because they form the backbone of modern biologic therapies, with strong clinical adoption and regulatory familiarity. A majority of FDA-approved biologics are glycoprotein-based, including monoclonal antibodies, hormones, and enzyme replacement therapies. According to the U.S. FDA’s public biologics database, more than 70% of approved biologics contain glycoprotein structures, reflecting their therapeutic efficacy and established manufacturing pathways. Glycoproteins also enable precise receptor targeting and a longer serum half-life through controlled glycosylation, thereby improving efficacy. NIH literature further highlights that nearly 50% of all human proteins are naturally glycosylated, making glycoproteins biologically compatible and easier to integrate into therapeutic pathways. Their strong regulatory precedent, broad clinical utility, and scalable biomanufacturing make them the dominant structural class in glycomic therapeutics.
Regional Insights
North America Glycomic Therapeutics Market Trends
North America dominates the Glycomic therapeutics market, accounting for 39.3% of the market in 2024, owing to its robust biomedical research ecosystem, the highest biologics investment, and the most mature regulatory framework. The U.S. National Institutes of Health (NIH) receives over $47 billion annually, making it the world’s largest public funder of biomedical research, including glycoscience programs. The region also leads in clinical research capacity; ClinicalTrials.gov consistently hosts the largest number of global clinical trials, reflecting a robust infrastructure for developing glycan-targeted therapies. The U.S. FDA approves dozens of biologics each year, giving companies a clear and well-defined regulatory pathway. Additionally, major biopharmaceutical hubs such as Boston, San Francisco, and San Diego house advanced glycoengineering laboratories, GMP manufacturing facilities, and leading universities, creating an innovation cluster that drives regional market dominance.
Europe Glycomic Therapeutics Market Trends
Europe is an important region in the Glycomic therapeutics market because it has one of the world’s strongest biomedical research and regulatory ecosystems. The European Commission invests heavily in life sciences through programs such as Horizon Europe, which allocates over €95 billion to research and innovation, including advanced glycoscience, biotechnology, and therapeutic development. Europe also maintains a robust regulatory environment through the European Medicines Agency (EMA), which approved 89 new medicines in 2023, demonstrating strong capacity for biologics and glycan-based therapeutics. In addition, Europe hosts leading glycoscience centers in the UK, Germany, France, and the Netherlands, as well as established biomanufacturing clusters. The region’s strong academic-industry collaborations and government-backed innovation frameworks make it a critical market and development hub for glycomic therapeutics.
Asia Pacific Glycomic Therapeutics Market Trends
Asia-Pacific is the fastest-growing region in the Glycomic therapeutics market, driven by rapid expansion of biotechnology research capacity, clinical trial activity, and biologics manufacturing. Countries like China, Japan, South Korea, and India are investing heavily in life sciences. China’s government has increased its R&D spending to over 2.6% of GDP, according to the National Bureau of Statistics, supporting growth in glycoscience, biologics, and precision medicine. Japan continues to lead in glycobiology research, supported by public funding from the Japan Agency for Medical Research and Development (AMED). Clinical activity is rising as well. India now hosts over 35,000 registered clinical trials on the Clinical Trials Registry-India platform, reflecting expanding trial capacity. Combined with an increasing disease burden and growing demand for biologics, these factors position the Asia-Pacific region as the fastest-growing region for glycomic therapeutics.
Competitive Landscape
Leading companies in the Glycomic therapeutics market focus on glycan engineering, synthetic glycan innovation, and targeted biologic design. They invest in advanced glycoprotein optimization, scalable manufacturing, and strategic R&D partnerships to enhance therapeutic precision, reduce immunogenicity, and expand global pipelines. These efforts address the rising demand for mechanism-based treatments across oncology, metabolic disorders, and rare genetic diseases.
Key Industry Developments:
- In October 2025, Alberta’s glycomics research efforts received a significant boost following the announcement of a $2 million investment to strengthen the province’s biotechnology and therapeutic innovation capabilities. The funding was directed toward advancing glycan-focused drug development, supporting new research programs, and enhancing laboratory infrastructure
Companies Covered in Glycomic Therapeutics Market
- Intellihep Ltd
- Protalix Biotherapeutics
- BioMarin Pharmaceutical Inc.
- Genzyme Corporation (Sanofi)
- Halozyme Therapeutics, Inc.
- Bayer AG
- Alzheon, Inc.
- GlycoMar
- GlaxoSmithKline plc
- Others
Frequently Asked Questions
The global glycomic therapeutics market is projected to be valued at US$151.9 Bn in 2026.
Rising disease burden, glycan-targeted biologics growth, advances in glycoengineering, strong research funding, and expanding applications in oncology and rare disorders drive the market.
The global Glycomic therapeutics market is poised to witness a CAGR of 15.8% between 2026 and 2033.
Opportunities include synthetic glycan innovation, glycoengineered biologics, AI-driven glycomics, microbiome-glycan therapeutics, and expansion into emerging markets with growing biologics manufacturing.
Intellihep Ltd, Protalix Biotherapeutics, BioMarin Pharmaceutical Inc., Genzyme Corporation (Sanofi), Bayer AG, GlaxoSmithKline plc.


