


- Executive Summary
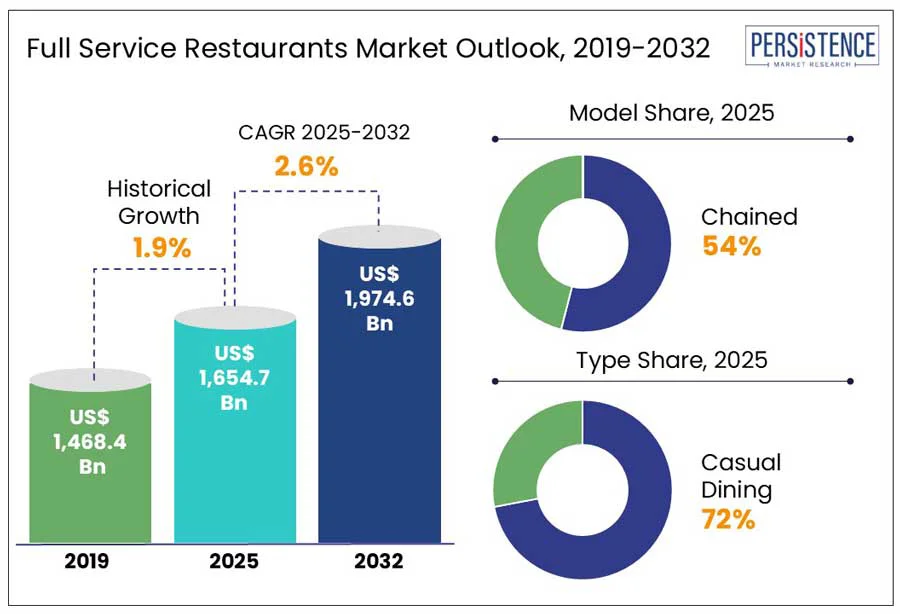
- Global Full Service Restaurants Market Snapshot, 2025 and 2032
- Market Opportunity Assessment, 2025 - 2032, US$ Bn
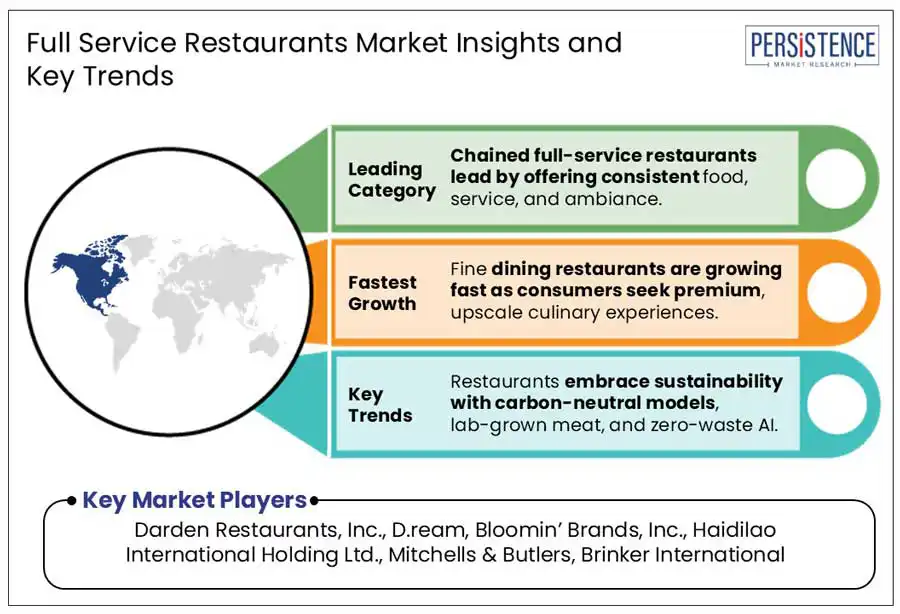
- Key Market Trends
- Future Market Projections
- Premium Market Insights
- Industry Developments and Key Market Events
- PMR Analysis and Recommendations
- Market Overview
- Market Scope and Definition
- Market Dynamics
- Drivers
- Restraints
- Opportunity
- Challenges
- Key Trends
- COVID-19 Impact Analysis
- Forecast Factors - Relevance and Impact
- Value Added Insights
- Key Market Players
- Consumer Behavior Analysis
- Regulatory Landscape
- PESTLE Analysis
- Porter’s Five Force Analysis
- Global Full Service Restaurants Market Outlook
- Market Size (US$ Bn) Analysis and Forecast
- Historical Market Size (US$ Bn) Analysis, 2019-2024
- Market Size (US$ Bn) Analysis and Forecast, 2025-2032
- Global Full Service Restaurants Market Outlook: Model
- Historical Market Size (US$ Bn) Analysis, By Model, 2019-2024
- Market Size (US$ Bn) Analysis and Forecast, By Model, 2025-2032
- Independent
- Chained
- Market Attractiveness Analysis: Model
- Global Full Service Restaurants Market Outlook: Type
- Historical Market Size (US$ Bn) Analysis, By Type, 2019-2024
- Market Size (US$ Bn) Analysis and Forecast, By Type, 2025-2032
- Casual Dining
- Fine Dining
- Market Attractiveness Analysis: Type
- Global Full Service Restaurants Market Outlook: Cuisine
- Historical Market Size (US$ Bn) Analysis, By Cuisine, 2019-2024
- Market Size (US$ Bn) Analysis and Forecast, By Cuisine, 2025-2032
- Italian
- Chinese
- Indian
- Japanese
- Korean
- Mexican
- Others
- Market Attractiveness Analysis: Cuisine
- Global Full Service Restaurants Market Outlook: Location
- Historical Market Size (US$ Bn) Analysis, By Location, 2019-2024
- Market Size (US$ Bn) Analysis and Forecast, By Location, 2025-2032
- Standalone
- Retail
- Leisure
- Hotels
- Others
- Market Attractiveness Analysis: Location
- Market Size (US$ Bn) Analysis and Forecast
- Global Full Service Restaurants Market Outlook: Region
- Historical Market Size (US$ Bn) Analysis, By Region, 2019-2024
- Market Size (US$ Bn) Analysis and Forecast, By Region, 2025-2032
- North America
- Latin America
- Europe
- East Asia
- South Asia and Oceania
- Middle East & Africa
- Market Attractiveness Analysis: Region
- North America Full Service Restaurants Market Outlook
- Historical Market Size (US$ Bn) Analysis, By Market, 2019-2024
- By Country
- By Model
- By Type
- By Cuisine
- By Location
- Market Size (US$ Bn) Analysis and Forecast, By Country, 2025-2032
- U.S.
- Canada
- Market Size (US$ Bn) Analysis and Forecast, By Model, 2025-2032
- Independent
- Chained
- Market Size (US$ Bn) Analysis and Forecast, By Type, 2025-2032
- Casual Dining
- Fine Dining
- Market Size (US$ Bn) Analysis and Forecast, By Cuisine, 2025-2032
- Italian
- Chinese
- Indian
- Japanese
- Korean
- Mexican
- Others
- Market Size (US$ Bn) Analysis and Forecast, By Location, 2025-2032
- Standalone
- Retail
- Leisure
- Hotels
- Others
- Market Attractiveness Analysis
- Historical Market Size (US$ Bn) Analysis, By Market, 2019-2024
- Europe Full Service Restaurants Market Outlook
- Historical Market Size (US$ Bn) Analysis, By Market, 2019-2024
- By Country
- By Model
- By Type
- By Cuisine
- By Location
- Market Size (US$ Bn) Analysis and Forecast, By Country, 2025-2032
- Germany
- France
- U.K.
- Italy
- Spain
- Russia
- Rest of Europe
- Market Size (US$ Bn) Analysis and Forecast, By Model, 2025-2032
- Independent
- Chained
- Market Size (US$ Bn) Analysis and Forecast, By Type, 2025-2032
- Casual Dining
- Fine Dining
- Market Size (US$ Bn) Analysis and Forecast, By Cuisine, 2025-2032
- Italian
- Chinese
- Indian
- Japanese
- Korean
- Mexican
- Others
- Market Size (US$ Bn) Analysis and Forecast, By Location, 2025-2032
- Standalone
- Retail
- Leisure
- Hotels
- Others
- Market Attractiveness Analysis
- Historical Market Size (US$ Bn) Analysis, By Market, 2019-2024
- East Asia Full Service Restaurants Market Outlook
- Historical Market Size (US$ Bn) Analysis, By Market, 2019-2024
- By Country
- By Model
- By Type
- By Cuisine
- By Location
- Market Size (US$ Bn) Analysis and Forecast, By Country, 2025-2032
- China
- Japan
- South Korea
- Market Size (US$ Bn) Analysis and Forecast, By Model, 2025-2032
- Independent
- Chained
- Market Size (US$ Bn) Analysis and Forecast, By Type, 2025-2032
- Casual Dining
- Fine Dining
- Market Size (US$ Bn) Analysis and Forecast, By Cuisine, 2025-2032
- Italian
- Chinese
- Indian
- Japanese
- Korean
- Mexican
- Others
- Market Size (US$ Bn) Analysis and Forecast, By Location, 2025-2032
- Standalone
- Retail
- Leisure
- Hotels
- Others
- Market Attractiveness Analysis
- Historical Market Size (US$ Bn) Analysis, By Market, 2019-2024
- South Asia & Oceania Full Service Restaurants Market Outlook
- Historical Market Size (US$ Bn) Analysis, By Market, 2019-2024
- By Country
- By Model
- By Type
- By Cuisine
- By Location
- Market Size (US$ Bn) Analysis and Forecast, By Country, 2025-2032
- India
- Indonesia
- Thailand
- Singapore
- ANZ
- Rest of South Asia & Oceania
- Market Size (US$ Bn) Analysis and Forecast, By Model, 2025-2032
- Independent
- Chained
- Market Size (US$ Bn) Analysis and Forecast, By Type, 2025-2032
- Casual Dining
- Fine Dining
- Market Size (US$ Bn) Analysis and Forecast, By Cuisine, 2025-2032
- Italian
- Chinese
- Indian
- Japanese
- Korean
- Mexican
- Others
- Market Size (US$ Bn) Analysis and Forecast, By Location, 2025-2032
- Standalone
- Retail
- Leisure
- Hotels
- Others
- Market Attractiveness Analysis
- Historical Market Size (US$ Bn) Analysis, By Market, 2019-2024
- Latin America Full Service Restaurants Market Outlook
- Historical Market Size (US$ Bn) Analysis, By Market, 2019-2024
- By Country
- By Model
- By Type
- By Cuisine
- By Location
- Market Size (US$ Bn) Analysis and Forecast, By Country, 2025-2032
- Brazil
- Mexico
- Rest of Latin America
- Market Size (US$ Bn) Analysis and Forecast, By Model, 2025-2032
- Independent
- Chained
- Market Size (US$ Bn) Analysis and Forecast, By Type, 2025-2032
- Casual Dining
- Fine Dining
- Market Size (US$ Bn) Analysis and Forecast, By Cuisine, 2025-2032
- Italian
- Chinese
- Indian
- Japanese
- Korean
- Mexican
- Others
- Market Size (US$ Bn) Analysis and Forecast, By Location, 2025-2032
- Standalone
- Retail
- Leisure
- Hotels
- Others
- Market Attractiveness Analysis
- Historical Market Size (US$ Bn) Analysis, By Market, 2019-2024
- Middle East & Africa Full Service Restaurants Market Outlook
- Historical Market Size (US$ Bn) Analysis, By Market, 2019-2024
- By Country
- By Model
- By Type
- By Cuisine
- By Location
- Market Size (US$ Bn) Analysis and Forecast, By Country, 2025-2032
- GCC Countries
- Egypt
- South Africa
- Northern Africa
- Rest of Middle East & Africa
- Market Size (US$ Bn) Analysis and Forecast, By Model, 2025-2032
- Independent
- Chained
- Market Size (US$ Bn) Analysis and Forecast, By Type, 2025-2032
- Casual Dining
- Fine Dining
- Market Size (US$ Bn) Analysis and Forecast, By Cuisine, 2025-2032
- Italian
- Chinese
- Indian
- Japanese
- Korean
- Mexican
- Others
- Market Size (US$ Bn) Analysis and Forecast, By Location, 2025-2032
- Standalone
- Retail
- Leisure
- Hotels
- Others
- Market Attractiveness Analysis
- Historical Market Size (US$ Bn) Analysis, By Market, 2019-2024
- Competition Landscape
- Market Share Analysis, 2024
- Market Structure
- Competition Dashboard
- Tier Analysis
- Company Profiles (Details - Overview, Financials, Strategy, Recent Developments)
- Darden Restaurants, Inc.
- Overview
- Segments and Cuisine
- Key Financials
- Market Developments
- Market Strategy
- D.ream
- Bloomin’ Brands, Inc.
- Haidilao International Holding Ltd.
- The Indian Hotels Company Limited
- Compass Group
- Dine Brands Global
- TGI Fridays
- TCF Co. LLC.
- Mitchells & Butlers
- TGI Fridays
- Saravanaa Bhavan
- Brinker International
- Nando's Chickenland Ltd
- Barbeque Nation Hospitality Limited
- Others
- Others
- Darden Restaurants, Inc.
- Appendix
- Research Methodology
- Research Assumptions
- Acronyms and Abbreviations

Loading page data
Please wait a moment


