


- Executive Summary
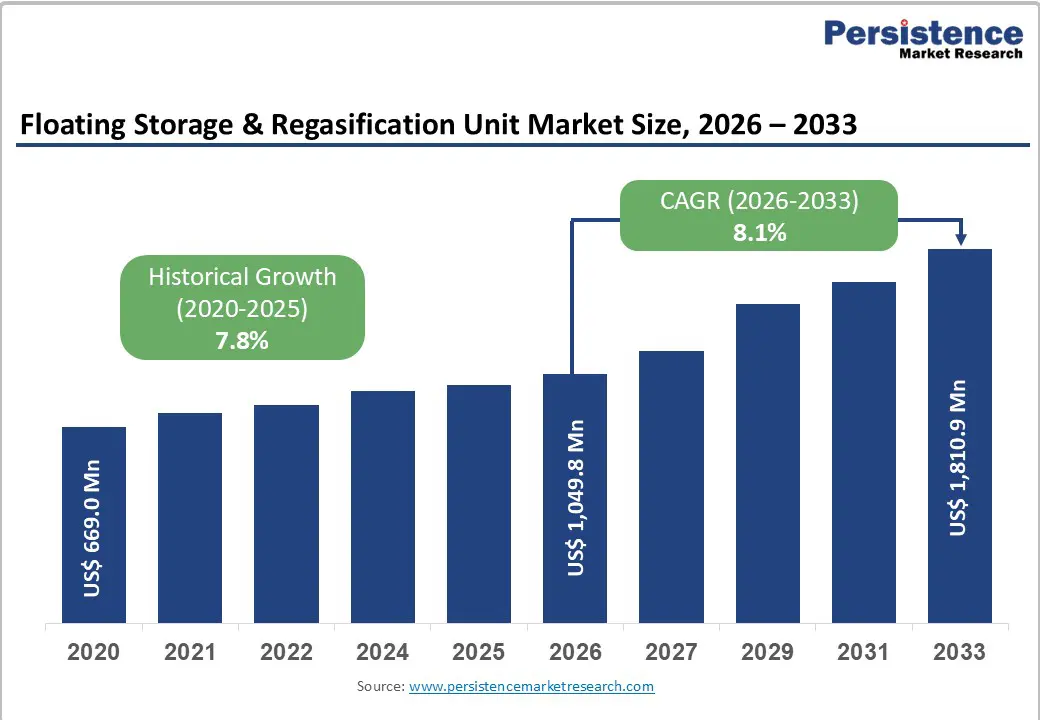
- Global Floating Storage & Regasification Unit Market Snapshot 2026 and 2033
- Market Opportunity Assessment, 2026 - 2033, US$ Mn
- Key Market Trends
- Industry Developments and Key Market Events
- Demand Side and Supply Side Analysis
- PMR Analysis and Recommendations
- Market Overview
- Market Scope and Definitions
- Market Dynamics
- Driver
- Restraint
- Opportunities
- Trends
- Macro-Economic Factors
- Global GDP Outlook
- Global Prison Growth Outlook
- Global Crime Rates by Country
- Global Prison Population by Country
- Global Private Prison Market Growth Outlook
- Other Macro-economic Factors
- Forecast Factors - Relevance and Impact
- COVID-19 Impact Assessment
- Value Added Insights
- Value Chain analysis
- Key Market Players
- Product Adoption Analysis
- Key Promotional Strategies by key players
- PESTLE Analysis
- Porter's Five Forces Analysis
- Regulatory and Technology Landscape
- Price Trend Analysis, 2025
- Region-wise Price Analysis
- Price by Segments
- Price Impact Factors
- Global Floating Storage & Regasification Unit Market Outlook: Historical (2020 - 2025) and Forecast (2026 - 2033)
- Key Highlights
- Global Floating Storage & Regasification Unit Market Outlook: Construction Type
- Introduction/Key Findings
- Historical Market Size (US$ Mn) and Volume (Units) Analysis by Construction Type, 2020-2025
- Current Market Size (US$ Mn) and Volume (Units) Forecast, by Construction Type, 2026-2033
- New Build FSRUs
- Converted FSRUs
- Market Attractiveness Analysis: Construction Type
- Global Floating Storage & Regasification Unit Market Outlook: Storage Capacity
- Introduction/Key Findings
- Historical Market Size (US$ Mn) and Volume (Units) Analysis by Storage Capacity, 2020-2025
- Current Market Size (US$ Mn) and Volume (Units) Forecast, by Storage Capacity, 2026-2033
- < 150,000 m³
- 150,000 - 180,000 m³
- > 180,000 m³
- Market Attractiveness Analysis: Storage Capacity
- Global Floating Storage & Regasification Unit Market Outlook: Deployment Type
- Introduction/Key Findings
- Historical Market Size (US$ Mn) and Volume (Units) Analysis by Deployment Type, 2020-2025
- Current Market Size (US$ Mn) and Volume (Units) Forecast, by Deployment Type, 2026-2033
- Fixed Mooring
- Multi-Point Mooring
- Near-shore
- Market Attractiveness Analysis: Deployment Type
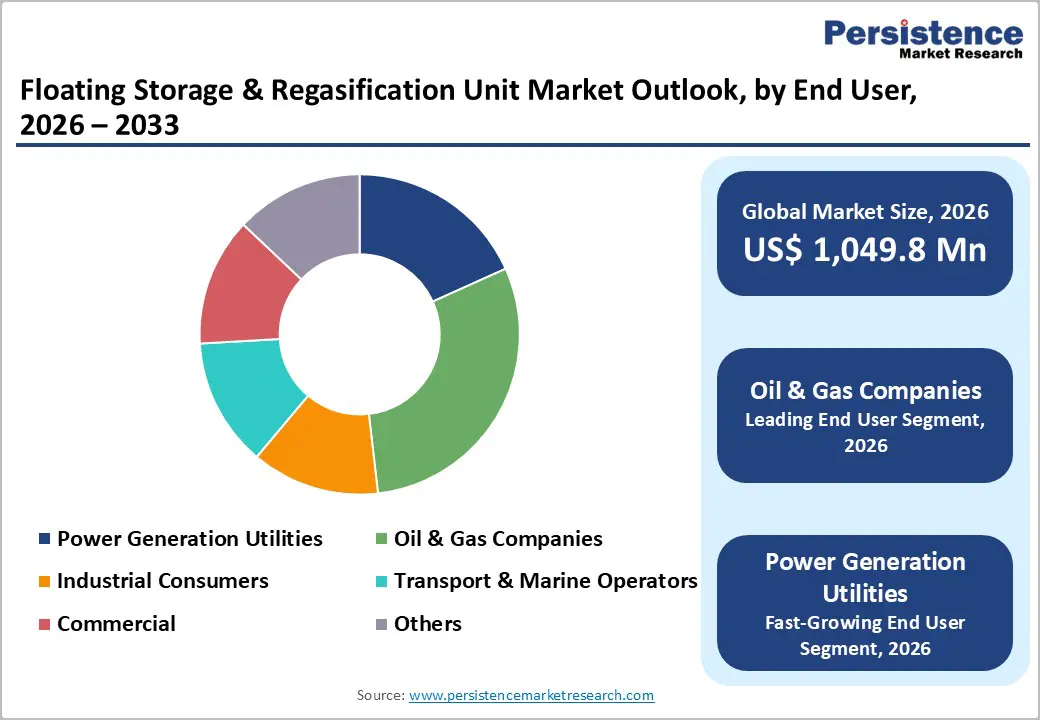
- Global Floating Storage & Regasification Unit Market Outlook: End User
- Introduction/Key Findings
- Historical Market Size (US$ Mn) and Volume (Units) Analysis by End User, 2020-2025
- Current Market Size (US$ Mn) and Volume (Units) Forecast, by End User, 2026-2033
- Power Generation Utilities
- Oil & Gas Companies
- Industrial Consumers
- Transport & Marine Operators
- Commercial
- Others
- Market Attractiveness Analysis: End User
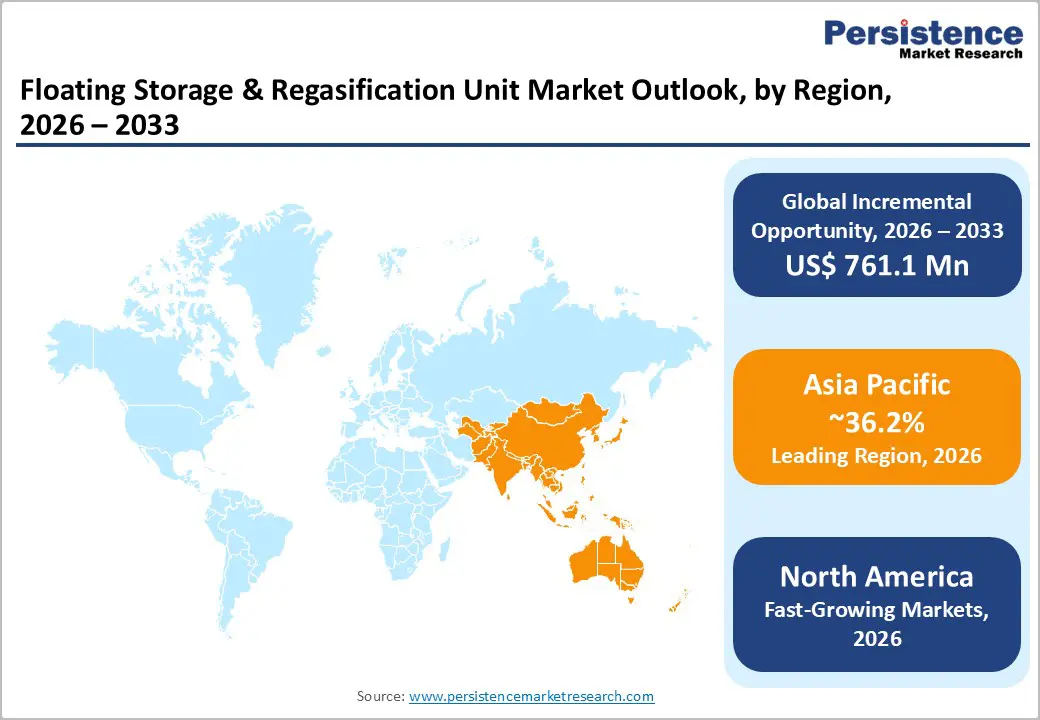
- Global Floating Storage & Regasification Unit Market Outlook: Region
- Key Highlights
- Historical Market Size (US$ Mn) and Volume (Units) Analysis by Region, 2020-2025
- Current Market Size (US$ Mn) and Volume (Units) Forecast, by Region, 2026-2033
- North America
- Europe
- East Asia
- South Asia & Oceania
- Latin America
- Middle East & Africa
- Market Attractiveness Analysis: Region
- North America Floating Storage & Regasification Unit Market Outlook: Historical (2020 - 2025) and Forecast (2026 - 2033)
- Key Highlights
- Pricing Analysis
- North America Market Size (US$ Mn) and Volume (Units) Forecast, by Country, 2026-2033
- U.S.
- Canada
- North America Market Size (US$ Mn) and Volume (Units) Forecast, by Construction Type, 2026-2033
- New Build FSRUs
- Converted FSRUs
- North America Market Size (US$ Mn) and Volume (Units) Forecast, by Storage Capacity, 2026-2033
- < 150,000 m³
- 150,000 - 180,000 m³
- > 180,000 m³
- North America Market Size (US$ Mn) and Volume (Units) Forecast, by Deployment Type, 2026-2033
- Fixed Mooring
- Multi-Point Mooring
- Near-shore
- North America Market Size (US$ Mn) and Volume (Units) Forecast, by End User, 2026-2033
- Power Generation Utilities
- Oil & Gas Companies
- Industrial Consumers
- Transport & Marine Operators
- Commercial
- Others
- Europe Floating Storage & Regasification Unit Market Outlook: Historical (2020 - 2025) and Forecast (2026 - 2033)
- Key Highlights
- Pricing Analysis
- Europe Market Size (US$ Mn) and Volume (Units) Forecast, by Country, 2026-2033
- Germany
- Italy
- France
- U.K.
- Spain
- Russia
- Rest of Europe
- Europe Market Size (US$ Mn) and Volume (Units) Forecast, by Construction Type, 2026-2033
- New Build FSRUs
- Converted FSRUs
- Europe Market Size (US$ Mn) and Volume (Units) Forecast, by Storage Capacity, 2026-2033
- < 150,000 m³
- 150,000 - 180,000 m³
- > 180,000 m³
- Europe Market Size (US$ Mn) and Volume (Units) Forecast, by Deployment Type, 2026-2033
- Fixed Mooring
- Multi-Point Mooring
- Near-shore
- Europe Market Size (US$ Mn) and Volume (Units) Forecast, by End User, 2026-2033
- Power Generation Utilities
- Oil & Gas Companies
- Industrial Consumers
- Transport & Marine Operators
- Commercial
- Others
- East Asia Floating Storage & Regasification Unit Market Outlook: Historical (2020 - 2025) and Forecast (2026 - 2033)
- Key Highlights
- Pricing Analysis
- East Asia Market Size (US$ Mn) and Volume (Units) Forecast, by Country, 2026-2033
- China
- Japan
- South Korea
- East Asia Market Size (US$ Mn) and Volume (Units) Forecast, by Construction Type, 2026-2033
- New Build FSRUs
- Converted FSRUs
- East Asia Market Size (US$ Mn) and Volume (Units) Forecast, by Storage Capacity, 2026-2033
- < 150,000 m³
- 150,000 - 180,000 m³
- > 180,000 m³
- East Asia Market Size (US$ Mn) and Volume (Units) Forecast, by Deployment Type, 2026-2033
- Fixed Mooring
- Multi-Point Mooring
- Near-shore
- East Asia Market Size (US$ Mn) and Volume (Units) Forecast, by End User, 2026-2033
- Power Generation Utilities
- Oil & Gas Companies
- Industrial Consumers
- Transport & Marine Operators
- Commercial
- Others
- South Asia & Oceania Floating Storage & Regasification Unit Market Outlook: Historical (2020 - 2025) and Forecast (2026 - 2033)
- Key Highlights
- Pricing Analysis
- South Asia & Oceania Market Size (US$ Mn) and Volume (Units) Forecast, by Country, 2026-2033
- India
- Southeast Asia
- ANZ
- Rest of SAO
- South Asia & Oceania Market Size (US$ Mn) and Volume (Units) Forecast, by Construction Type, 2026-2033
- New Build FSRUs
- Converted FSRUs
- South Asia & Oceania Market Size (US$ Mn) and Volume (Units) Forecast, by Storage Capacity, 2026-2033
- < 150,000 m³
- 150,000 - 180,000 m³
- > 180,000 m³
- South Asia & Oceania Market Size (US$ Mn) and Volume (Units) Forecast, by Deployment Type, 2026-2033
- Fixed Mooring
- Multi-Point Mooring
- Near-shore
- South Asia & Oceania Market Size (US$ Mn) and Volume (Units) Forecast, by End User, 2026-2033
- Power Generation Utilities
- Oil & Gas Companies
- Industrial Consumers
- Transport & Marine Operators
- Commercial
- Others
- Latin America Floating Storage & Regasification Unit Market Outlook: Historical (2020 - 2025) and Forecast (2026 - 2033)
- Key Highlights
- Pricing Analysis
- Latin America Market Size (US$ Mn) and Volume (Units) Forecast, by Country, 2026-2033
- Brazil
- Mexico
- Rest of LATAM
- Latin America Market Size (US$ Mn) and Volume (Units) Forecast, by Construction Type, 2026-2033
- New Build FSRUs
- Converted FSRUs
- Latin America Market Size (US$ Mn) and Volume (Units) Forecast, by Storage Capacity, 2026-2033
- < 150,000 m³
- 150,000 - 180,000 m³
- > 180,000 m³
- Latin America Market Size (US$ Mn) and Volume (Units) Forecast, by Deployment Type, 2026-2033
- Fixed Mooring
- Multi-Point Mooring
- Near-shore
- Latin America Market Size (US$ Mn) and Volume (Units) Forecast, by End User, 2026-2033
- Power Generation Utilities
- Oil & Gas Companies
- Industrial Consumers
- Transport & Marine Operators
- Commercial
- Others
- Middle East & Africa Floating Storage & Regasification Unit Market Outlook: Historical (2020 - 2025) and Forecast (2026 - 2033)
- Key Highlights
- Pricing Analysis
- Middle East & Africa Market Size (US$ Mn) and Volume (Units) Forecast, by Country, 2026-2033
- GCC Countries
- South Africa
- Northern Africa
- Rest of MEA
- Middle East & Africa Market Size (US$ Mn) and Volume (Units) Forecast, by Construction Type, 2026-2033
- New Build FSRUs
- Converted FSRUs
- Middle East & Africa Market Size (US$ Mn) and Volume (Units) Forecast, by Storage Capacity, 2026-2033
- < 150,000 m³
- 150,000 - 180,000 m³
- > 180,000 m³
- Middle East & Africa Market Size (US$ Mn) and Volume (Units) Forecast, by Deployment Type, 2026-2033
- Fixed Mooring
- Multi-Point Mooring
- Near-shore
- Middle East & Africa Market Size (US$ Mn) and Volume (Units) Forecast, by End User, 2026-2033
- Power Generation Utilities
- Oil & Gas Companies
- Industrial Consumers
- Transport & Marine Operators
- Commercial
- Others
- Competition Landscape
- Market Share Analysis, 2025
- Market Structure
- Competition Intensity Mapping
- Competition Dashboard
- Company Profiles
- Höegh LNG Holdings Ltd.
- Company Overview
- Product Portfolio/Offerings
- Key Financials
- SWOT Analysis
- Company Strategy and Key Developments
- Excelerate Energy Inc.
- Golar LNG Limited
- BW Gas Limited
- Exmar NV
- Samsung Heavy Industries Co., Ltd.
- Hyundai Heavy Industries Co., Ltd.
- Daewoo Shipbuilding & Marine Engineering Ocean
- Hudong-Zhonghua Shipbuilding
- Keppel Offshore & Marine
- Seatrium
- Mitsui O.S.K. Lines
- Kawasaki Heavy Industries, Ltd.
- Maran Gas Maritime
- New Fortress Energy
- Höegh LNG Holdings Ltd.
- Appendix
- Research Methodology
- Research Assumptions
- Acronyms and Abbreviations

Loading page data
Please wait a moment


