

- Executive Summary
- Global Fibromyalgia Antidepressants Market Snapshot 2026 and 2033
- Market Opportunity Assessment, 2026-2033, US$ Mn
- Key Market Trends
- Industry Developments and Key Market Events
- Demand Side and Supply Side Analysis
- PMR Analysis and Recommendations
- Market Overview
- Market Scope and Definitions
- Market Dynamics
- Driver
- Restraint
- Opportunities
- Trends
- Macro-Economic Factors
- Global GDP Outlook
- Global Healthcare Expenditure
- Forecast Factors – Relevance and Impact
- COVID-19 Impact Assessment
- Value Added Insights
- Value Chain analysis
- Key Market Players
- Product Adoption Analysis
- Key Promotional Strategies by key players
- PESTLE Analysis
- Porter's Five Forces Analysis
- Regulatory and Technology Landscape
- Global Fibromyalgia Antidepressants Market Outlook: Historical (2020 – 2025) and Forecast (2026 – 2033)
- Key Highlights
- Global Fibromyalgia Antidepressants Market Outlook: Drug Type
- Introduction/Key Findings
- Historical Market Size (US$ Mn) Analysis by Drug Type, 2020-2025
- Current Market Size (US$ Mn) Forecast, by Drug Type, 2026-2033
- SNRIs
- SSRIs
- TCAs
- Atypical
- Market Attractiveness Analysis: Drug Type
- Global Fibromyalgia Antidepressants Market Outlook: Route of Administration
- Introduction/Key Findings
- Historical Market Size (US$ Mn) Analysis by Route of Administration, 2020-2025
- Current Market Size (US$ Mn) Forecast, by Route of Administration, 2026-2033
- Oral (pills)
- Injectable
- Transdermal / Patches
- Market Attractiveness Analysis: Route of Administration
- Global Fibromyalgia Antidepressants Market Outlook: Distribution Channel
- Introduction/Key Findings
- Historical Market Size (US$ Mn) Analysis by Distribution Channel, 2020-2025
- Current Market Size (US$ Mn) Forecast, by Distribution Channel, 2026-2033
- Hospital pharmacies
- Retail pharmacies
- Online pharmacies
- Market Attractiveness Analysis: Distribution Channel
- Global Fibromyalgia Antidepressants Market Outlook: Region
- Key Highlights
- Historical Market Size (US$ Mn) Analysis by Region, 2020-2025
- Current Market Size (US$ Mn) Forecast, by Region, 2026-2033
- North America
- Europe
- East Asia
- South Asia & Oceania
- Latin America
- Middle East & Africa
- Market Attractiveness Analysis: Region
- North America Fibromyalgia Antidepressants Market Outlook: Historical (2020 – 2025) and Forecast (2026 – 2033)
- Key Highlights
- North America Market Size (US$ Mn) Forecast, by Country, 2026-2033
- U.S.
- Canada
- North America Market Size (US$ Mn) Forecast, by Drug Type, 2026-2033
- SNRIs
- SSRIs
- TCAs
- Atypical
- North America Market Size (US$ Mn) Forecast, by Route of Administration, 2026-2033
- Oral (pills)
- Injectable
- Transdermal / Patches
- North America Market Size (US$ Mn) Forecast, by Distribution Channel, 2026-2033
- Hospital pharmacies
- Retail pharmacies
- Online pharmacies
- Europe Fibromyalgia Antidepressants Market Outlook: Historical (2020 – 2025) and Forecast (2026 – 2033)
- Key Highlights
- Europe Market Size (US$ Mn) Forecast, by Country, 2026-2033
- Germany
- Italy
- France
- U.K.
- Spain
- Russia
- Rest of Europe
- Europe Market Size (US$ Mn) Forecast, by Drug Type, 2026-2033
- SNRIs
- SSRIs
- TCAs
- Atypical
- Europe Market Size (US$ Mn) Forecast, by Route of Administration, 2026-2033
- Oral (pills)
- Injectable
- Transdermal / Patches
- Europe Market Size (US$ Mn) Forecast, by Distribution Channel, 2026-2033
- Hospital pharmacies
- Retail pharmacies
- Online pharmacies
- East Asia Fibromyalgia Antidepressants Market Outlook: Historical (2020 – 2025) and Forecast (2026 – 2033)
- Key Highlights
- East Asia Market Size (US$ Mn) Forecast, by Country, 2026-2033
- China
- Japan
- South Korea
- East Asia Market Size (US$ Mn) Forecast, by Drug Type, 2026-2033
- SNRIs
- SSRIs
- TCAs
- Atypical
- East Asia Market Size (US$ Mn) Forecast, by Route of Administration, 2026-2033
- Oral (pills)
- Injectable
- Transdermal / Patches
- East Asia Market Size (US$ Mn) Forecast, by Distribution Channel, 2026-2033
- Hospital pharmacies
- Retail pharmacies
- Online pharmacies
- South Asia & Oceania Fibromyalgia Antidepressants Market Outlook: Historical (2020 – 2025) and Forecast (2026 – 2033)
- Key Highlights
- South Asia & Oceania Market Size (US$ Mn) Forecast, by Country, 2026-2033
- India
- Southeast Asia
- ANZ
- Rest of SAO
- South Asia & Oceania Market Size (US$ Mn) Forecast, by Drug Type, 2026-2033
- SNRIs
- SSRIs
- TCAs
- Atypical
- South Asia & Oceania Market Size (US$ Mn) Forecast, by Route of Administration, 2026-2033
- Oral (pills)
- Injectable
- Transdermal / Patches
- South Asia & Oceania Market Size (US$ Mn) Forecast, by Distribution Channel, 2026-2033
- Hospital pharmacies
- Retail pharmacies
- Online pharmacies
- Latin America Fibromyalgia Antidepressants Market Outlook: Historical (2020 – 2025) and Forecast (2026 – 2033)
- Key Highlights
- Latin America Market Size (US$ Mn) Forecast, by Country, 2026-2033
- Brazil
- Mexico
- Rest of LATAM
- Latin America Market Size (US$ Mn) Forecast, by Drug Type, 2026-2033
- SNRIs
- SSRIs
- TCAs
- Atypical
- Latin America Market Size (US$ Mn) Forecast, by Route of Administration, 2026-2033
- Oral (pills)
- Injectable
- Transdermal / Patches
- Latin America Market Size (US$ Mn) Forecast, by Distribution Channel, 2026-2033
- Hospital pharmacies
- Retail pharmacies
- Online pharmacies
- Middle East & Africa Fibromyalgia Antidepressants Market Outlook: Historical (2020 – 2025) and Forecast (2026 – 2033)
- Key Highlights
- Middle East & Africa Market Size (US$ Mn) Forecast, by Country, 2026-2033
- GCC Countries
- South Africa
- Northern Africa
- Rest of MEA
- Middle East & Africa Market Size (US$ Mn) Forecast, by Drug Type, 2026-2033
- SNRIs
- SSRIs
- TCAs
- Atypical
- Middle East & Africa Market Size (US$ Mn) Forecast, by Route of Administration, 2026-2033
- Oral (pills)
- Injectable
- Transdermal / Patches
- Middle East & Africa Market Size (US$ Mn) Forecast, by Distribution Channel, 2026-2033
- Hospital pharmacies
- Retail pharmacies
- Online pharmacies
- Competition Landscape
- Market Share Analysis, 2025
- Market Structure
- Competition Intensity Mapping
- Competition Dashboard
- Company Profiles
- Pfizer, Inc.
- Company Overview
- Product Portfolio/Offerings
- Key Financials
- SWOT Analysis
- Company Strategy and Key Developments
- Eli Lilly and Company
- AbbVie, Inc.
- Teva Pharmaceutical Industries Ltd.
- Johnson & Johnson Services, Inc.
- Sanofi S.A.
- GlaxoSmithKline plc
- Bayer AG
- TONIX Pharmaceuticals Holdings Corp.
- Virios Therapeutics, Inc.
- Aptinyx Inc.
- FSD Pharma
- Pfizer, Inc.
- Appendix
- Research Methodology
- Research Assumptions
- Acronyms and Abbreviations


- Pharmaceuticals
- Fibromyalgia Antidepressants Market
Fibromyalgia Antidepressants Market Size, Share, and Growth Forecast 2026 - 2033
Fibromyalgia Antidepressants Market by Drug Type (SNRIs, SSRIs, TCAs, Atypical), by Route of Administration (Oral (pills), Injectable, Transdermal / Patches), by Distribution Channel (Hospital pharmacies, Retail pharmacies, Online pharmacies), by Regional Analysis, 2026-2033
Fibromyalgia Antidepressants Market Size
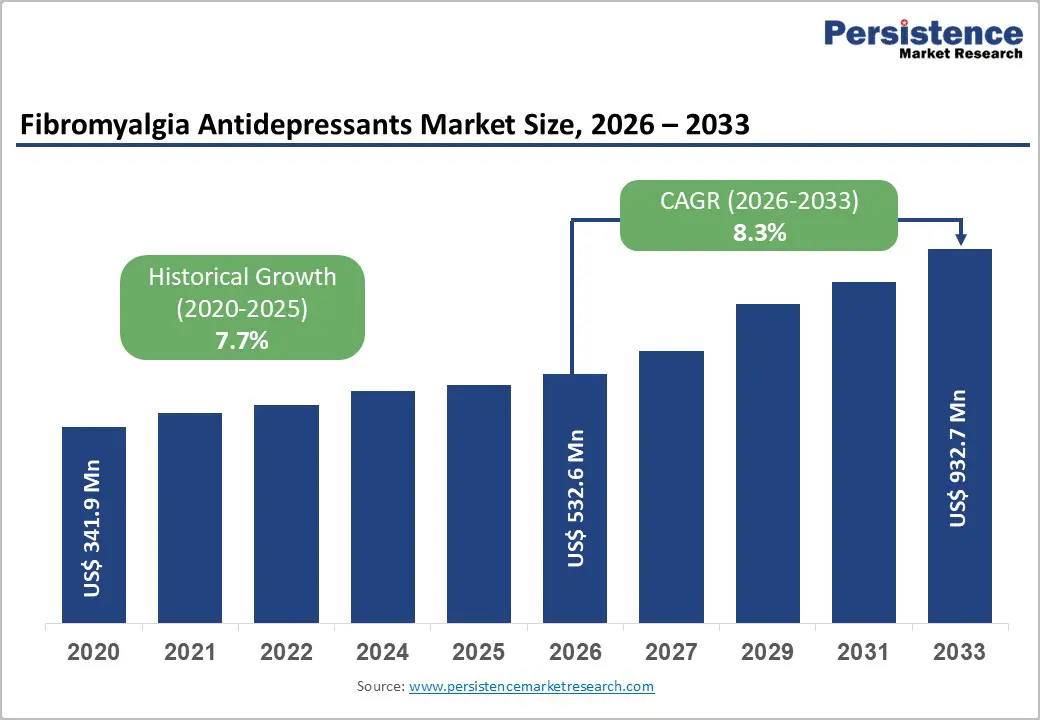
The global Fibromyalgia Antidepressants Market size is expected to be valued at US$ 532.6 million in 2026 and projected to reach US$ 932.7 million by 2033, growing at a CAGR of 8.3% between 2026 and 2033.?
Rising prevalence of fibromyalgia drives this growth, as CDC data indicates about 1.75% of US adults or nearly 4 million people, are affected, with higher rates in women. Increasing awareness and FDA approvals for drugs like duloxetine (an SNRI) support expanded use, evidenced by clinical guidelines recommending antidepressants for pain management. Enhanced diagnosis through updated criteria from EULAR further boosts demand.
Key Market highlights
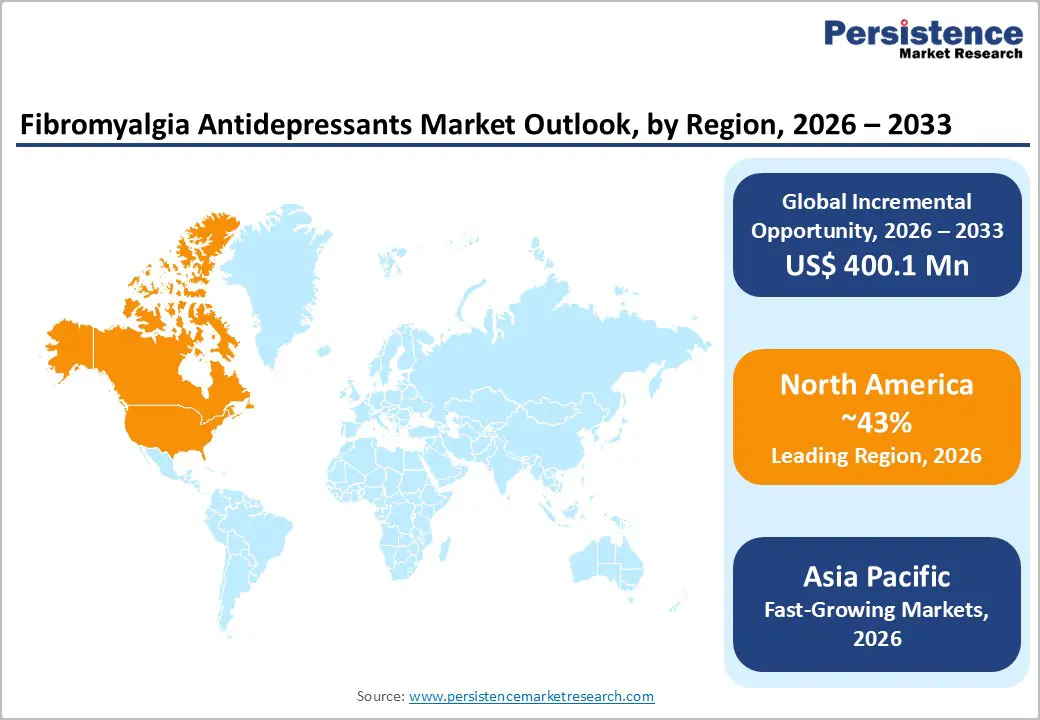
- Asia Pacific dominates with 43% share in 2025, driven by high prevalence and manufacturing in China, India.?
- Latin America fastest-growing region with strong CAGR 2025-2032 from awareness and access improvements.?
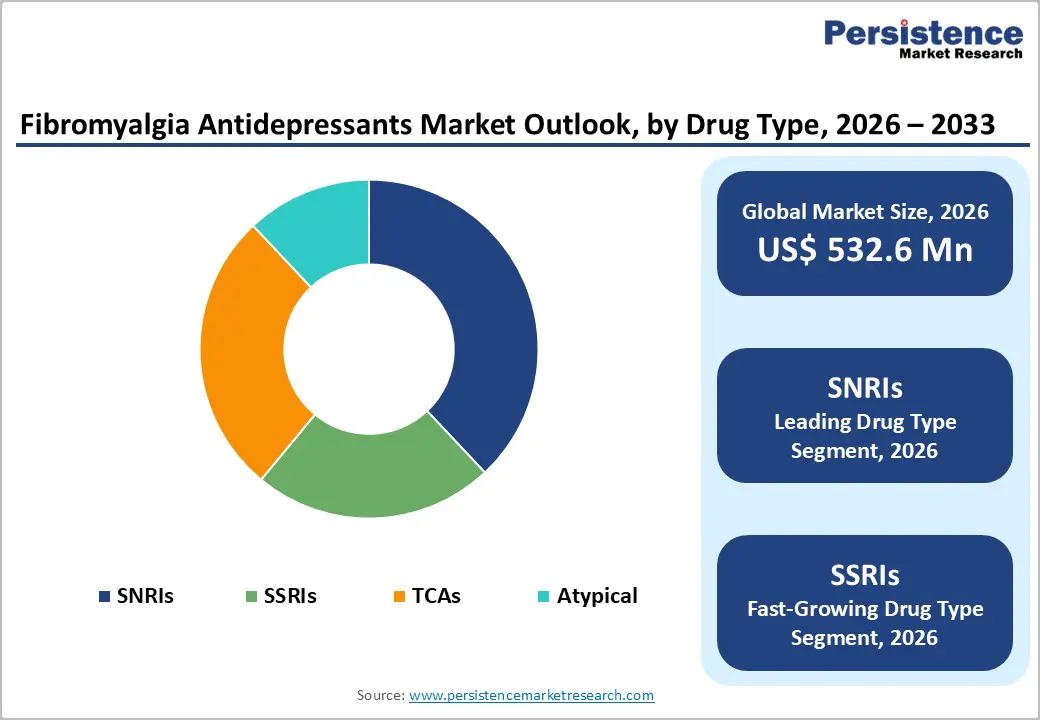
- SNRIs dominant drug type at 38% share, led by duloxetine efficacy.?
- SSRIs fastest-growing segment with high CAGR 2025-2032 for comorbidity treatment.?
- Key opportunity in novel pipelines like Tonmya addressing unmet non-opioid needs.?
|
Global Market Attributes |
Key Insights |
|
Fibromyalgia Antidepressants Market Size (2026E) |
US$ 532.6 million |
|
Market Value Forecast (2033F) |
US$ 932.7 million |
|
Projected Growth CAGR(2026-2033) |
8.3% |
|
Historical Market Growth (2020-2025) |
7.7% |
Market Dynamics
Rising Fibromyalgia Prevalence and Awareness
Rising diagnosis rates of fibromyalgia remain a major driver for the antidepressants segment, as improved screening, primary-care education, and clearer diagnostic criteria are bringing more patients into formal treatment pathways. In the United States, NHIS-reported prevalence among women has highlighted the scale of unmet need, while global organizations such as WHO have emphasized the disease’s impact on quality of life, work productivity, and mental health. These signals have encouraged physicians to intervene earlier with pharmacologic options, particularly antidepressants that can address both pain perception and mood disorders. FDA approvals for agents such as duloxetine strengthened confidence in SNRIs as front-line options, supported by clinical trials showing meaningful pain reduction versus placebo. At the same time, patient advocacy groups, online communities, and medical society guidelines are improving awareness and reducing diagnostic delays, especially in aging populations more prone to chronic pain syndromes. Together, broader recognition of fibromyalgia, rising healthcare utilization, and expanding access to specialty care are steadily enlarging the treated patient pool, sustaining long-term demand for antidepressant therapies within this market.
Advancements in Antidepressant Efficacy
Therapeutic innovation is another critical growth engine, as newer and optimized antidepressant formulations demonstrate stronger analgesic effects, better tolerability, and improved long-term adherence. Duloxetine hydrochloride has captured a dominant position because of its proven dual mechanism on mood and neuropathic pain pathways, reinforcing clinician preference in routine practice. European and international rheumatology recommendations supporting SNRIs and TCAs for symptom control have further legitimized their use, while meta-analyses showing consistent pain reduction across trials have strengthened prescribing confidence. Pharmaceutical R&D is increasingly focused on refining non-opioid pain management strategies, aligning with global efforts to reduce reliance on narcotics for chronic conditions. Late-stage clinical programs and Phase 3 successes for next-generation antidepressants and combination regimens underscore continued pipeline momentum. Enhanced side-effect profiles, once-daily dosing, and extended-release formulations also improve patient persistence on therapy, translating into higher real-world effectiveness. Collectively, these advances expand therapeutic options, reinforce physician trust, and accelerate uptake across both established and emerging markets.
Market Restrains
Side-Effect Profiles and High Treatment Costs
Safety concerns remain a major restraint for the fibromyalgia antidepressants market, as adverse events frequently limit long-term therapy and reduce physician willingness to escalate dosing. Meta-analyses have reported substantially higher discontinuation rates for SNRIs compared with placebo, reflecting nausea, dizziness, insomnia, blood-pressure changes, and sexual dysfunction that undermine adherence in chronic use. Regulatory warnings also weigh on prescribing behavior: FDA black-box alerts on SSRIs for suicidality in adolescents and young adults encourage cautious use and closer monitoring, increasing the clinical burden for providers. At the same time, systematic reviews have questioned the magnitude of pain benefit from some SSRI regimens, pushing clinicians to trial multiple drugs sequentially. This trial-and-error approach raises the risk of polypharmacy, drug–drug interactions, and cumulative side effects, all of which discourage persistence on therapy. In parallel, branded SNRIs and newer formulations can be costly in certain markets, limiting access in under-insured populations and price-sensitive regions. Together, tolerability concerns and affordability barriers restrain broader penetration despite demonstrated clinical efficacy.
Diagnostic Challenges and Persistent Stigma
The absence of objective biomarkers for fibromyalgia continues to slow diagnosis and treatment initiation, acting as another structural brake on market growth. Diagnosis relies heavily on symptom patterns and exclusion of other disorders, which leads to long diagnostic journeys, frequent misclassification, and delayed referrals to specialists. Survey data have suggested that only a minority of suspected cases receive timely physician confirmation, leaving many patients untreated or managed with nonspecific pain therapies rather than antidepressants. Social and cultural stigma further compounds the problem, as fibromyalgia is sometimes perceived as psychosomatic or exaggerated, discouraging patients from seeking care and reducing adherence once therapy is started. Studies from several regions, including parts of Latin America, have documented years-long diagnostic pathways that erode patient trust in pharmacologic options. These factors suppress prescription volumes, favor alternative or non-drug interventions, and ultimately constrain the pace at which antidepressant therapies can expand within the fibromyalgia treatment landscape.
Market Opportunities
Emerging Pipeline Drugs in Fast-Growing Segments
Strong opportunities are emerging from pipeline innovation and shifting prescribing patterns within the fibromyalgia antidepressants market. While SNRIs remain dominant, SSRIs are gaining traction as the fastest-growing class, particularly for patients with significant depression or anxiety comorbidities, in line with evolving clinical guidelines that emphasize holistic symptom control. Novel and repurposed agents addressing unmet needs such as sleep disturbance, central sensitization, and long-term tolerability are also attracting investment. TONIX Pharmaceuticals’ Tonmya, approved in 2025 after Phase 3 trials demonstrated meaningful pain reduction, marked the first new fibromyalgia therapy in over a decade and reignited interest in differentiated mechanisms. Such approvals signal regulatory openness to innovation and encourage broader R&D pipelines. Regionally, Latin America and parts of Asia Pacific represent high-growth frontiers, where rising awareness, improving diagnostics, and the availability of affordable generics create attractive entry points for multinational and regional players seeking rapid volume expansion.
Transdermal and Online Pharmacy Expansion
Delivery-format innovation and evolving distribution channels are opening additional growth avenues in the fibromyalgia antidepressants landscape. Oral formulations continue to dominate prescribing, but transdermal systems and long-acting delivery approaches are gaining attention for providing steadier drug levels, reduced gastrointestinal side effects, and improved adherence in chronic therapy settings. These features are particularly appealing for elderly patients or those who struggle with daily oral dosing. At the same time, digital health adoption has accelerated the rise of online pharmacies, enabling home delivery, prescription renewals, and broader access in rural or underserved areas. Although hospital pharmacies remain the primary dispensing channel for newly diagnosed patients, retail and e-commerce platforms are expanding rapidly alongside teleconsultations and e-prescribing systems. Pipeline programs such as Aptinyx’s NYX-2925, advancing in mid-stage trials for novel pain-pathway modulation, further illustrate how innovation in both therapy and access models could reshape competitive dynamics and capture previously untreated populations.
Category-wise Insights
Drug Type Analysis
SNRIs dominated the fibromyalgia antidepressants market in 2025, accounting for an estimated 38% share, largely supported by duloxetine’s regulatory approval for fibromyalgia-related pain and its strong real-world prescribing base. Their leadership is reinforced by clinical studies indicating that this class captured over 70% of antidepressant use in treated cohorts, reflecting superior modulation of both serotonin and norepinephrine pathways that influence central pain processing. Compared with placebo, SNRIs have demonstrated consistently higher pain-relief rates, along with improvements in fatigue and sleep quality two symptoms that heavily drive therapy choice in routine practice. International clinical recommendations, including those from EULAR, further cement their role by positioning SNRIs as preferred first-line pharmacologic options for widespread chronic pain. Broad generic availability has also improved affordability in emerging markets, supporting volume growth. Together, regulatory backing, guideline endorsement, physician familiarity, and expanding patient pools continue to sustain SNRI leadership across mature and developing healthcare systems.
Distribution Channel Analysis
Hospital pharmacies remained the leading distribution channel in 2025, capturing roughly 45% of total fibromyalgia antidepressant sales as complex and newly diagnosed cases are frequently initiated under specialist supervision. Many patients enter treatment through rheumatology, neurology, or pain-management clinics, where antidepressant therapy is carefully selected, titrated, and monitored for adverse effects, reinforcing the importance of institutional dispensing. Market assessments have shown hospital channels growing close to a 6% CAGR, supported by reimbursement programs, bundled treatment protocols, and rising inpatient and outpatient visits linked to chronic pain disorders. Hospitals also play a central role in switching or escalating therapy when first-line regimens fail, which sustains higher-value prescription volumes through this route. Increasing awareness campaigns and referral networks are driving more patients into tertiary centers, particularly in urban regions. As multidisciplinary fibromyalgia clinics expand, hospital pharmacies are expected to remain a critical gateway for antidepressant utilization despite the parallel rise of retail and online channels.
Regional Insights
North America Fibromyalgia Antidepressants Market Trends
North America continues to dominate the fibromyalgia antidepressants market, driven largely by the United States’ substantial diagnosed patient base, advanced healthcare infrastructure, and strong regulatory and research ecosystem. High disease recognition among primary-care physicians and rheumatologists encourages earlier pharmacologic intervention, sustaining high prescription volumes for antidepressants used in chronic pain management. FDA approvals for therapies such as duloxetine and newer entrants like Tonmya have reinforced clinician confidence and stimulated continued product development across both branded and generic segments. Publicly funded research programs and clinical initiatives supported by institutions such as the NIH further strengthen evidence generation and guideline updates, which frequently highlight antidepressants as core components of multimodal fibromyalgia care. Broad insurance coverage, widespread access to specialty clinics, and active patient advocacy organizations also contribute to consistent uptake. Together, regulatory momentum, innovation pipelines, and a well-established reimbursement environment keep North America at the forefront of market growth and therapeutic adoption.
Asia Pacific Fibromyalgia Antidepressants Market Trends
Asia Pacific has emerged as a major growth engine for the fibromyalgia antidepressants market, supported by expanding healthcare access, improving diagnostic rates, and rapidly aging populations across large economies. China, Japan, and India anchor regional demand through rising chronic pain prevalence and strong pharmaceutical manufacturing capabilities that enable large-scale production of affordable generics. Governments and medical societies are increasingly promoting awareness of fibromyalgia, encouraging more patients to seek formal treatment and boosting antidepressant utilization. The region is also projected to post steady mid-single-digit growth, reflecting higher healthcare spending and urbanization trends that improve access to specialist care. In Southeast Asia, expanding public hospital networks and private pharmacy chains are improving drug availability, while generic penetration lowers cost barriers. Collectively, demographic shifts, policy support, and manufacturing strength are positioning Asia Pacific as a long-term expansion hub for global and regional drug makers.
Competitive Landscape
Market Structure Analysis
The fibromyalgia antidepressants market is moderately consolidated, with competition shaped by a mix of large multinational pharmaceutical companies and smaller specialty biotechs advancing novel pain-modulating therapies. Established players dominate through strong SNRI and SSRI portfolios, broad generic offerings, and deep distribution networks across hospitals and retail channels. Patent expiries have intensified price competition, encouraging volume-driven strategies and lifecycle management through extended-release formulations and combination regimens. Meanwhile, emerging biotech firms are injecting innovation via differentiated mechanisms and reformulated legacy drugs, attracting partnerships or licensing deals.
Key Market Developments
- In November 2025, Tonix Pharmaceuticals launched Tonmya™ for fibromyalgia treatment, marking the first FDA-approved medicine for the condition in over 15 years. The drug offered new hope for patients struggling with chronic pain.
Companies Covered in Fibromyalgia Antidepressants Market
Pfizer, Inc.
Eli Lilly and Company
AbbVie, Inc.
Teva Pharmaceutical Industries Ltd.
Johnson & Johnson Services, Inc.
Sanofi S.A.
GlaxoSmithKline plc
Bayer AG
TONIX Pharmaceuticals Holdings Corp.
Virios Therapeutics, Inc.
Aptinyx Inc.
FSD Pharma
Frequently Asked Questions
The market is expected to reach US$ 532.6 million in 2026.
Rising fibromyalgia prevalence, affecting 4 million US adults, boosts antidepressant demand like SNRIs.
Asia Pacific with 43% share in 2025, driven by China and India.
Novel drugs like Tonmya in atypical segment and Latin America growth.
Leaders include Pfizer, Eli Lilly, TONIX Pharmaceuticals, Aptinyx


