


- Executive Summary
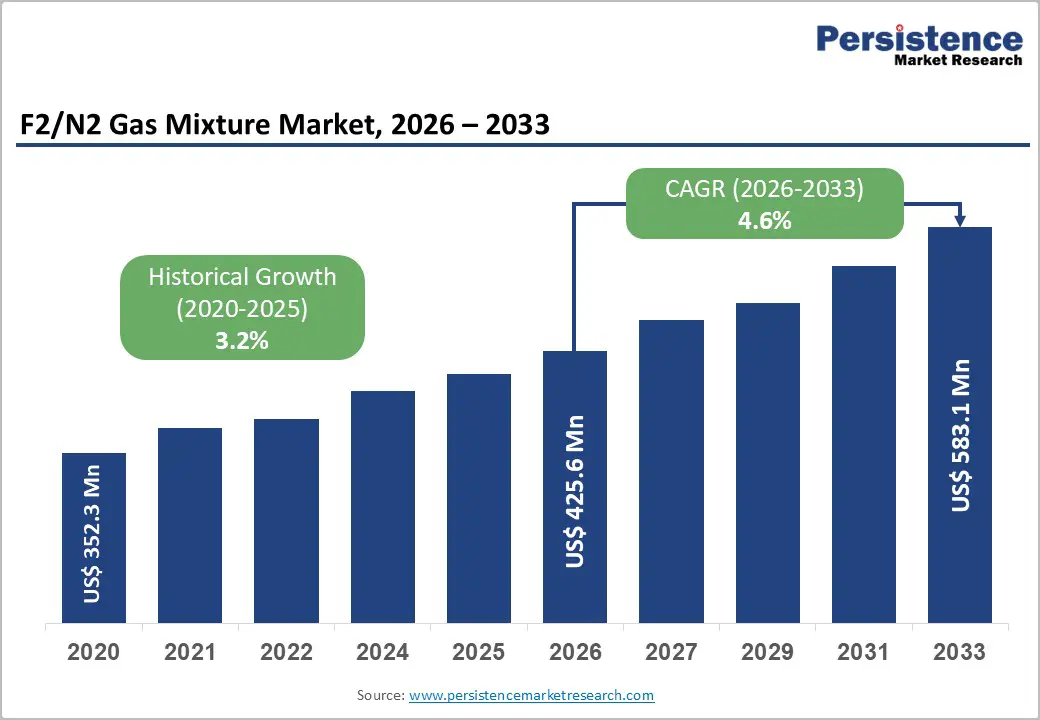
- Global F2/N2 Gas Mixture Market Snapshot 2026 and 2033
- Market Opportunity Assessment, 2026 - 2033, US$ Bn
- Key Market Trends
- Industry Developments and Key Market Events
- Demand Side and Supply Side Analysis
- PMR Analysis and Recommendations
- Market Overview
- Market Scope and Definitions
- Value Chain Analysis
- Macro-Economic Factors
- Global GDP Outlook
- Global Semiconductor Industry Overview
- Global Automotive Industry Overview
- Global Chemical Industry Overview
- Forecast Factors - Relevance and Impact
- COVID-19 Impact Assessment
- PESTLE Analysis
- Porter's Five Forces Analysis
- Geopolitical Tensions: Market Impact
- Regulatory and Technology Landscape
- Market Dynamics
- Drivers
- Restraints
- Opportunities
- Trends
- Price Trend Analysis, 2020 - 2033
- Region-wise Price Analysis
- Price by Segments
- Price Impact Factors
- Global F2/N2 Gas Mixture Market Outlook: Historical (2020 - 2025) and Forecast (2026 - 2033)
- Key Highlights
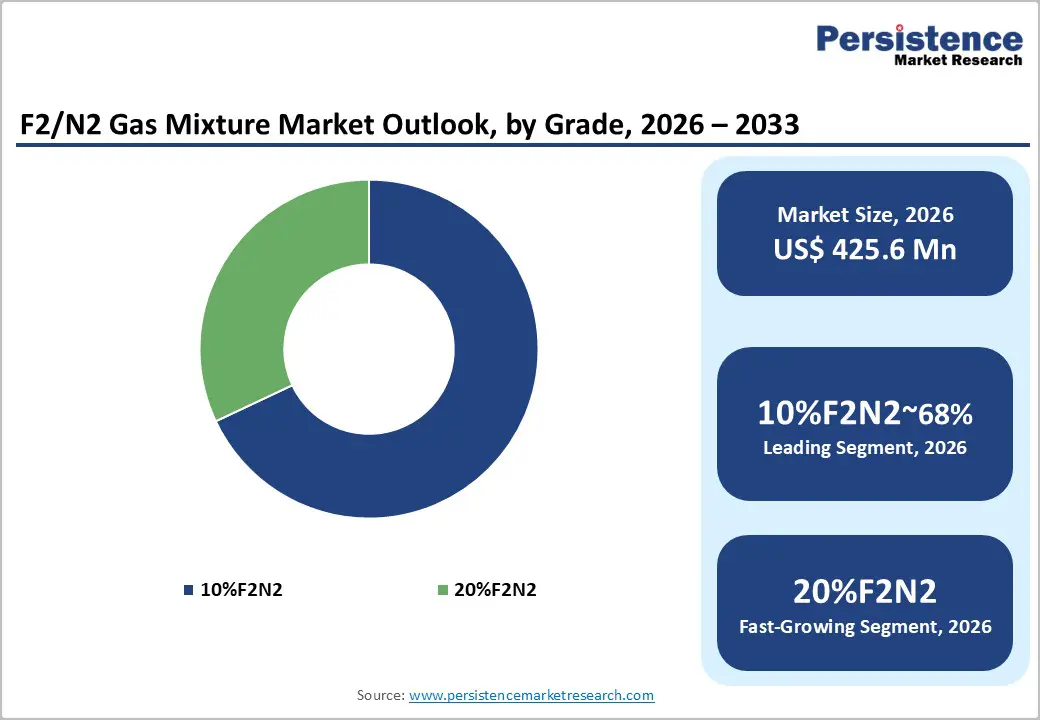
- Global F2/N2 Gas Mixture Market Outlook: Product Type
- Introduction/Key Findings
- Historical Market Size (US$ Bn) and Volume (Tons) Analysis by Product Type, 2020-2025
- Current Market Size (US$ Bn) and Volume (Tons) Forecast, by Product Type, 2026-2033
- 10%F2N2
- 20%F2N2
- Market Attractiveness Analysis: Product Type
- Global F2/N2 Gas Mixture Market Outlook: Distribution Channel
- Introduction/Key Findings
- Historical Market Size (US$ Bn) and Volume (Tons) Analysis by Distribution Channel, 2020-2025
- Current Market Size (US$ Bn) and Volume (Tons) Forecast, by Distribution Channel, 2026-2033
- Direct Sales
- Distributors & Resellers
- Online B2B Platforms
- Market Attractiveness Analysis: Distribution Channel
- Global F2/N2 Gas Mixture Market Outlook: End-Use
- Introduction/Key Findings
- Historical Market Size (US$ Bn) and Volume (Tons) Analysis by End-Use , 2020-2025
- Current Market Size (US$ Bn) and Volume (Tons) Forecast, by End-Use , 2026-2033
- Semiconductor & Electronics
- Chemical Manufacturing
- Glass & Ceramics
- Automotive
- Aerospace & Defense
- Research Institutions
- Others
- Market Attractiveness Analysis: End-Use
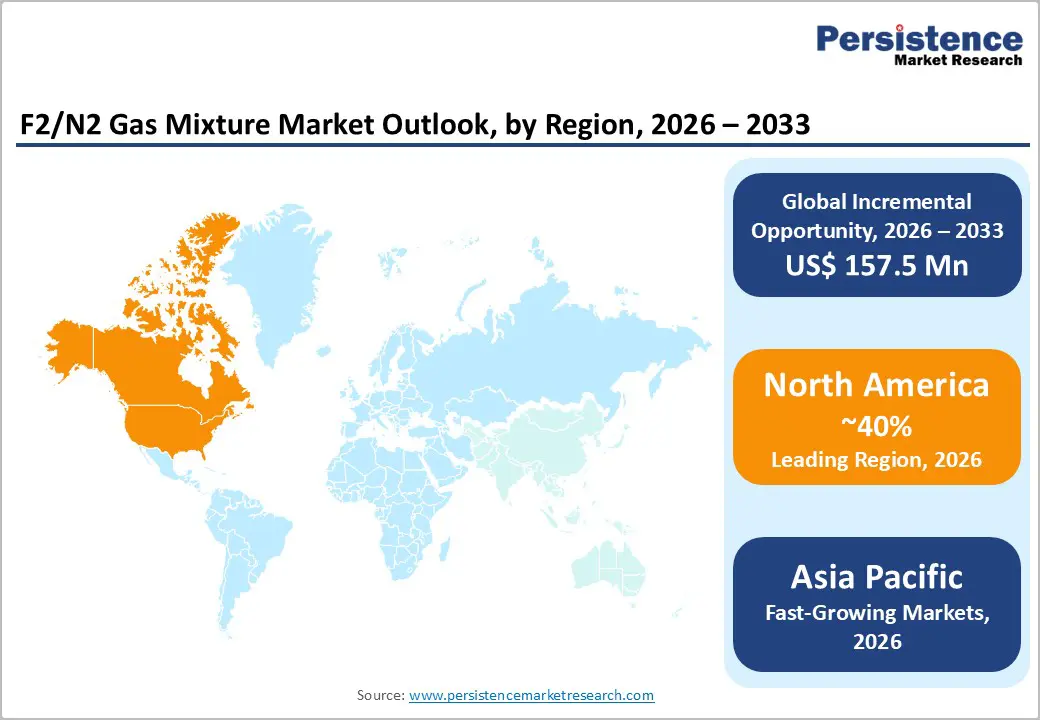
- Global F2/N2 Gas Mixture Market Outlook: Region
- Key Highlights
- Historical Market Size (US$ Bn) and Volume (Tons) Analysis by Region, 2020-2025
- Current Market Size (US$ Bn) and Volume (Tons) Forecast, by Region, 2026-2033
- North America
- Europe
- East Asia
- South Asia & Oceania
- Latin America
- Middle East & Africa
- Market Attractiveness Analysis: Region
- North America F2/N2 Gas Mixture Market Outlook: Historical (2020 - 2025) and Forecast (2026 - 2033)
- Key Highlights
- Pricing Analysis
- North America Market Size (US$ Bn) and Volume (Tons) Forecast, by Country, 2026-2033
- U.S.
- Canada
- North America Market Size (US$ Bn) and Volume (Tons) Forecast, by Product Type, 2026-2033
- 10%F2N2
- 20%F2N2
- North America Market Size (US$ Bn) and Volume (Tons) Forecast, by Distribution Channel, 2026-2033
- Direct Sales
- Distributors & Resellers
- Online B2B Platforms
- North America Market Size (US$ Bn) and Volume (Tons) Forecast, by End-Use , 2026-2033
- Semiconductor & Electronics
- Chemical Manufacturing
- Glass & Ceramics
- Automotive
- Aerospace & Defense
- Research Institutions
- Others
- Europe F2/N2 Gas Mixture Market Outlook: Historical (2020 - 2025) and Forecast (2026 - 2033)
- Key Highlights
- Pricing Analysis
- Europe Market Size (US$ Bn) and Volume (Tons) Forecast, by Country, 2026-2033
- Germany
- Italy
- France
- U.K.
- Spain
- Russia
- Rest of Europe
- Europe Market Size (US$ Bn) and Volume (Tons) Forecast, by Product Type, 2026-2033
- 10%F2N2
- 20%F2N2
- Europe Market Size (US$ Bn) and Volume (Tons) Forecast, by Distribution Channel, 2026-2033
- Direct Sales
- Distributors & Resellers
- Online B2B Platforms
- Europe Market Size (US$ Bn) and Volume (Tons) Forecast, by End-Use , 2026-2033
- Semiconductor & Electronics
- Chemical Manufacturing
- Glass & Ceramics
- Automotive
- Aerospace & Defense
- Research Institutions
- Others
- East Asia F2/N2 Gas Mixture Market Outlook: Historical (2020 - 2025) and Forecast (2026 - 2033)
- Key Highlights
- Pricing Analysis
- East Asia Market Size (US$ Bn) and Volume (Tons) Forecast, by Country, 2026-2033
- China
- Japan
- South Korea
- East Asia Market Size (US$ Bn) and Volume (Tons) Forecast, by Product Type, 2026-2033
- 10%F2N2
- 20%F2N2
- East Asia Market Size (US$ Bn) and Volume (Tons) Forecast, by Distribution Channel, 2026-2033
- Direct Sales
- Distributors & Resellers
- Online B2B Platforms
- East Asia Market Size (US$ Bn) and Volume (Tons) Forecast, by End-Use , 2026-2033
- Semiconductor & Electronics
- Chemical Manufacturing
- Glass & Ceramics
- Automotive
- Aerospace & Defense
- Research Institutions
- Others
- South Asia & Oceania F2/N2 Gas Mixture Market Outlook: Historical (2020 - 2025) and Forecast (2026 - 2033)
- Key Highlights
- Pricing Analysis
- South Asia & Oceania Market Size (US$ Bn) and Volume (Tons) Forecast, by Country, 2026-2033
- India
- Southeast Asia
- ANZ
- Rest of SAO
- South Asia & Oceania Market Size (US$ Bn) and Volume (Tons) Forecast, by Product Type, 2026-2033
- 10%F2N2
- 20%F2N2
- South Asia & Oceania Market Size (US$ Bn) and Volume (Tons) Forecast, by Distribution Channel, 2026-2033
- Direct Sales
- Distributors & Resellers
- Online B2B Platforms
- South Asia & Oceania Market Size (US$ Bn) and Volume (Tons) Forecast, by End-Use , 2026-2033
- Semiconductor & Electronics
- Chemical Manufacturing
- Glass & Ceramics
- Automotive
- Aerospace & Defense
- Research Institutions
- Others
- Latin America F2/N2 Gas Mixture Market Outlook: Historical (2020 - 2025) and Forecast (2026 - 2033)
- Key Highlights
- Pricing Analysis
- Latin America Market Size (US$ Bn) and Volume (Tons) Forecast, by Country, 2026-2033
- Brazil
- Mexico
- Rest of LATAM
- Latin America Market Size (US$ Bn) and Volume (Tons) Forecast, by Product Type, 2026-2033
- 10%F2N2
- 20%F2N2
- Latin America Market Size (US$ Bn) and Volume (Tons) Forecast, by Distribution Channel, 2026-2033
- Direct Sales
- Distributors & Resellers
- Online B2B Platforms
- Latin America Market Size (US$ Bn) and Volume (Tons) Forecast, by End-Use , 2026-2033
- Semiconductor & Electronics
- Chemical Manufacturing
- Glass & Ceramics
- Automotive
- Aerospace & Defense
- Research Institutions
- Others
- Middle East & Africa F2/N2 Gas Mixture Market Outlook: Historical (2020 - 2025) and Forecast (2026 - 2033)
- Key Highlights
- Pricing Analysis
- Middle East & Africa Market Size (US$ Bn) and Volume (Tons) Forecast, by Country, 2026-2033
- GCC Countries
- South Africa
- Northern Africa
- Rest of MEA
- Middle East & Africa Market Size (US$ Bn) and Volume (Tons) Forecast, by Product Type, 2026-2033
- 10%F2N2
- 20%F2N2
- Middle East & Africa Market Size (US$ Bn) and Volume (Tons) Forecast, by Distribution Channel, 2026-2033
- Direct Sales
- Distributors & Resellers
- Online B2B Platforms
- Middle East & Africa Market Size (US$ Bn) and Volume (Tons) Forecast, by End-Use , 2026-2033
- Semiconductor & Electronics
- Chemical Manufacturing
- Glass & Ceramics
- Automotive
- Aerospace & Defense
- Research Institutions
- Others
- Competition Landscape
- Market Share Analysis, 2025
- Market Structure
- Competition Intensity Mapping
- Competition Dashboard
- Company Profiles
- The Linde Group
- Company Overview
- Product Portfolio/Offerings
- Key Financials
- SWOT Analysis
- Company Strategy and Key Developments
- Solvay SA
- Versium Materials
- Air Liquide S.A.
- Hyosung Japan Co.,Ltd.
- Ingentec Corp.
- Pelchem SOC Ltd
- Wuxi Yuntong Gas Co., Ltd.
- Messer Group GmbH
- Matheson Tri‑Gas, Inc.
- Hangzhou Hangyang Co., Ltd.
- Central Glass Co., Ltd.
- Others.
- The Linde Group
- Appendix
- Research Methodology
- Research Assumptions
- Acronyms and Abbreviations

Loading page data
Please wait a moment


