


- Executive Summary
- Europe Refurbished and Used Mobile Phones Market Snapshot, 2025 and 2032
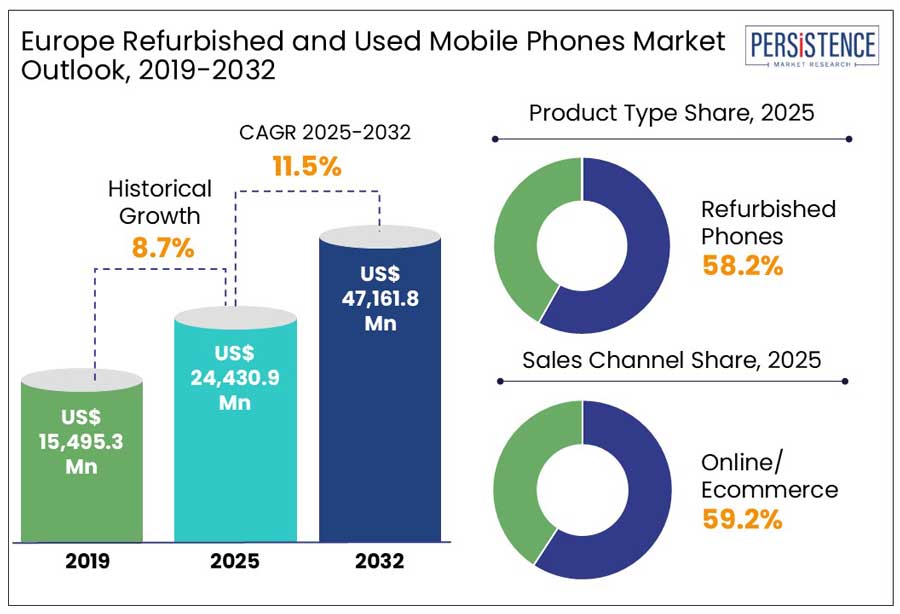
- Market Opportunity Assessment, 2025 - 2032, US$ Mn
- Key Market Trends
- Future Market Projections
- Premium Market Insights
- Industry Developments and Key Market Events
- PMR Analysis and Recommendations
- Market Overview
- Market Scope and Definition
- Market Dynamics
- Drivers
- Restraints
- Opportunity
- Challenges
- Key Trends
- Macro-Economic Factors
- Europe GDP Growth
- Inflation Rate
- Urbanization Rate
- Smartphone Penetration Rate
- E-commerce Growth Outlook
- Investment in R&D
- COVID-19 Impact Analysis
- Forecast Factors - Relevance and Impact
- Value Added Insights
- Regulatory Landscape
- Value Chain Analysis
- PESTLE Analysis
- Porter’s Five Force Analysis
- Price Trend Analysis
- Key Highlights
- Key Factors Impacting Refurbished and Used Mobile Phones Prices
- Average Pricing Analysis, By Pricing Range
- Average Pricing Analysis, By Region
- Europe Refurbished and Used Mobile Phones Market Outlook: Historical (2019 - 2023) and Forecast (2024 - 2032)
- Europe Refurbished and Used Mobile Phones Market Outlook: Product Type
- Introduction / Key Findings
- Historical Market Size (US$ Mn) and Volume (Unit) Analysis, By Product Type, 2019 - 2023
- Current Market Size (US$ Mn) and Volume (Unit) Analysis and Forecast, By Product Type, 2024 - 2032
- Refurbished Phones
- Used Phones
- Market Attractiveness Analysis: Product Type
- Europe Refurbished and Used Mobile Phones Market Outlook: Pricing Range
- Introduction / Key Findings
- Historical Market Size (US$ Mn) and Volume (Units) Analysis, By Pricing Range, 2019 - 2023
- Current Market Size (US$ Mn) and Volume (Units) Analysis and Forecast, By Pricing Range, 2024 - 2032
- Low-Priced Band (less than $200)
- Mid-Priced Band ($200-$500)
- Premium Band (More than $500)
- Market Attractiveness Analysis: Pricing Range
- Europe Refurbished and Used Mobile Phones Market Outlook: Sales Channel
- Introduction / Key Findings
- Historical Market Size (US$ Mn) and Volume (Units) Analysis, By Sales Channel, 2019 - 2023
- Current Market Size (US$ Mn) and Volume (Units) Analysis and Forecast, By Sales Channel, 2024 - 2032
- Online/ E-commerce
- Physical Retail Stores
- Organized Retailers
- Unorganized Retailers
- Market Attractiveness Analysis: Sales Channel
- Europe Refurbished and Used Mobile Phones Market Outlook: Product Type
- Europe Refurbished and Used Mobile Phones Market Outlook: Region
- Key Highlights
- Historical Market Size (US$ Mn) and Volume (Unit) Analysis, By Region, 2019 - 2023
- Current Market Size (US$ Mn) and Volume (Units) Analysis and Forecast, By Region, 2024 - 2032
-
- Western Europe
- Central & Eastern Europe
- Russia & Belarus
- Balkan & Baltics
-
- Market Attractiveness Analysis: Region
- Western Europe Refurbished and Used Mobile Phones Market Outlook: Historical (2019 - 2023) and Forecast (2024 - 2032)
- Key Highlights
- Historical Market Size (US$ Mn) and Volume (Units) Analysis, By Market, 2019 - 2023
- By Country
- By Product Type
- By Pricing Range
- By Sales Channel
- Current Market Size (US$ Mn) and Volume (Units) Analysis and Forecast, By Country, 2024 - 2032
- Germany
- Italy
- France
- U.K.
- Spain
- BENELUX
- Nordics
- Rest of Western Europe
- Current Market Size (US$ Mn) and Volume (Units) Analysis and Forecast, By Product Type, 2024 - 2032
- Refurbished Phones
- Used Phones
- Current Market Size (US$ Mn) and Volume (Units) Analysis and Forecast, By Pricing Range, 2024 - 2032
- Low-Priced Band ( less than $200)
- Mid-Priced Band ($200-$500)
- Premium Band (More than $500)
- Current Market Size (US$ Mn) and Volume (Units) Analysis and Forecast, By Sales Channel, 2024 - 2032
- Online/ E-commerce
- Physical Retail Stores
- Organized Retailers
- Unorganized Retailers
- Market Attractiveness Analysis
- Central & Eastern Europe Refurbished and Used Mobile Phones Market Outlook: Historical (2019 - 2023) and Forecast (2024 - 2032)
- Key Highlights
- Historical Market Size (US$ Mn) and Volume (Units) Analysis, By Market, 2019 - 2023
- By Country
- By Product Type
- By Pricing Range
- By Sales Channel
- Current Market Size (US$ Mn) and Volume (Units) Analysis and Forecast, By Country, 2024 - 2032
- Austria
- Switzerland
- Slovakia
- Poland
- Hungary
- Romania
- Czech Republic
- Rest of Central & Eastern Europe
- Current Market Size (US$ Mn) and Volume (Units) Analysis and Forecast, By Product Type, 2024 - 2032
- Refurbished Phones
- Used Phones
- Current Market Size (US$ Mn) and Volume (Units) Analysis and Forecast, By Pricing Range, 2024 - 2032
- Low-Priced Band ( less than $200)
- Mid-Priced Band ($200-$500)
- Premium Band (More than $500)
- Current Market Size (US$ Mn) and Volume (Units) Analysis and Forecast, By Sales Channel, 2024 - 2032
- Online/ E-commerce
- Physical Retail Stores
- Organized Retailers
- Unorganized Retailers
- Market Attractiveness Analysis
- Russia & Belarus Refurbished and Used Mobile Phones Market Outlook: Historical (2019 - 2023) and Forecast (2024 - 2032)
- Key Highlights
- Historical Market Size (US$ Mn) and Volume (Units) Analysis, By Market, 2019 - 2023
- By Product Type
- By Pricing Range
- By Sales Channel
- Current Market Size (US$ Mn) and Volume (Units) Analysis and Forecast, By Product Type, 2024 - 2032
- Refurbished Phones
- Used Phones
- Current Market Size (US$ Mn) and Volume (Units) Analysis and Forecast, By Pricing Range, 2024 - 2032
- Low-Priced Band ( less than $200)
- Mid-Priced Band ($200-$500)
- Premium Band (More than $500)
- Current Market Size (US$ Mn) and Volume (Units) Analysis and Forecast, By Sales Channel, 2024 - 2032
- Online/ E-commerce
- Physical Retail Stores
- Organized Retailers
- Unorganized Retailers
- Market Attractiveness Analysis
- Balkan & Baltics Refurbished and Used Mobile Phones Market Outlook: Historical (2019 - 2023) and Forecast (2024 - 2032)
- Key Highlights
- Historical Market Size (US$ Mn) and Volume (Units) Analysis, By Market, 2019 - 2023
- By Product Type
- By Pricing Range
- By Sales Channel
- Current Market Size (US$ Mn) and Volume (Units) Analysis and Forecast, By Product Type, 2024 - 2032
- Refurbished Phones
- Used Phones
- Current Market Size (US$ Mn) and Volume (Units) Analysis and Forecast, By Pricing Range, 2024 - 2032
- Low-Priced Band ( less than $200)
- Mid-Priced Band ($200-$500)
- Premium Band (More than $500)
- Current Market Size (US$ Mn) and Volume (Units) Analysis and Forecast, By Sales Channel, 2024 - 2032
- Online/ E-commerce
- Physical Retail Stores
- Organized Retailers
- Unorganized Retailers
- Market Attractiveness Analysis
- Competition Landscape
- Market Share Analysis, 2024
- Market Structure
- Competition Intensity Mapping
- Competition Dashboard
- Company Profiles (Details - Overview, Financials, Strategy, Recent Developments)
- Apple
- Overview
- Solution Portfolio
- Key Financials
- Market Developments
- Market Strategy
- Samsung
- Lenovo
- Huawei Technologies Co., Ltd
- Xiaomi
- Motorola
- Nokia
- Sony
- OnePlus
- LG
- HTC
- Apple
- Appendix
- Research Methodology
- Research Assumptions
- Acronyms and Abbreviations

Loading page data
Please wait a moment


