


- Semiconductor Materials & Components
- Enterprise Session Border Controller Market
Enterprise Session Border Controller Market Size, Share, and Growth Forecast 2026 - 2033
Enterprise Session Border Controller Market by Component (Hardware, Software, Services), by Deployment (On-premises, Cloud-based, Hybrid), Session Capacity (Up to 200, 201-600, 601-1,000, 1,001-5,000, Above 5,000), Industry (BFSI, IT & Telecommunications, Healthcare, Government & Defense, Retail & E-Commerce, Manufacturing, Media & Entertainment, Transportation & Logistics, Others), and Regional Analysis, 2026 - 2033
Enterprise Session Border Controller Market Size and Trend Analysis
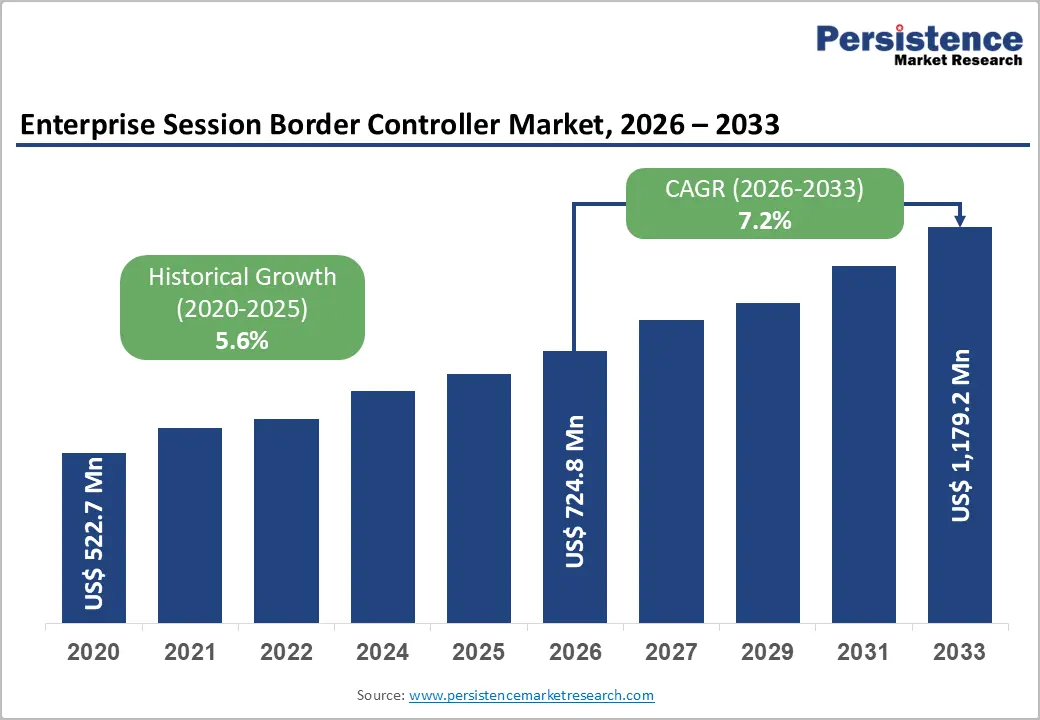
The global enterprise session border controller market is expected to be valued at US$ 724.8 million in 2026 and is projected to reach US$ 1,179.2 million by 2033, growing at a CAGR of 7.2% between 2026 and 2033, driven by the rapid migration from legacy PSTN and ISDN infrastructure toward SIP-based enterprise communication networks.
Telecom operators across major economies are shutting down traditional copper-based telephony systems, accelerating enterprise adoption of SBCs for secure voice traffic management and interoperability. Enterprises are also deploying SBCs to enhance SIP security, enable encrypted communications, prevent toll fraud, and support seamless integration across hybrid UCaaS and on-premises communication environments.
Key Industry Highlights:
- Leading Component: The software segment is likely to dominate with over 47% share in 2026, valued at more than US$ 340.66 Million, driven by increasing enterprise demand for virtualized and cloud-compatible SBC platforms that reduce hardware dependency and improve deployment flexibility across hybrid communication environments.
- Leading Deployment: Hybrid deployment leads with over 42% share in 2026, valued at more than US$ 304.42 million, due to enterprises maintaining legacy on-premises telephony systems while simultaneously integrating cloud-based UCaaS and SIP trunking infrastructure.
- Fast-Growing Deployment: Cloud-based is the fastest-growing model, driven by increasing remote workforce adoption, lower capital expenditure requirements, centralized session management, and accelerating migration toward subscription-based communication infrastructure.
- Leading Session Capacity: The 1,001-5,000 sessions tier accounts for over 35% market share in 2026, exceeding US$ 253.68 Million, supported by strong demand from mid-to-large enterprises operating multi-site communications, regional contact centres, and high-volume SIP trunking environments.
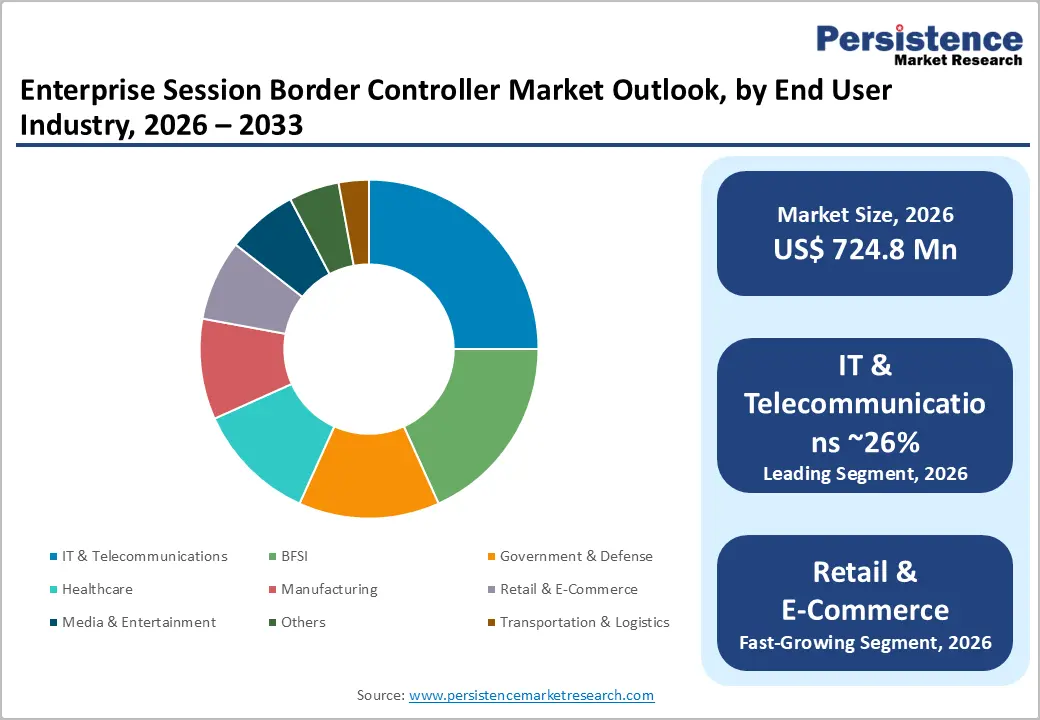
- Leading Industry: IT & Telecommunications holds over 26.0% market share in 2026, valued at more than US$ 188.45 Million, driven by increasing demand for secure SIP interconnectivity, toll fraud prevention, encrypted voice traffic management, and interoperability across enterprise and carrier communication networks.
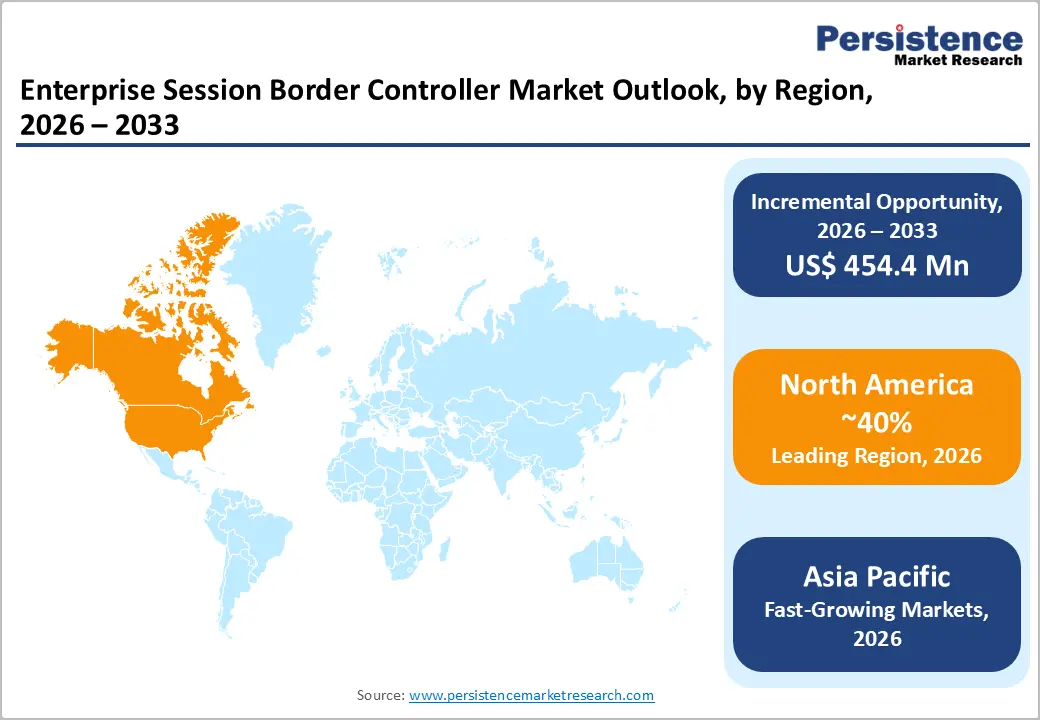
- Leading Region: North America dominates with over 40.0% market share in 2026, valued at US$ 289.92 Million, supported by high UCaaS adoption, advanced SIP-based cloud telephony infrastructure, and stringent voice security compliance requirements across healthcare, banking, and public sector industries.
- Fast-Growing Market: Asia Pacific is the fast-growing market with a CAGR of 11.8% through 2033, driven by rapid ICT modernization, private 5G deployments, hyperscale data centre expansion, and accelerating enterprise migration toward cloud-based unified communications platforms across China, India, Japan, and Southeast Asia.
Market Dynamics
Drivers - Mandatory SIP Security Compliance Across Regulated Verticals Elevating SBC Procurement Priority
Enterprises operating in highly regulated industries increasingly treat Enterprise Session Border Controllers (E-SBCs) as mandatory security and compliance infrastructure rather than optional voice networking appliances. Regulatory frameworks such as PCI DSS 4.0, which becomes fully enforceable by March 2025, require encryption and secure transmission of sensitive communication traffic, accelerating the adoption of TLS and SRTP-enabled SBC platforms in banking, healthcare, and contact center environments.
In Europe, the implementation of the Digital Operational Resilience Act (DORA) in 2025 is further strengthening enterprise investment in secure ICT and voice communication architectures. Enterprises are expected to continue upgrading legacy voice security systems with policy-driven, compliance-ready SBC platforms over the forecast period.
Hyper-Scale UCaaS Platform Proliferation Driving Session Border Controller Interoperability Demand
The rapid expansion of Unified Communications as a Service (UCaaS) platforms such as Cisco Systems, Zoom Communications, and RingCentral is significantly increasing demand for Enterprise Session Border Controllers capable of ensuring interoperability across hybrid communication environments. Large enterprises increasingly operate multi-vendor UCaaS ecosystems combining cloud collaboration platforms with legacy PBX and SIP trunking infrastructure, creating protocol normalization and security challenges that SBCs are designed to address.
Growing adoption of hybrid work models and cloud telephony migration is further intensifying the need for centralized session management and secure voice routing. Vendors offering certified interoperability across multiple UCaaS platforms are therefore gaining stronger competitive positioning and recurring enterprise renewal opportunities.
Restraints - High Total Cost of Ownership for Hardware-Based SBC Deployments Constraining SME Adoption
Hardware-based enterprise session border controller deployments continue to present significant cost barriers for small and medium-sized enterprises due to high upfront capital expenditure and ongoing maintenance requirements. Enterprise-grade SBC appliances range from approximately US$ 15,000 to more than US$ 100,000, depending on concurrent session capacity, redundancy requirements, and security features, while annual support and software maintenance contracts can add 20-30% to operational costs.
Continued semiconductor pricing volatility and network equipment component inflation have increased manufacturing costs for appliance vendors since 2023. These factors slow adoption among cost-sensitive organizations, particularly when compared with lower-cost cloud-native or virtualized SBC alternatives.
Shortage of Skilled SIP and VoIP Security Professionals Slowing Deployment Timelines
The limited availability of engineers with expertise in SIP trunking, VoIP security, TLS/SRTP encryption, and SBC policy management continues to delay enterprise deployment cycles for advanced communication infrastructure projects. Complex hybrid deployments involving multiple sites, UCaaS integrations, and legacy telephony migration often require specialized configuration and interoperability testing, extending implementation timelines beyond planned schedules.
Mid-sized enterprises are particularly affected due to limited in-house telecommunications expertise and reliance on third-party system integrators. Although cloud-native SBC platforms increasingly offer automated provisioning and centralized orchestration capabilities, large-scale deployments remain dependent on experienced voice network professionals.
Opportunities - 5G Enterprise Private Network Deployments Creating a New SBC Addressable Market in Manufacturing and Logistics
The expansion of private 5G enterprise networks across manufacturing, logistics, mining, and industrial automation environments is creating a new addressable market for vendors. Industrial enterprises deploying standalone 5G architecture increasingly require secure SIP-based voice, video, and machine-to-machine communication management across converged operational technology and enterprise IT networks.
Companies such as Ericsson and Nokia have accelerated the deployment of enterprise private 5G solutions across Europe and Asia, strengthening demand for interoperable and low-latency communication security platforms. This is expected to support development of 5G-optimized, cloud-native SBC solutions compliant with evolving 3GPP standards.
AI-Driven Fraud Detection Capabilities Enabling Premium SBC Service Monetization
The integration of artificial intelligence-based fraud detection and traffic anomaly monitoring into platforms is emerging as a major product differentiation opportunity for vendors. Rising incidents of telecom fraud, SIP toll fraud, robocalling, and voice traffic manipulation are encouraging enterprises and telecom operators to adopt advanced session-layer security analytics. According to a study, global telecommunications fraud losses exceeded US$ 41 billion in 2025, increasing enterprise focus on real-time traffic intelligence and automated threat mitigation.
Vendors capable of combining AI-driven analytics with explainable security models and large-scale SIP traffic datasets are expected to command premium pricing in regulated enterprise environments.
Category-wise Analysis
Component Insights
Software segment accounts for over 47.0% of the global enterprise session border controller market in 2026, reaching US$ 340.66 Million, as enterprises increasingly require flexible and scalable voice security infrastructure that deployed without investing in dedicated hardware appliances. Enterprises also require virtualised SBC platforms to reduce infrastructure procurement cycles and improve deployment agility within VMware and Hyper-V environments. Software SBCs additionally support faster upgrades and licence-based expansion models, helping enterprises respond quickly to increasing voice traffic volumes and evolving cybersecurity requirements.
Services segment is the fastest growing component because enterprises increasingly require external expertise for SBC deployment, configuration, monitoring, interoperability testing, and ongoing security management. Many organisations lack dedicated in-house voice security engineers capable of managing complex SIP environments spanning UCaaS, contact centres, and legacy PBX systems. Managed service providers are therefore witnessing higher demand for recurring SBC monitoring and policy management services that minimise operational burden and reduce downtime risks.
Deployment Insights
Hybrid deployment accounts for over 42% share in 2026, exceeding the value of US$ 304.42 Million, due to most enterprises require simultaneous support for legacy on-premises telephony infrastructure and modern cloud-based UCaaS platforms during long-term migration cycles. Large organisations require hybrid SBC architecture to maintain sensitive communication data within internal infrastructure while still enabling cloud collaboration capabilities. Growing demand for flexible migration frameworks, business continuity, and secure distributed communications continues to strengthen adoption of hybrid SBC environments across large enterprises.
Cloud-based SBC deployment is the fastest growing model due to enterprises increasingly require simplified communication infrastructure that supports remote workforces, distributed branch operations, and rapid UCaaS adoption without deploying physical appliances. Cloud-hosted SBCs reduce upfront capital expenditure while enabling faster scalability and centralised session management across geographically dispersed users. The increasing shift toward subscription-based communication infrastructure and fully virtualised enterprise networks continues to accelerate cloud SBC adoption globally.
Session Capacity Insights
The 1,001-5,000 sessions tier is poised to accounts for over 35% of the global enterprise session border controller share in 2026, surpassing US$ 253.68 Million, due to this capacity range aligns with the operational requirements of mid-to-large enterprises managing multi-site voice communications and regional contact centre operations. Enterprises require SBC platforms in this range to support high concurrent call volumes across branch offices, customer support operations, and SIP trunking environments without experiencing session congestion. Organizations also require scalable session management capabilities that balance performance, cost efficiency, and future expansion flexibility.
The Above 5,000 sessions capacity is the fastest growing segment as hyperscale communication providers, large telecom operators, and multinational enterprises increasingly require ultra-high-capacity SBC environments capable of managing tens of thousands of encrypted voice sessions simultaneously. Enterprises also require advanced traffic balancing, fraud detection, and codec interoperability capabilities to manage expanding global voice traffic volumes. The growth of AI-powered customer engagement platforms, large remote workforces, and cloud telephony ecosystems is significantly increasing concurrent SIP session demand.
Industry Insights
IT & Telecommunications segment are likely to register over 26% share in 2026, equivalent to US$ 188.45 Million. These organizations require SBC platforms to secure network borders, prevent toll fraud, manage call admission control, and ensure interoperability between customer systems and carrier networks. Telecommunications providers also require continuous SBC upgrades to support encrypted voice traffic, high-definition codecs, and increasing enterprise voice security standards. The rapid growth of cloud communications and unified collaboration services continues to increase demand for carrier-grade SBC deployments across telecom infrastructure.
Retail & e-commerce is the fast-growing segment as retailers increasingly require scalable and secure voice infrastructure to support omnichannel customer engagement, AI-powered voice assistants, and cloud-based contact centre platforms. E-commerce businesses experience sudden spikes in customer interaction volumes during promotional campaigns, seasonal sales, and order support activities, creating higher demand for scalable SBC deployments. The expansion of click-to-call services, automated voice bots, and distributed fulfilment operations is further increasing SIP session traffic across retail communication networks.
Regional Insights
North America Enterprise Session Border Controller Market Trends and Insights
North America holds over 40.0% of the global enterprise session border controller market share in 2026, reaching US$ 289.92 Million, supported by the region’s high concentration of enterprises adopting Unified Communications-as-a-Service (UCaaS) and SIP-based cloud telephony infrastructure. Regulatory frameworks in the United States and Canada, particularly HIPAA-driven voice security compliance requirements enforced by the U.S. Department of Health and Human Services, are accelerating enterprise investment in encrypted voice session management and secure SIP interconnectivity across healthcare, banking, and public sector environments.
The United States accounts for more than 83% of the North American enterprise session border controller market in 2026, surpassing US$ 240.63 Million, driven by the country’s advanced enterprise UCaaS adoption ecosystem and rapid migration from legacy PBX systems toward cloud-native voice platforms. According to a study, over half of large U.S. enterprises had adopted cloud-based telephony platforms by 2025, significantly increasing demand for SBC solutions to manage SIP security, interoperability, and traffic orchestration.
The expansion of enterprise 5G services by telecom operators such as Verizon Communications and T-Mobile US is creating additional SBC deployment opportunities at the network edge as enterprises integrate mobile-first communication strategies.
Europe Enterprise Session Border Controller Market Trends and Insights
Europe enterprise session border controller market is expected to reach over US$ 188.45 Million, supported by regulatory enforcement under the updated NIS2 cybersecurity framework issued by the European Union Agency for Cybersecurity. Enterprises across the region are increasingly deploying enterprise SBC platforms to secure SIP-based communications, ensure encryption, and strengthen ICT risk management capabilities. Large-scale PSTN and ISDN switch-off programmes led by carriers such as Deutsche Telekom and Orange S.A. are accelerating the transition toward fully IP-based enterprise telephony networks.
Germany holds over 22% of the Europe enterprise session border controller market in 2026, surpassing US$ 41.46 Million, driven by the country’s Industrie 4.0 manufacturing transformation initiatives that integrate secure real-time voice and unified communications into industrial operational technology environments.
The United Kingdom accounts for more than 20.0% of the regional market, reaching US$ 37.69 Million, supported by Openreach’s nationwide Digital PSTN Programme that mandates migration from analogue and ISDN voice services to IP-based communications. The UK Financial Conduct Authority’s operational resilience regulations are increasing SBC adoption among financial institutions seeking high-availability and redundant communication infrastructure.
France market growth is supported by managed SIP trunking expansion from Orange Business and the country’s nationwide fibre broadband rollout programme under Plan France Très Haut Débit. Italy is expected to surpass the value of US$ 32.04 Million, as Telecom Italia continues modernizing its IP network infrastructure and driving enterprise migration toward SIP-enabled communication systems. Regulatory frameworks promoting IP-based emergency communications and secure enterprise connectivity across Nordic and Central European countries are further strengthening long-term SBC deployment demand.
Asia Pacific Enterprise Session Border Controller Market Trends and Insights
Asia Pacific enterprise session border controller market is expected to exceed the value of US$ 159.46 Million by 2026 and remains the fastest-growing regional market with a CAGR of 11.8% through 2033, Regional ICT modernization frameworks promoted by the Asia-Pacific Telecommunity are further encouraging encrypted enterprise voice infrastructure adoption. Expanding investments in hyperscale data centres, enterprise WAN modernisation, and UCaaS connectivity continue to strengthen long-term SBC deployment demand across the region.
China enterprise session border controller market holds more than 40% of the Asia Pacific market in 2026, surpassing US$ 63.78 Million, supported by large-scale deployments of enterprise communication platforms from Huawei Technologies across state-owned enterprises, financial institutions, and government agencies, where domestically developed SBC infrastructure is increasingly embedded within IP telephony networks. The Japan market expected to surpass the value of US$ 31.89 Million, supported by managed SIP trunking expansion from NTT Communications and rising integration of IP voice systems into smart manufacturing environments under the Society 5.0 initiative.
The India enterprise session border controller market is expected to exceed the value of US$ 23.92 Million by 2026. Enterprise communication expansion by Reliance Jio across metropolitan markets is accelerating replacement of legacy ISDN infrastructure, increasing SBC deployment for session security, policy enforcement, and call routing management.
Southeast Asia market, reaching US$ 19.13 Million, with Singapore, Indonesia, and Thailand leading adoption as enterprises deploy UCaaS and cloud collaboration platforms to support distributed operations. Carrier-neutral SIP interconnect initiatives led by Singtel are further strengthening SBC adoption across ASEAN manufacturing, logistics, and financial services sectors.
Competitive Landscape
The global enterprise session border controller market is moderately consolidated, with a small group of established vendors accounting for a significant share of global revenue. Competition is increasingly centered on cloud-native SBC virtualization, interoperability with unified communications platforms, and the ability to support hybrid and multi-cloud enterprise deployments. Vendors offering flexible software-based deployment models and subscription-driven pricing are gaining traction, particularly among SMEs transitioning from legacy telephony systems.
Suppliers heavily dependent on traditional hardware appliance sales face growing pressure as enterprises shift toward scalable, recurring software-centric procurement models.
Key Developments:
- In March 2026, TelcoBridges announced updates to its ProSBC Session Border Controller platform, enhancing SIP security, routing intelligence, interoperability, and virtualization capabilities for enterprise and carrier communication networks. The upgrades support growing demand for secure cloud communications, VoIP fraud prevention, and scalable SBC deployments across UCaaS and contact center environments.
- In January 2026: Oracle released critical security patches for its Session Border Controller software versions 9.3.0 and 10.0.0, addressing vulnerabilities impacting enterprise voice and unified communications infrastructure. The update highlights the growing importance of cybersecurity and lifecycle management in Enterprise Session Border Controller deployments used for SIP trunking, UCaaS, and real-time communication networks.
Companies Covered in Enterprise Session Border Controller Market
- Oracle Corporation
- Ribbon Communications Inc.
- Cisco Systems, Inc.
- AudioCodes Ltd.
- Huawei Technologies Co., Ltd.
- Nokia Corporation
- Telefonaktiebolaget LM Ericsson
- Avaya Holdings Corp.
- Sangoma Technologies Corporation
- ADTRAN Holdings, Inc.
- Dialogic Corporation
- Ingate Systems AB
- Patton Electronics Co.
- Metaswitch Networks Ltd.
- Others
Frequently Asked Questions
The global enterprise session border controller market is valued at US$ 724.8 Million in 2026 and is projected to reach US$ 1,179.2 Million by 2033, expanding at a CAGR of 7.2%, due to mandatory enterprise migration from legacy PSTN and ISDN infrastructure to SIP-based IP telephony networks, driven by carrier switch-off programmes across North America, Europe, and Asia Pacific.
The market growth is fueled by rising cybersecurity and compliance requirements such as the EU NIS2 Directive, along with increasing adoption of multi-vendor UCaaS environments. Enterprises are deploying SBCs to ensure secure communication, interoperability, and seamless cloud telephony integration.
Software segment holds the largest market share over 47.0% due to strong enterprise preference for virtualized and cloud-based SBC deployments. It provides scalability, lower infrastructure costs, and easier integration with modern IT environments.
North America dominates the market with more than 40.0% share in 2026, supported by high UCaaS adoption and strict security regulations across healthcare, government, and defense sectors. Large enterprises in the region are increasingly investing in secure multi-cloud communication infrastructure.
A major opportunity lies in developing SBC solutions optimized for private 5G enterprise networks in manufacturing and logistics sectors. The demand is expected to rise as industrial enterprises adopt converged voice and operational technology networks requiring advanced session security and interoperability.
The leading companies include Oracle Corporation, Ribbon Communications Inc., Cisco Systems, Inc., AudioCodes Ltd., Huawei Technologies Co., Ltd., Nokia Corporation, Telefonaktiebolaget LM Ericsson among others.


