


1. Executive Summary
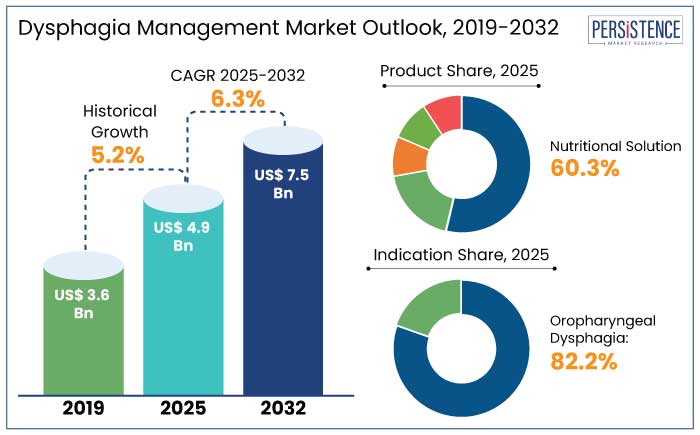
1.1. Global Dysphagia Management Market Snapshot, 2025 and 2032
1.2. Market Opportunity Assessment, 2025 – 2032, US$ Bn
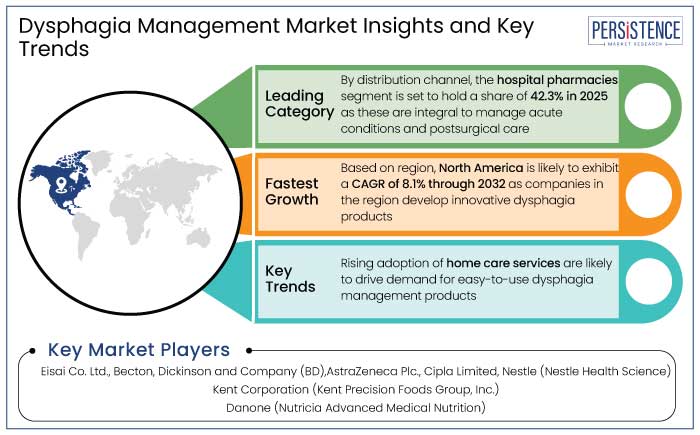
1.3. Key Market Trends
1.4. Future Market Projections
1.5. Premium Market Insights
1.6. Industry Developments and Key Market Events
1.7. PMR Analysis and Recommendations
2. Market Overview
2.1. Market Scope and Definition
2.2. Market Dynamics
2.2.1. Drivers
2.2.2. Restraints
2.2.3. Opportunity
2.2.4. Key Trends
2.3. Macro-Economic Factors
2.3.1. Global Sectorial Outlook
2.3.2. Global GDP Growth Outlook
2.4. COVID-19 Impact Analysis
2.5. Forecast Factors – Relevance and Impact
3. Value Added Insights
3.1. Product Adoption Analysis
3.2. Regulatory Landscape
3.3. Value Chain Analysis
3.4. PESTLE Analysis
3.5. Porter’s Five Force Analysis
4. Global Dysphagia Management Market Outlook
4.1. Key Highlights
4.1.1. Market Size (US$ Bn) and Y-o-Y Growth
4.1.2. Absolute $ Opportunity
4.2. Market Size (US$ Bn) Analysis and Forecast
4.2.1. Historical Market Size (US$ Bn) Analysis, 2019-2023
4.2.2. Current Market Size (US$ Bn) Analysis and Forecast, 2025 – 2032
4.3. Global Dysphagia Management Market Outlook: Product
4.3.1. Introduction / Key Findings
4.3.2. Historical Market Size (US$ Bn) Analysis, By Product, 2019 – 2023
4.3.3. Current Market Size (US$ Bn) Analysis and Forecast, By Product, 2025 – 2032
4.3.3.1. Drug (Proton Pump Inhibitors)
4.3.3.2. Feeding Tubes
4.3.3.2.1. Naso-Gastric Tubes
4.3.3.2.2. PEG Tubes
4.3.3.3. Nutritional Solutions
4.3.3.3.1. Thickeners
4.3.3.3.2. Beverages
4.3.3.3.3. Purees
4.3.4. Market Attractiveness Analysis: Product
4.4. Global Dysphagia Management Market Outlook: Indication
4.4.1. Introduction / Key Findings
4.4.2. Historical Market Size (US$ Bn), By Indication, 2019 – 2023
4.4.3. Current Market Size (US$ Bn) Analysis and Forecast, By Indication, 2025 – 2032
4.4.3.1. Oropharyngeal Dysphagia
4.4.3.2. Esophageal Dysphagia
4.4.4. Market Attractiveness Analysis: Indication
4.5. Global Dysphagia Management Market Outlook: Distribution Channel
4.5.1. Introduction / Key Findings
4.5.2. Historical Market Size (US$ Bn), By Distribution Channel, 2019 – 2023
4.5.3. Current Market Size (US$ Bn) Analysis and Forecast, By Distribution Channel, 2025 – 2032
4.5.3.1. Hospital Pharmacies
4.5.3.2. Retail Pharmacies
4.5.3.3. Drug Stores
4.5.3.4. Specialty Clinics
5. Global Dysphagia Management Market Outlook: Region
5.1. Key Highlights
5.2. Historical Market Size (US$ Bn) Analysis, By Region, 2019 – 2023
5.3. Current Market Size (US$ Bn) Analysis and Forecast, By Region, 2025 – 2032
5.3.1. North America
5.3.2. Europe
5.3.3. East Asia
5.3.4. South Asia and Oceania
5.3.5. Latin America
5.3.6. Middle East & Africa
5.4. Market Attractiveness Analysis: Region
6. North America Dysphagia Management Market Outlook
6.1. Key Highlights
6.2. Historical Market Size (US$ Bn) Analysis, By Market, 2019 – 2023
6.2.1. By Country
6.2.2. By Product
6.2.3. By Indication
6.2.4. By Distribution Channel
6.3. Current Market Size (US$ Bn) Analysis and Forecast, By Country, 2025 – 2032
6.3.1. U.S.
6.3.2. Canada
6.4. Current Market Size (US$ Bn) Analysis and Forecast, By Product, 2025 – 2032
6.4.1. Drug (Proton Pump Inhibitors)
6.4.2. Feeding Tubes
6.4.2.1. Naso-Gastric Tubes
6.4.2.2. PEG Tubes
6.4.3. Nutritional Solutions
6.4.3.1. Thickeners
6.4.3.2. Beverages
6.4.3.3. Purees
6.5. Current Market Size (US$ Bn) Analysis and Forecast, By Indication, 2025 – 2032
6.5.1. Oropharyngeal Dysphagia
6.5.2. Esophageal Dysphagia
6.6. Current Market Size (US$ Bn) Analysis and Forecast, By Distribution Channel, 2025 – 2032
6.6.1. Hospital Pharmacies
6.6.2. Retail Pharmacies
6.6.3. Drug Stores
6.6.4. Specialty Clinics
6.7. Market Attractiveness Analysis
7. Europe Dysphagia Management Market Outlook
7.1. Key Highlights
7.2. Historical Market Size (US$ Bn) Analysis, By Market, 2019 – 2023
7.2.1. By Country
7.2.2. By Product
7.2.3. By Indication
7.2.4. By Distribution Channel
7.3. Current Market Size (US$ Bn) Analysis and Forecast, By Country, 2025 – 2032
7.3.1. Germany
7.3.2. France
7.3.3. U.K.
7.3.4. Italy
7.3.5. Spain
7.3.6. Russia
7.3.7. Türkiye
7.3.8. Rest of Europe
7.4. Current Market Size (US$ Bn) Analysis and Forecast, By Product, 2025 – 2032
7.4.1. Drug (Proton Pump Inhibitors)
7.4.2. Feeding Tubes
7.4.2.1. Naso-Gastric Tubes
7.4.2.2. PEG Tubes
7.4.3. Nutritional Solutions
7.4.3.1. Thickeners
7.4.3.2. Beverages
7.4.3.3. Purees
7.5. Current Market Size (US$ Bn) Analysis and Forecast, By Indication, 2025 – 2032
7.5.1. Oropharyngeal Dysphagia
7.5.2. Esophageal Dysphagia
7.6. Current Market Size (US$ Bn) Analysis and Forecast, By Distribution Channel, 2025 – 2032
7.6.1. Hospital Pharmacies
7.6.2. Retail Pharmacies
7.6.3. Drug Stores
7.6.4. Specialty Clinics
7.7. Market Attractiveness Analysis
8. East Asia Dysphagia Management Market Outlook
8.1. Key Highlights
8.2. Historical Market Size (US$ Bn) Analysis, By Market, 2019 – 2023
8.2.1. By Country
8.2.2. By Product
8.2.3. By Indication
8.2.4. By Distribution Channel
8.3. Current Market Size (US$ Bn) Analysis and Forecast, By Country, 2025 – 2032
8.3.1. China
8.3.2. Japan
8.3.3. South Korea
8.4. Current Market Size (US$ Bn) Analysis and Forecast, By Product, 2025 – 2032
8.4.1. Drug (Proton Pump Inhibitors)
8.4.2. Feeding Tubes
8.4.2.1. Naso-Gastric Tubes
8.4.2.2. PEG Tubes
8.4.3. Nutritional Solutions
8.4.3.1. Thickeners
8.4.3.2. Beverages
8.4.3.3. Purees
8.5. Current Market Size (US$ Bn) Analysis and Forecast, By Indication, 2025 – 2032
8.5.1. Oropharyngeal Dysphagia
8.5.2. Esophageal Dysphagia
8.6. Current Market Size (US$ Bn) Analysis and Forecast, By Distribution Channel, 2025 – 2032
8.6.1. Hospital Pharmacies
8.6.2. Retail Pharmacies
8.6.3. Drug Stores
8.6.4. Specialty Clinics
8.7. Market Attractiveness Analysis
9. South Asia & Oceania Dysphagia Management Market Outlook
9.1. Key Highlights
9.2. Historical Market Size (US$ Bn) Analysis, By Market, 2019 – 2023
9.2.1. By Country
9.2.2. By Product
9.2.3. By Indication
9.2.4. By Distribution Channel
9.3. Current Market Size (US$ Bn) Analysis and Forecast, By Country, 2025 – 2032
9.3.1. India
9.3.2. Southeast Asia
9.3.3. ANZ
9.3.4. Rest of South Asia & Oceania
9.4. Current Market Size (US$ Bn) Analysis and Forecast, By Product, 2025 – 2032
9.4.1. Drug (Proton Pump Inhibitors)
9.4.2. Feeding Tubes
9.4.2.1. Naso-Gastric Tubes
9.4.2.2. PEG Tubes
9.4.3. Nutritional Solutions
9.4.3.1. Thickeners
9.4.3.2. Beverages
9.4.3.3. Purees
9.5. Current Market Size (US$ Bn) Analysis and Forecast, By Indication, 2025 – 2032
9.5.1. Oropharyngeal Dysphagia
9.5.2. Esophageal Dysphagia
9.6. Current Market Size (US$ Bn) Analysis and Forecast, By Distribution Channel, 2025 – 2032
9.6.1. Hospital Pharmacies
9.6.2. Retail Pharmacies
9.6.3. Drug Stores
9.6.4. Specialty Clinics
9.7. Market Attractiveness Analysis
10. Latin America Dysphagia Management Market Outlook
10.1. Key Highlights
10.2. Historical Market Size (US$ Bn) Analysis, By Market, 2019 – 2023
10.2.1. By Country
10.2.2. By Product
10.2.3. By Indication
10.2.4. By Distribution Channel
10.3. Current Market Size (US$ Bn) Analysis and Forecast, By Country, 2025 – 2032
10.3.1. Brazil
10.3.2. Mexico
10.3.3. Rest of Latin America
10.4. Current Market Size (US$ Bn) Analysis and Forecast, By Product, 2025 – 2032
10.4.1. Drug (Proton Pump Inhibitors)
10.4.2. Feeding Tubes
10.4.2.1. Naso-Gastric Tubes
10.4.2.2. PEG Tubes
10.4.3. Nutritional Solutions
10.4.3.1. Thickeners
10.4.3.2. Beverages
10.4.3.3. Purees
10.5. Current Market Size (US$ Bn) Analysis and Forecast, By Indication, 2025 – 2032
10.5.1. Oropharyngeal Dysphagia
10.5.2. Esophageal Dysphagia
10.6. Current Market Size (US$ Bn) Analysis and Forecast, By Distribution Channel, 2025 – 2032
10.6.1. Hospital Pharmacies
10.6.2. Retail Pharmacies
10.6.3. Drug Stores
10.6.4. Specialty Clinics
10.7. Market Attractiveness Analysis
11. Middle East & Africa Dysphagia Management Market Outlook
11.1. Key Highlights
11.2. Historical Market Size (US$ Bn) Analysis, By Market, 2019 – 2023
11.2.1. By Country
11.2.2. By Product
11.2.3. By Indication
11.2.4. By Distribution Channel
11.3. Current Market Size (US$ Bn) Analysis and Forecast, By Country, 2025 – 2032
11.3.1. GCC Countries
11.3.2. Egypt
11.3.3. South Africa
11.3.4. Northern Africa
11.3.5. Rest of Middle East & Africa
11.4. Current Market Size (US$ Bn) Analysis and Forecast, By Product, 2025 – 2032
11.4.1. Drug (Proton Pump Inhibitors)
11.4.2. Feeding Tubes
11.4.2.1. Naso-Gastric Tubes
11.4.2.2. PEG Tubes
11.4.3. Nutritional Solutions
11.4.3.1. Thickeners
11.4.3.2. Beverages
11.4.3.3. Purees
11.5. Current Market Size (US$ Bn) Analysis and Forecast, By Indication, 2025 – 2032
11.5.1. Oropharyngeal Dysphagia
11.5.2. Esophageal Dysphagia
11.6. Current Market Size (US$ Bn) Analysis and Forecast, By Distribution Channel, 2025 – 2032
11.6.1. Hospital Pharmacies
11.6.2. Retail Pharmacies
11.6.3. Drug Stores
11.6.4. Specialty Clinics
11.7. Market Attractiveness Analysis
12. Competition Landscape
12.1. Market Share Analysis, 2025
12.2. Market Structure
12.2.1. Competition Intensity Mapping By Market
12.2.2. Competition Dashboard
12.3. Company Profiles (Details – Overview, Financials, Strategy, Recent Developments)
12.3.1. Eisai Co. Ltd.
12.3.1.1. Overview
12.3.1.2. Segments and Products
12.3.1.3. Key Financials
12.3.1.4. Market Developments
12.3.1.5. Market Strategy
12.3.2. Becton, Dickinson and Company (BD)
12.3.3. AstraZeneca Plc.
12.3.4. Cipla Limited
12.3.5. Nestle (Nestle Health Science)
12.3.6. Kent Corporation (Kent Precision Foods Group, Inc.)
12.3.7. Danone (Nutricia Advanced Medical Nutrition)
12.3.8. Cook Group (Cook Medical Inc.)
12.3.9. Novartis AG
12.3.10. Lannett
12.3.11. Hormel Foods Corporation
12.3.12. Abbott
12.3.13. Ingredion Incorporated
12.3.14. IFF Nutrition & Biosciences
12.3.15. CP Kelco U.S., Inc.
12.3.16. Deosen Biochemical (Ordos) Ltd.
12.3.17. Brenntag Sdn. Bhd.
12.3.18. R.T. Vanderbilt Holding Company, Inc.
12.3.19. Flavour Creations
12.3.20. Welltop Food Ingredients Sdn. Bhd
13. Appendix
13.1. Research Methodology
13.2. Research Assumptions
13.3. Acronyms and Abbreviations

Loading page data
Please wait a moment


