


- Executive Summary
- Global Compression Socks Market Outlook
- Global Compression Socks Market Outlook: Services
- Introduction/Key Findings
- Historical Market Size (US$ Mn) and Analysis, By Services, 2019 - 2024
- Current Market Size (US$ Mn) and Analysis and Forecast, By Services, 2025 - 2032
- Key Market Trends
- Future Market Projections
- Premium Market Insights
- Industry Developments and Key Market Events
- PMR Analysis and Recommendations
- Market Overview
- Market Scope and Definition
- Market Dynamics
- Drivers
- Restraints
- Opportunity
- Challenges
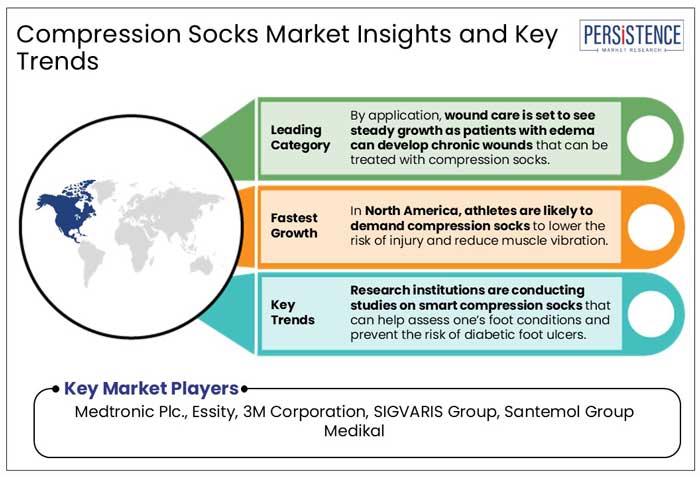
- Key Trends
- Macro-Economic Factors
- Global Sectorial Outlook
- Global GDP Growth Outlook
- COVID-19 Impact Analysis
- Forecast Factors - Relevance and Impact
- Value Added Insights
- Regulatory Landscape
- Product Adoption Analysis
- Value Chain Analysis
- Key Deals and Mergers
- PESTLE Analysis
- Porter’s Five Force Analysis
- Global Compression Socks Market Outlook:
- Key Highlights
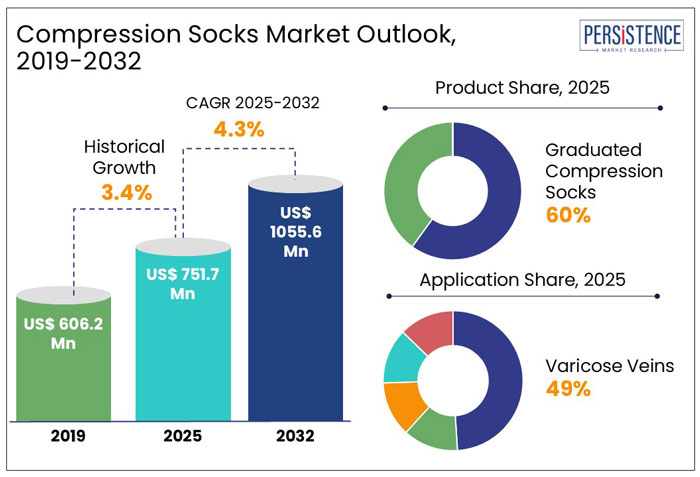
- Market Size (US$ Mn) and Y-o-Y Growth
- Absolute $ Opportunity
- Market Size (US$ Mn) Analysis and Forecast
- Historical Market Size (US$ Mn) Analysis, 2019-2024
- Current Market Size (US$ Mn) Analysis and Forecast, 2025-2032
- Global Compression Socks Market Outlook: Product
- Introduction / Key Findings
- Historical Market Size (US$ Mn) Analysis, By Product, 2019 - 2024
- Current Market Size (US$ Mn) Analysis and Forecast, By Product, 2025 - 2032
- Standard Compression Socks
- Graduated Compression Socks
- Market Attractiveness Analysis: Product
- Global Compression Socks Market Outlook: Application
- Introduction / Key Findings
- Historical Market Size (US$ Mn) Analysis, By Application, 2019 - 2024
- Current Market Size (US$ Mn) Analysis and Forecast, By Application, 2025 - 2032
- Varicose Veins
- Wound Care
- Burns
- Oncology
- Others
- Market Attractiveness Analysis: Application
- Global Compression Socks Market Outlook: End User
- Introduction / Key Findings
- Historical Market Size (US$ Mn) Analysis, By End User, 2019 - 2024
- Current Market Size (US$ Mn) Analysis and Forecast, By End User, 2025 - 2032
- Hospitals
- Ambulatory Surgical Centers
- Clinics
- Online Sales
- Other Healthcare Facilities
- Market Attractiveness Analysis: End User
- Key Highlights
- Global Compression Socks Market Outlook: Region
- Key Highlights
- Historical Market Size (US$ Mn) Analysis, By Region, 2019 - 2024
- Current Market Size (US$ Mn) Analysis and Forecast, By Region, 2025 - 2032
- North America
- Europe
- East Asia
- South Asia and Oceania
- Latin America
- Middle East & Africa
- Market Attractiveness Analysis: Region
- North America Compression Socks Market Outlook:
- Key Highlights
- Historical Market Size (US$ Mn) Analysis, By Market, 2019 - 2024
- By Country
- By Product
- By Application
- By End User
- Current Market Size (US$ Mn) Analysis and Forecast, By Country, 2025 - 2032
- U.S.
- Canada
- Current Market Size (US$ Mn) Analysis and Forecast, By Product, 2025 - 2032
- Standard Compression Socks
- Graduated Compression Socks
- Current Market Size (US$ Mn) Analysis and Forecast, By Application, 2025 - 2032
- Varicose Veins
- Wound Care
- Burns
- Oncology
- Others
- Current Market Size (US$ Mn) Analysis and Forecast, By End User, 2025 - 2032
- Hospitals
- Ambulatory Surgical Centers
- Clinics
- Online Sales
- Other Healthcare Facilities
- Market Attractiveness Analysis
- Europe Compression Socks Market Outlook:
- Key Highlights
- Historical Market Size (US$ Mn) Analysis, By Market, 2019 - 2024
- By Country
- By Product
- By Application
- By End User
- Current Market Size (US$ Mn) Analysis and Forecast, By Country, 2025 - 2032
- Germany
- France
- U.K.
- Italy
- Spain
- Russia
- Türkiye
- Rest of Europe
- Current Market Size (US$ Mn) Analysis and Forecast, By Product, 2025 - 2032
- Standard Compression Socks
- Graduated Compression Socks
- Current Market Size (US$ Mn) Analysis and Forecast, By Application, 2025 - 2032
- Varicose Veins
- Wound Care
- Burns
- Oncology
- Others
- Current Market Size (US$ Mn) Analysis and Forecast, By End User, 2025 - 2032
- Hospitals
- Ambulatory Surgical Centers
- Clinics
- Online Sales
- Other Healthcare Facilities
- Market Attractiveness Analysis
- East Asia Compression Socks Market Outlook:
- Key Highlights
- Historical Market Size (US$ Mn) Analysis, By Market, 2019 - 2024
- By Country
- By Product
- By Application
- By End User
- Current Market Size (US$ Mn) Analysis and Forecast, By Country, 2025 - 2032
- China
- Japan
- South Korea
- Current Market Size (US$ Mn) Analysis and Forecast, By Product, 2025 - 2032
- Standard Compression Socks
- Graduated Compression Socks
- Current Market Size (US$ Mn) Analysis and Forecast, By Application, 2025 - 2032
- Varicose Veins
- Wound Care
- Burns
- Oncology
- Others
- Current Market Size (US$ Mn) Analysis and Forecast, By End User, 2025 - 2032
- Hospitals
- Ambulatory Surgical Centers
- Clinics
- Online Sales
- Other Healthcare Facilities
- Market Attractiveness Analysis
- South Asia & Oceania Compression Socks Market Outlook:
- Key Highlights
- Historical Market Size (US$ Mn) Analysis, By Market, 2019 - 2024
- By Country
- By Product
- By Application
- By End User
- Current Market Size (US$ Mn) Analysis and Forecast, By Country, 2025 - 2032
- India
- Southeast Asia
- ANZ
- Rest of South Asia & Oceania
- Current Market Size (US$ Mn) Analysis and Forecast, By Product, 2025 - 2032
- Standard Compression Socks
- Graduated Compression Socks
- Current Market Size (US$ Mn) Analysis and Forecast, By Application, 2025 - 2032
- Varicose Veins
- Wound Care
- Burns
- Oncology
- Others
- Current Market Size (US$ Mn) Analysis and Forecast, By End User, 2025 - 2032
- Hospitals
- Ambulatory Surgical Centers
- Clinics
- Online Sales
- Other Healthcare Facilities
- Market Attractiveness Analysis
- Latin America Compression Socks Market Outlook:
- Key Highlights
- Historical Market Size (US$ Mn) Analysis, By Market, 2019 - 2024
- By Country
- By Product
- By Application
- By End User
- Current Market Size (US$ Mn) Analysis and Forecast, By Country, 2025 - 2032
- Brazil
- Mexico
- Rest of Latin America
- Current Market Size (US$ Mn) Analysis and Forecast, By Product, 2025 - 2032
- Standard Compression Socks
- Graduated Compression Socks
- Current Market Size (US$ Mn) Analysis and Forecast, By Application, 2025 - 2032
- Varicose Veins
- Wound Care
- Burns
- Oncology
- Others
- Current Market Size (US$ Mn) Analysis and Forecast, By End User, 2025 - 2032
- Hospitals
- Ambulatory Surgical Centers
- Clinics
- Online Sales
- Other Healthcare Facilities
- Market Attractiveness Analysis
- Middle East & Africa Compression Socks Market Outlook:
- Key Highlights
- Historical Market Size (US$ Mn) Analysis, By Market, 2019 - 2024
- By Country
- By Product
- By Application
- By End User
- Current Market Size (US$ Mn) Analysis and Forecast, By Country, 2025 - 2032
- GCC Countries
- Egypt
- South Africa
- Northern Africa
- Rest of Middle East & Africa
- Current Market Size (US$ Mn) Analysis and Forecast, By Product, 2025 - 2032
- Standard Compression Socks
- Graduated Compression Socks
- Current Market Size (US$ Mn) Analysis and Forecast, By Application, 2025 - 2032
- Varicose Veins
- Wound Care
- Burns
- Oncology
- Others
- Current Market Size (US$ Mn) Analysis and Forecast, By End User, 2025 - 2032
- Hospitals
- Ambulatory Surgical Centers
- Clinics
- Online Sales
- Other Healthcare Facilities
- Market Attractiveness Analysis
- Competition Landscape
- Market Share Analysis, 2024
- Market Structure
- Competition Intensity Mapping By Market
- Competition Dashboard
- Company Profiles (Details - Overview, Financials, Strategy, Recent Developments)
- Medtronic Plc.
- Overview
- Segments and Products
- Key Financials
- Market Developments
- Market Strategy
- Essity
- 3M Corporation
- SIGVARIS Group
- Santemol Group Medikal
- Calzificio ZETA S.R.L.
- Sanyleg Srl
- Therafirm
- medi GmbH & Co KG
- Santemol Group Medikal
- Medtronic Plc.
- Appendix
- Research Methodology
- Research Assumptions
- Acronyms and Abbreviations

Loading page data
Please wait a moment


