


- Executive Summary
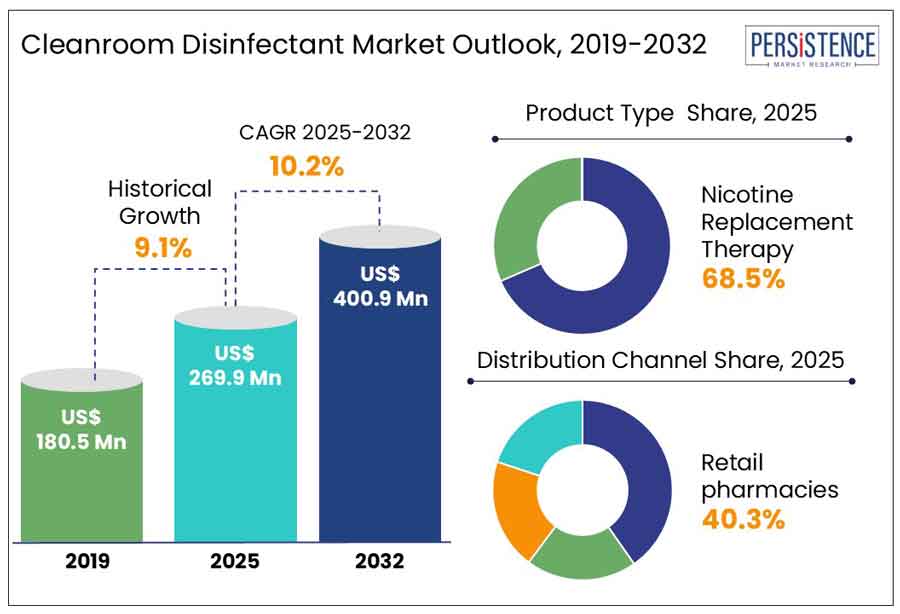
- Global Cleanroom Disinfectant Market Snapshot, 2025 and 2032
- Market Opportunity Assessment, 2024 - 2032, US$ Mn
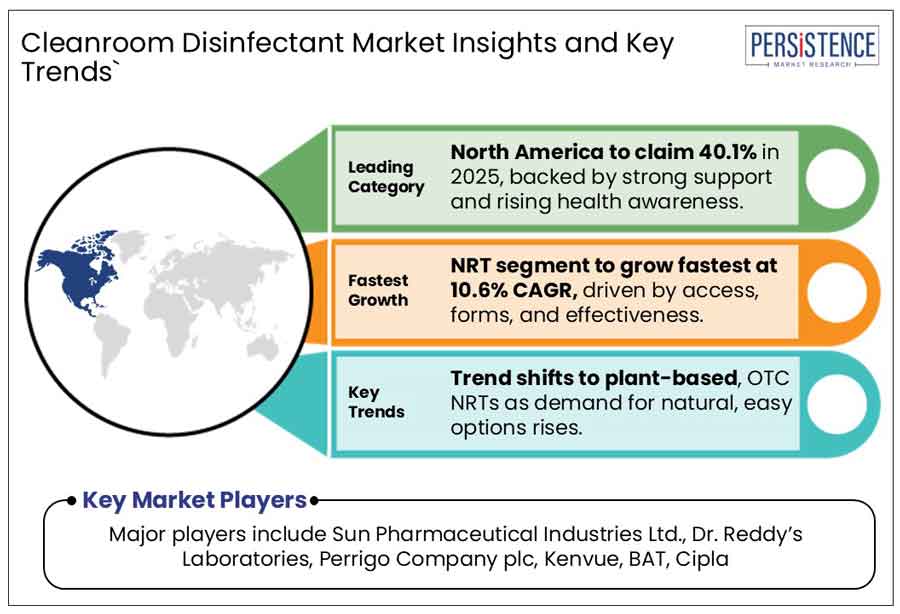
- Key Market Trends
- Future Market Projections
- Premium Market Insights
- Industry Developments and Key Market Events
- PMR Analysis and Recommendations
- Market Overview
- Market Scope and Definition
- Market Dynamics
- Drivers
- Restraints
- Opportunity
- Challenges
- Key Trends
- Macro-Economic Factors
- Global GDP Growth Outlook
- Global Healthcare Spending Outlook
- COVID-19 Impact Analysis
- Forecast Factors - Relevance and Impact
- Value Added Insights
- Regulatory Landscape
- Product Adoption Analysis
- Key Deals and Mergers
- PESTLE Analysis
- Value Chain Analysis
- Porter’s Five Force Analysis
- Global Cleanroom Disinfectant Market Outlook
- Key Highlights
- Market Size (US$ Mn) and Y-o-Y Growth
- Absolute $ Opportunity
- Market Size (US$ Mn) Analysis and Forecast
- Historical Market Size (US$ Mn) Analysis, 2019-2023
- Current Market Size (US$ Mn) Analysis and Forecast, 2024-2032
- Global Cleanroom Disinfectant Market Outlook: Product
- Introduction / Key Findings
- Historical Market Size (US$ Mn) Analysis, By Product, 2019 - 2023
- Current Market Size (US$ Mn) Analysis and Forecast, By Product, 2024 - 2032
- Oxidizing Disinfectants
- Hydrogen Peroxide
- Chlorine
- Iodine
- Others
- Non-Oxidizing Disinfectants
- Alcohol
- Phenols
- Quaternary Ammonium Compounds
- Others
- Oxidizing Disinfectants
- Market Attractiveness Analysis: Product
- Global Cleanroom Disinfectant Market Outlook: End-use Industry
- Introduction / Key Findings
- Historical Market Size (US$ Mn) Analysis, By End-use Industry, 2019 - 2023
- Current Market Size (US$ Mn) Analysis and Forecast, By End-use Industry, 2024 - 2032
- Hospital/Healthcare Facilities
- Biotechnology Industry
- Pharmaceutical Industry
- Medical Devices Industry
- Market Attractiveness Analysis: End-use Industry
- Key Highlights
- Global Cleanroom Disinfectant Market Outlook: Region
- Key Highlights
- Historical Market Size (US$ Mn) Analysis, By Region, 2019 - 2023
- Current Market Size (US$ Mn) Analysis and Forecast, By Region, 2024 - 2032
- North America
- Europe
- East Asia
- South Asia and Oceania
- Latin America
- Middle East & Africa
- Market Attractiveness Analysis: Region
- North America Cleanroom Disinfectant Market Outlook
- Key Highlights
- Historical Market Size (US$ Mn) Analysis, By Market, 2019 - 2023
- By Country
- By Product
- By End-use Industry
- Current Market Size (US$ Mn) Analysis and Forecast By Country, 2024 - 2032
- U.S.
- Canada
- Current Market Size (US$ Mn) Analysis and Forecast By Product, 2024 - 2032
- Oxidizing Disinfectants
- Hydrogen Peroxide
- Chlorine
- Iodine
- Others
- Non-Oxidizing Disinfectants
- Alcohols
- Phenols
- Quaternary Ammonium Compounds
- Others
- Oxidizing Disinfectants
- Current Market Size (US$ Mn) Analysis and Forecast, By End-use Industry, 2024 - 2032
- Hospital/Healthcare Facilities
- Biotechnology Industry
- Pharmaceutical Industry
- Medical Devices Industry
- Market Attractiveness Analysis
- Europe Cleanroom Disinfectant Market Outlook
- Key Highlights
- Historical Market Size (US$ Mn) Analysis, By Market, 2019 - 2023
- By Country
- By Product
- By End-use Industry
- Current Market Size (US$ Mn) Analysis and Forecast, By Country, 2024 - 2032
- Germany
- France
- U.K.
- Italy
- Spain
- Russia
- Türkiye
- Rest of Europe
- Current Market Size (US$ Mn) Analysis and Forecast, By Product, 2024 - 2032
- Oxidizing Disinfectants
- Hydrogen Peroxide
- Chlorine
- Iodine
- Others
- Non-Oxidizing Disinfectants
- Alcohols
- Phenols
- Quaternary Ammonium Compounds
- Others
- Oxidizing Disinfectants
- Current Market Size (US$ Mn) Analysis and Forecast, By End-use Industry, 2024 - 2032
- Hospital/Healthcare Facilities
- Biotechnology Industry
- Pharmaceutical Industry
- Medical Devices Industry
- Market Attractiveness Analysis
- East Asia Cleanroom Disinfectant Market Outlook
- Key Highlights
- Historical Market Size (US$ Mn) Analysis, By Market, 2019 - 2023
- By Country
- By Product
- By End-use Industry
- Current Market Size (US$ Mn) Analysis and Forecast, By Country, 2024 - 2032
- China
- Japan
- South Korea
- Current Market Size (US$ Mn) Analysis and Forecast, By Product, 2024 - 2032
- Oxidizing Disinfectants
- Hydrogen Peroxide
- Chlorine
- Iodine
- Others
- Non-Oxidizing Disinfectants
- Alcohols
- Phenols
- Quaternary Ammonium Compounds
- Others
- Oxidizing Disinfectants
- Current Market Size (US$ Mn) Analysis and Forecast, By End-use Industry, 2024 - 2032
- Hospital/Healthcare Facilities
- Biotechnology Industry
- Pharmaceutical Industry
- Medical Devices Industry
- Market Attractiveness Analysis
- South Asia & Oceania Cleanroom Disinfectant Market Outlook
- Key Highlights
- Historical Market Size (US$ Mn) Analysis, By Market, 2019 - 2023
- By Country
- By Product
- By End-use Industry
- Current Market Size (US$ Mn) Analysis and Forecast, By Country, 2024 - 2032
- India
- Southeast Asia
- ANZ
- Rest of South Asia & Oceania
- Current Market Size (US$ Mn) Analysis and Forecast, By Product, 2024 - 2032
- Oxidizing Disinfectants
- Hydrogen Peroxide
- Chlorine
- Iodine
- Others
- Non-Oxidizing Disinfectants
- Alcohols
- Phenols
- Quaternary Ammonium Compounds
- Others
- Oxidizing Disinfectants
- Current Market Size (US$ Mn) Analysis and Forecast, By End-use Industry, 2024 - 2032
- Hospital/Healthcare Facilities
- Biotechnology Industry
- Pharmaceutical Industry
- Medical Devices Industry
- Market Attractiveness Analysis
- Latin America Cleanroom Disinfectant Market Outlook
- Key Highlights
- Historical Market Size (US$ Mn) Analysis, By Market, 2019 - 2023
- By Country
- By Product
- By End-use Industry
- Current Market Size (US$ Mn) Analysis and Forecast, By Country, 2024 - 2032
- Brazil
- Mexico
- Rest of Latin America
- Current Market Size (US$ Mn) Analysis and Forecast, By Product, 2024 - 2032
- Oxidizing Disinfectants
- Hydrogen Peroxide
- Chlorine
- Iodine
- Others
- Non-Oxidizing Disinfectants
- Alcohols
- Phenols
- Quaternary Ammonium Compounds
- Others
- Oxidizing Disinfectants
- Current Market Size (US$ Mn) Analysis and Forecast, By End-use Industry, 2024 - 2032
- Hospital/Healthcare Facilities
- Biotechnology Industry
- Pharmaceutical Industry
- Medical Devices Industry
- Market Attractiveness Analysis
- Middle East & Africa Cleanroom Disinfectant Market Outlook
- Key Highlights
- Historical Market Size (US$ Mn) Analysis, By Market, 2019 - 2023
- By Country
- By Product
- By End-use Industry
- Current Market Size (US$ Mn) Analysis and Forecast, By Country, 2024 - 2032
- GCC Countries
- Egypt
- South Africa
- Northern Africa
- Rest of Middle East & Africa
- Current Market Size (US$ Mn) Analysis and Forecast, By Product, 2024 - 2032
- Oxidizing Disinfectants
- Hydrogen Peroxide
- Chlorine
- Iodine
- Others
- Non-Oxidizing Disinfectants
- Alcohols
- Phenols
- Quaternary Ammonium Compounds
- Others
- Oxidizing Disinfectants
- Current Market Size (US$ Mn) Analysis and Forecast, By End-use Industry, 2024 - 2032
- Hospital/Healthcare Facilities
- Biotechnology Industry
- Pharmaceutical Industry
- Medical Devices Industry
- Market Attractiveness Analysis
- Competition Landscape
- Market Share Analysis, 2024
- Market Structure
- Competition Intensity Mapping By Market
- Competition Dashboard
- Company Profiles (Details - Overview, Financials, Strategy, Recent Developments)
- Ecolab Inc.
- Overview
- Segments and Products
- Key Financials
- Market Developments
- Market Strategy
- STERIS Corporation
- Contec, Inc.
- Kimberly-Clark Corporation
- Texwipe
- Berkshire Corporation
- Cardinal Health
- Illinois Tool Works
- Thermo Fisher Scientific Inc.
- 3M
- DuPont de Nemours, Inc.
- Diversey Holdings, Ltd.
- Getinge AB
- PDI Healthcare
- Belimed AG
- Medline Industries, LP
- Reckitt Benckiser Group plc
- Others
- Ecolab Inc.
- Appendix
- Research Methodology
- Research Assumptions
- Acronyms and Abbreviations

Loading page data
Please wait a moment


