Chromium Carbide Market

Global Market Study on Chromium Carbide: Expanding Application Base in Various Sectors to Augur Well for the Market over 2018-2026

Chromium Carbide Market Segmented By Wear and Corrosion Resistant Coatings, Welding Electrodes, Cutting Tools Application in Mining, Energy, Cement, Steel, Pulp and Paper Glass

- Table of Content -

1. Executive Summary

    1.1. Market Overview

    1.2. Market Analysis

    1.3. PMR Analysis and Recommendations

    1.4. Wheel of Fortune

2. Market Introduction

    2.1. Market Taxonomy

    2.2. Market Definition

    2.3. Supply Chain Overview

    2.4. Production Processes

3. Market Background

    3.1. Macro-Economic Factors

    3.2. Market Dynamics

        3.2.1. Drivers

        3.2.2. Restraints

        3.2.3. Trends

    3.3. Supply Chain Overview

4. Global Chromium Carbide Market Analysis 2013-2017 and Forecast 2018-2026

    4.1. Market Overview

    4.2. Market Volume Projections

    4.3. Pricing Analysis, by Region

    4.4. Market Size Projections

        4.4.1. Y-o-Y Projections

        4.4.2. Absolute $ Opportunity Analysis

5. Global Chromium Carbide Market Analysis 2013-2017 and Forecast 2018-2026, By Application

    5.1. Introduction

        5.1.1. Market Value Share Analysis By Application

        5.1.2. Y-o-Y Growth Analysis By Application

    5.2. Historical Market Size (US$ Mn) and Volume By Application, 2013-2017

    5.3. Market Size (US$ Mn) and Volume Opportunity Assessment By Application, 2018-2028

        5.3.1. Wear Resistant Coatings

        5.3.2. Welding Electrodes

        5.3.3. Cutting Tools

    5.4. Market Attractiveness Analysis By Application

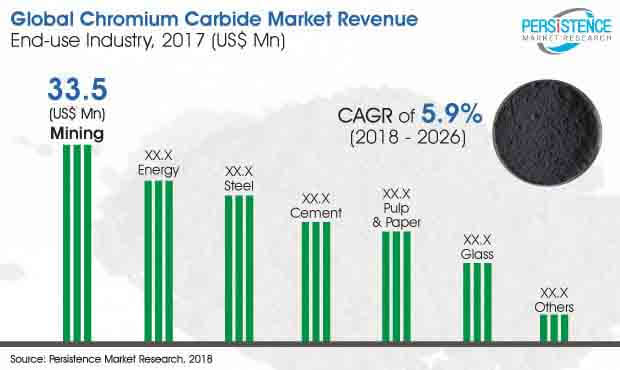
6. Global Chromium Carbide Market Analysis 2013-2017 and Forecast 2018-2026, By End Use Industry

    6.1. Introduction

        6.1.1. Market Value Share Analysis By End Use Industry

        6.1.2. Y-o-Y Growth Analysis By End Use Industry

    6.2. Historical Market Size (US$ Mn) and Volume By End Use Industry, 2013-2017

    6.3. Market Size (US$ Mn) and Volume Opportunity Assessment By End Use Industry, 2018-2028

        6.3.1. Mining

        6.3.2. Energy

        6.3.3. Cement

        6.3.4. Steel

        6.3.5. Pulp & Paper

        6.3.6. Glass

        6.3.7. Others

    6.4. Market Attractiveness Analysis By End Use Industry

7. Global Chromium Carbide Market Analysis 2013-2017 and Forecast 2018-2026, By Region

    7.1. Introduction

        7.1.1. Market Value Share Analysis By Region

        7.1.2. Y-o-Y Growth Analysis By Region

    7.2. Historical Market Size (US$ Mn) and Volume By Region, 2013-2017

    7.3. Market Size (US$ Mn) and Volume Opportunity Assessment By Region, 2018-2028

        7.3.1. North America

        7.3.2. Latin America and Middle East & Africa (LAMEA)

        7.3.3. Europe

        7.3.4. South East Asia (SEA) and Other APAC

        7.3.5. China

        7.3.6. Japan

    7.4. Market Attractiveness Analysis By Region

8. North America Chromium Carbide Market Analysis 2013-2017 and Forecast 2018-2026

    8.1. Introduction

    8.2. Historical Market Size (US$ Mn) and Volume By Market Segments, 2013-2017

    8.3. Market Size (US$ Mn) and Volume Opportunity Assessment By Market Segments, 2018-2028

        8.3.1. By Country

            8.3.1.1. U.S.

            8.3.1.2. Canada

        8.3.2. By Application

            8.3.2.1. Wear Resistant Coatings

            8.3.2.2. Welding Electrodes

            8.3.2.3. Cutting Tools

        8.3.3. By End Use Industry Industry

            8.3.3.1. Mining

            8.3.3.2. Energy

            8.3.3.3. Cement

            8.3.3.4. Steel

            8.3.3.5. Pulp & Paper

            8.3.3.6. Glass

            8.3.3.7. Others

    8.4. Market Attractiveness Analysis

        8.4.1. By Country

        8.4.2. By Application

        8.4.3. By End Use Industry Industry

9. Latin America and Middle East & Africa (LAMEA) Chromium Carbide Market Analysis 2013-2017 and Forecast 2018-2026

    9.1. Introduction

    9.2. Historical Market Size (US$ Mn) and Volume By Market Segments, 2013-2017

    9.3. Market Size (US$ Mn) and Volume Opportunity Assessment By Market Segments, 2018-2028

        9.3.1. By Country

            9.3.1.1. Latin America

            9.3.1.2. Middle East & Africa

        9.3.2. By Application

            9.3.2.1. Wear Resistant Coatings

            9.3.2.2. Welding Electrodes

            9.3.2.3. Cutting Tools

        9.3.3. By End Use Industry

            9.3.3.1. Mining

            9.3.3.2. Energy

            9.3.3.3. Cement

            9.3.3.4. Steel

            9.3.3.5. Pulp & Paper

            9.3.3.6. Glass

            9.3.3.7. Others

    9.4. Market Attractiveness Analysis

        9.4.1. By Country

        9.4.2. By Application

        9.4.3. By End Use Industry

10. Europe Chromium Carbide Market Analysis 2013-2017 and Forecast 2018-2026

    10.1.Introduction

    10.2.Historical Market Size (US$ Mn) and Volume By Market Segments, 2013-2017

    10.3.Market Size (US$ Mn) and Volume Opportunity Assessment By Market Segments, 2018-2028

        10.3.1. By Country

            10.3.1.1. Germany

            10.3.1.2. France

            10.3.1.3. United Kingdom

            10.3.1.4. Italy

            10.3.1.5. Spain

            10.3.1.6. Russia

            10.3.1.7. Rest of Europe

        10.3.2. By Application

            10.3.2.1. Wear Resistant Coatings

            10.3.2.2. Welding Electrodes

            10.3.2.3. Cutting Tools

        10.3.3. By End Use Industry

            10.3.3.1. Mining

            10.3.3.2. Energy

            10.3.3.3. Cement

            10.3.3.4. Steel

            10.3.3.5. Pulp & Paper

            10.3.3.6. Glass

            10.3.3.7. Others

    10.4.Market Attractiveness Analysis

        10.4.1. By Country

        10.4.2. By Application

        10.4.3. By End Use Industry

11. SEA & Other APAC Chromium Carbide Market Analysis 2013-2017 and Forecast 2018-2026

    11.1.Introduction

    11.2.Historical Market Size (US$ Mn) and Volume By Market Segments, 2013-2017

    11.3.Market Size (US$ Mn) and Volume Opportunity Assessment By Market Segments, 2018-2028

        11.3.1. By Country

            11.3.1.1. ASEAN

            11.3.1.2. India

            11.3.1.3. Rest of SEA & APAC

        11.3.2. By Application

            11.3.2.1. Wear Resistant Coatings

            11.3.2.2. Welding Electrodes

            11.3.2.3. Cutting Tools

        11.3.3. By End Use Industry

            11.3.3.1. Mining

            11.3.3.2. Energy

            11.3.3.3. Cement

            11.3.3.4. Steel

            11.3.3.5. Pulp & Paper

            11.3.3.6. Glass

            11.3.3.7. Others

    11.4.Market Attractiveness Analysis

        11.4.1. By Country

        11.4.2. By Application

        11.4.3. By End Use Industry

12. China Chromium Carbide Market Analysis 2013-2017 and Forecast 2018-2026

    12.1.Introduction

    12.2.Historical Market Size (US$ Mn) and Volume By Market Segments, 2013-2017

    12.3.Market Size (US$ Mn) and Volume Opportunity Assessment By Market Segments, 2018-2028

        12.3.1. By Application

            12.3.1.1. Wear Resistant Coatings

            12.3.1.2. Welding Electrodes

            12.3.1.3. Cutting Tools

        12.3.2. By End Use Industry

            12.3.2.1. Mining

            12.3.2.2. Energy

            12.3.2.3. Cement

            12.3.2.4. Steel

            12.3.2.5. Pulp & Paper

            12.3.2.6. Glass

            12.3.2.7. Others

    12.4.Market Attractiveness Analysis

        12.4.1. By Application

        12.4.2. By End Use Industry

13. Japan Chromium Carbide Market Analysis 2013-2017 and Forecast 2018-2026

    13.1.Introduction

    13.2.Historical Market Size (US$ Mn) and Volume By Market Segments, 2013-2017

    13.3.Market Size (US$ Mn) and Volume Opportunity Assessment By Market Segments, 2018-2028

        13.3.1. By Application

            13.3.1.1. Wear Resistant Coatings

            13.3.1.2. Welding Electrodes

            13.3.1.3. Cutting Tools

        13.3.2. By End Use Industry

            13.3.2.1. Mining

            13.3.2.2. Energy

            13.3.2.3. Cement

            13.3.2.4. Steel

            13.3.2.5. Pulp & Paper

            13.3.2.6. Glass

            13.3.2.7. Others

    13.4.Market Attractiveness Analysis

        13.4.1. By Application

        13.4.2. By End Use Industry

14. Competition Landscape

    14.1.Competition Dashboard

    14.2.Market Structure

    14.3.Competition Intensity Mapping, By Region

    14.4.Competition Developments (Mergers, Acquisitions and Expansions)

    14.5.Competition Deep dive

        14.5.1. OC Oerlikon Corporation AG, Pfäffikon

            14.5.1.1. Overview

            14.5.1.2. Product Portfolio

            14.5.1.3. Production Footprint

            14.5.1.4. Sales Footprint

            14.5.1.5. Strategy Overview

                14.5.1.5.1. Marketing Strategy

                14.5.1.5.2. Product Strategy

                14.5.1.5.3. Channel Strategy

        14.5.2. H.C. Starck GmbH

            14.5.2.1. Overview

            14.5.2.2. Product Portfolio

            14.5.2.3. Production Footprint

            14.5.2.4. Sales Footprint

            14.5.2.5. Strategy Overview

                14.5.2.5.1. Marketing Strategy

                14.5.2.5.2. Product Strategy

                14.5.2.5.3. Channel Strategy

        14.5.3. Praxair S.T. Technology, Inc.

            14.5.3.1. Overview

            14.5.3.2. Product Portfolio

            14.5.3.3. Production Footprint

            14.5.3.4. Sales Footprint

            14.5.3.5. Strategy Overview

                14.5.3.5.1. Marketing Strategy

                14.5.3.5.2. Product Strategy

                14.5.3.5.3. Channel Strategy

        14.5.4. Sigma-Aldrich Co. LLC.

            14.5.4.1. Overview

            14.5.4.2. Product Portfolio

            14.5.4.3. Production Footprint

            14.5.4.4. Sales Footprint

            14.5.4.5. Strategy Overview

                14.5.4.5.1. Marketing Strategy

                14.5.4.5.2. Product Strategy

                14.5.4.5.3. Channel Strategy

        14.5.5. Alfa Aesar

            14.5.5.1. Overview

            14.5.5.2. Product Portfolio

            14.5.5.3. Production Footprint

            14.5.5.4. Sales Footprint

            14.5.5.5. Strategy Overview

                14.5.5.5.1. Marketing Strategy

                14.5.5.5.2. Product Strategy

                14.5.5.5.3. Channel Strategy

        14.5.6. Strem Chemicals, Inc.

            14.5.6.1. Overview

            14.5.6.2. Product Portfolio

            14.5.6.3. Production Footprint

            14.5.6.4. Sales Footprint

            14.5.6.5. Strategy Overview

                14.5.6.5.1. Marketing Strategy

                14.5.6.5.2. Product Strategy

                14.5.6.5.3. Channel Strategy

        14.5.7. Changsha Langfeng Metallic Material Co.,Ltd.

            14.5.7.1. Overview

            14.5.7.2. Product Portfolio

            14.5.7.3. Production Footprint

            14.5.7.4. Sales Footprint

            14.5.7.5. Strategy Overview

                14.5.7.5.1. Marketing Strategy

                14.5.7.5.2. Product Strategy

                14.5.7.5.3. Channel Strategy

        14.5.8. Reade International Corp.

            14.5.8.1. Overview

            14.5.8.2. Product Portfolio

            14.5.8.3. Production Footprint

            14.5.8.4. Sales Footprint

            14.5.8.5. Strategy Overview

                14.5.8.5.1. Marketing Strategy

                14.5.8.5.2. Product Strategy

                14.5.8.5.3. Channel Strategy

        14.5.9. NewMet Ltd.

            14.5.9.1. Overview

            14.5.9.2. Product Portfolio

            14.5.9.3. Production Footprint

            14.5.9.4. Sales Footprint

            14.5.9.5. Strategy Overview

                14.5.9.5.1. Marketing Strategy

                14.5.9.5.2. Product Strategy

                14.5.9.5.3. Channel Strategy

        14.5.10. ESPICorp Inc.

            14.5.10.1. Overview

            14.5.10.2. Product Portfolio

            14.5.10.3. Production Footprint

            14.5.10.4. Sales Footprint

            14.5.10.5. Strategy Overview

                14.5.10.5.1. Marketing Strategy

                14.5.10.5.2. Product Strategy

                14.5.10.5.3. Channel Strategy

        14.5.11. Nanoshel LLC

            14.5.11.1. Overview

            14.5.11.2. Product Portfolio

            14.5.11.3. Production Footprint

            14.5.11.4. Sales Footprint

            14.5.11.5. Strategy Overview

                14.5.11.5.1. Marketing Strategy

                14.5.11.5.2. Product Strategy

                14.5.11.5.3. Channel Strategy

        14.5.12. LTS Research Laboratories, Inc.

            14.5.12.1. Overview

            14.5.12.2. Product Portfolio

            14.5.12.3. Production Footprint

            14.5.12.4. Sales Footprint

            14.5.12.5. Strategy Overview

                14.5.12.5.1. Marketing Strategy

                14.5.12.5.2. Product Strategy

                14.5.12.5.3. Channel Strategy

        14.5.13. American Elements

            14.5.13.1. Overview

            14.5.13.2. Product Portfolio

            14.5.13.3. Production Footprint

            14.5.13.4. Sales Footprint

            14.5.13.5. Strategy Overview

                14.5.13.5.1. Marketing Strategy

                14.5.13.5.2. Product Strategy

                14.5.13.5.3. Channel Strategy

        14.5.14. Inframat Corporation

            14.5.14.1. Overview

            14.5.14.2. Product Portfolio

            14.5.14.3. Production Footprint

            14.5.14.4. Sales Footprint

            14.5.14.5. Strategy Overview

                14.5.14.5.1. Marketing Strategy

                14.5.14.5.2. Product Strategy

                14.5.14.5.3. Channel Strategy

        14.5.15. ZhuZhou GuangYuan Cemented Material Co., Ltd

            14.5.15.1. Overview

            14.5.15.2. Product Portfolio

            14.5.15.3. Production Footprint

            14.5.15.4. Sales Footprint

            14.5.15.5. Strategy Overview

                14.5.15.5.1. Marketing Strategy

                14.5.15.5.2. Product Strategy

                14.5.15.5.3. Channel Strategy

15. Assumptions & Acronyms Used

Sample Report

FREE Report Sample is Available

In-depth report coverage is now just a few seconds away

Download PDF Get FREE Report Sample

- List Of Table -

Table 01: Global Chromium Carbide Market Value (US$ Mn) and Volume (Tons) by Application, 2013 - 2026

Table 02: Global Chromium Carbide Market Value (US$ Mn) and Volume (Tons) by End Use Industry, 2013-2026

Table 03: Global Chromium Carbide Market Value (US$ Mn) and Volume (Tons) by Region, 2013-2026

Table 04: North America Chromium Carbide Market Value (US$ Mn) and Volume (Tons) by Country, 2013-2026

Table 05: North America Chromium Carbide Market Value (US$ Mn) and Volume (Tons) by Application, 2013-2026

Table 06: North America Chromium Carbide Market Value (US$ Mn) and Volume (Tons) by End Use Industry, 2013-2026

Table 07: LAMEA Chromium Carbide Market Value (US$ Mn) and Volume (Tons) by Country, 2013-2026

Table 08: LAMEA Chromium Carbide Market Value (US$ Mn) and Volume (Tons) by Application, 2013-2026

Table 09: LAMEA Chromium Carbide Market Value (US$ Mn) and Volume (Tons) by End Use Industry, 2013-2026

Table 10: Europe Chromium Carbide Market Value (US$ Mn) and Volume (Tons) by Country, 2013-2026

Table 11: Europe Chromium Carbide Market Value (US$ Mn) and Volume (Tons) by Application, 2013-2026

Table 12: Europe Chromium Carbide Market Value (US$ Mn) and Volume (Tons) by End Use Industry, 2013-2026

Table 13: SEA & Rest of APAC Chromium Carbide Market Value (US$ Mn) and Volume (Tons) by Country, 2013-2026

Table 14: SEA & Rest of APAC Chromium Carbide Market Value (US$ Mn) and Volume (Tons) by Application, 2013-2026

Table 15: SEA & Rest of APAC Chromium Carbide Market Value (US$ Mn) and Volume (Tons) by End Use Industry, 2013-2026

Table 16: China Chromium Carbide Market Value (US$ Mn) and Volume (Tons) by Application, 2013-2026

Table 17: China Chromium Carbide Market Value (US$ Mn) and Volume (Tons) by End Use Industry, 2013-2026

Table 18: Japan Chromium Carbide Market Value (US$ Mn) and Volume (Tons) by Application, 2013-2026

Table 19: Japan Chromium Carbide Market Value (US$ Mn) and Volume (Tons) by End Use Industry, 2013-2026

Custom Report Cover

Make This Report Your Own

Take Advantage of Intelligence Tailored to your Business Objective

> Get a Customized Version

- List Of Chart -

Figure 01: Global Chromium Carbide Market Value by Region (US$ Mn), 2017

Figure 02: Global Macro-economic Factors Annual Growth (%) VS Industrial Gases Market Growth

Figure 03: Global Chromium Carbide Market Volume (Tons), 2017-2026

Figure 04: Global Chromium Carbide Market Value (US$ Mn) and Y-o-Y Growth Projection, 2016-2026

Figure 05: Global Chromium Carbide Market Value (US$ Mn) Absolute $ Opportunity, 2016-2026

Figure 06: Global Chromium Carbide Market: Supply Demand Scenario (Volume Projections), 2017

Figure 07: Global Chromium Carbide Market Volume Share by Application

Figure 08: Global Chromium Carbide Market Value Share by Application

Figure 09: Global Chromium Carbide Market Value BPS Analysis by Application - 2013, 2018 & 2026

Figure 10: Global Chromium Carbide Market Y-o-Y Growth (%) by Application, 2017-2026

Figure 11: Global Chromium Carbide Market Attractiveness Analysis by Application, 2018 - 2026

Figure 12: Global Chromium Carbide Market Absolute $ Opportunity by Wear & Corrosion Resistant Coatings segment, 2013-2026

Figure 13: Global Chromium Carbide Market Absolute $ Opportunity by Welding Electrodes segment 2013-2026

Figure 14: Global Chromium Carbide Market Absolute $ Opportunity by Cutting Tools segment, 2013-2026

Figure 15: Global Chromium Carbide Market Volume Share by End Use Industry

Figure 16: Global Chromium Carbide Market Value Share by End Use Industry

Figure 17: Global Chromium Carbide Market Value BPS Analysis by End Use Industry - 2013, 2018 & 2026

Figure 18: Global Chromium Carbide Market Y-o-Y Growth (%) by end use industry, 2017 - 2026

Figure 19: Global Chromium Carbide Market Attractiveness Analysis by End Use Industry , 2017 - 2026

Figure 20: Global Chromium Carbide Market Absolute $ Opportunity by Mining segment, 2013-2026

Figure 21: Global Chromium Carbide Market Absolute $ Opportunity by Energy segment 2013-2026

Figure 22: Global Chromium Carbide Market Absolute $ Opportunity by Cement segment, 2013-2026

Figure 23: Global Chromium Carbide Market Absolute $ Opportunity by Steel segment 2013-2026

Figure 24: Global Chromium Carbide Market Absolute $ Opportunity by Pulp & Paper segment, 2013-2026

Figure 25: Global Chromium Carbide Market Absolute $ Opportunity by Glass segment 2013-2026

Figure 26: Global Chromium Carbide Market Absolute $ Opportunity by Others segment, 2013-2026

Figure 27: Global Chromium Carbide Market Volume Share by Region

Figure 28: Global Chromium Carbide Market Value Share by Region

Figure 29: Global Chromium Carbide Market Value BPS Analysis by Region - 2013, 2018 & 2026

Figure 30: Global Chromium Carbide Market Y-o-Y Growth (%) by Region, 2017 - 2026

Figure 31: Global Chromium Carbide Market Attractiveness Analysis By Region, 2017-2026

Figure 32: Global Chromium Carbide Market Absolute $ Opportunity by North America region, 2013-2026

Figure 33: Global Chromium Carbide Market Absolute $ Opportunity by LAMEA region, 2013-2026

Figure 34: Global Chromium Carbide Market Absolute $ Opportunity by Europe region, 2013-2026

Figure 35: Global Chromium Carbide Market Absolute $ Opportunity by SEA & Rest of APAC region 2013-2026

Figure 36: Global Chromium Carbide Market Absolute $ Opportunity by China region, 2013-2026

Figure 37: Global Chromium Carbide Market Absolute $ Opportunity by Japan region, 2013-2026

Figure 38: North America Chromium Carbide Market Value (US$ Mn) and Volume (Tons) Forecast, 2017-2026

Figure 39: North America Chromium Carbide Market BPS Analysis by Country, 2013, 2018 and 2026

Figure 40: North America Chromium Carbide Market Y-o-Y Growth Analysis by Country, 2017-2026

Figure 41: North America Chromium Carbide Market BPS Analysis by Country, 2013, 2018 and 2026

Figure 42: North America Chromium Carbide Market Y-o-Y Growth Analysis by Country, 2017-2026

Figure 43: North America Chromium Carbide Market BPS Analysis by End Use Industry, 2013, 2018 and 2026

Figure 44: North America Chromium Carbide Market Y-o-Y Growth Analysis by End Use Industry, 2017-2026

Figure 45: North America Chromium Carbide Market Attractiveness Analysis by Country, 2018-2026

Figure 46: North America Chromium Carbide Market Attractiveness Analysis by Application, 2018-2026

Figure 47: North America Chromium Carbide Market Attractiveness Analysis by End Use Industry, 2018-2026

Figure 48: North America Chromium Carbide Market Absolute $ Opportunity (US$ Mn), 2016-2027, by Country

Figure 49: Latin America and Middle East & Africa Chromium Carbide Market Value (US$ Mn) and Volume (Tons) Forecast, 2017-2026

Figure 50: LAMEA Chromium Carbide Market BPS Analysis by Country, 2013, 2018 and 2026

Figure 51: LAMEA Chromium Carbide Market Y-o-Y Growth Analysis by Country, 2017-2026

Figure 52: LAMEA Chromium Carbide Market BPS Analysis by Application, 2013, 2018 and 2026

Figure 53: LAMEA Chromium Carbide Market Y-o-Y Growth Analysis by Application, 2017-2026

Figure 54: LAMEA Chromium Carbide Market BPS Analysis by End Use Industry, 2013, 2018 and 2026

Figure 55: LAMEA Chromium Carbide Market Y-o-Y Growth Analysis by End Use Industry, 2017-2026

Figure 56: LAMEA Chromium Carbide Market Attractiveness Analysis by Country, 2017-2026

Figure 57: LAMEA Chromium Carbide Market Attractiveness Analysis by Application, 2017-2026

Figure 58: LAMEA Chromium Carbide Market Attractiveness Analysis by End Use Industry, 2017-2026

Figure 59: LAMEA Chromium Carbide Market Absolute $ Opportunity (US$ Mn), 2016-2027, by Country

Figure 60: Europe Chromium Carbide Market Value (US$ Mn) and Volume (Tons) Forecast, 2017-2026

Figure 61: Europe Chromium Carbide Market BPS Analysis by Country, 2013, 2018 and 2026

Figure 62: Europe Chromium Carbide Market Y-o-Y Growth Analysis by Country, 2017-2026

Figure 63: Europe Chromium Carbide Market BPS Analysis by Application, 2013, 2018 and 2026

Figure 64: Europe Chromium Carbide Market Y-o-Y Growth Analysis by Application, 2017-2026

Figure 65: Europe Chromium Carbide Market BPS Analysis by End Use Industry, 2013, 2018 and 2026

Figure 66: Europe Chromium Carbide Market Y-o-Y Growth Analysis by End Use Industry, 2017-2026

Figure 67: Europe Chromium Carbide Market Attractiveness Analysis by Country, 2018-2026

Figure 68: Europe Chromium Carbide Market Attractiveness Analysis by Application, 2018-2026

Figure 69: Europe Chromium Carbide Market Attractiveness Analysis by End Use Industry, 2018-2026

Figure 70: Europe Chromium Carbide Market Absolute $ Opportunity (US$ Mn), 2017 - 2026 by Country

Figure 71: SEA & Rest of APAC Chromium Carbide Market Value (US$ Mn) and Volume (Tons) Forecast, 2017-2026

Figure 72: SEA & Rest of APAC Chromium Carbide Market BPS Analysis by Country, 2013, 2018 and 2026

Figure 73: SEA & Rest of APAC Chromium Carbide Market Y-o-Y Growth Analysis by Country, 2017-2026

Figure 74: SEA & Rest of APAC Chromium Carbide Market BPS Analysis by Application, 2013, 2018 and 2026

Figure 75: SEA & Rest of APAC Chromium Carbide Market Y-o-Y Growth Analysis by Application, 2017-2026

Figure 76: SEA & Rest of APAC Chromium Carbide Market BPS Analysis by End Use Industry, 2013, 2018 and 2026

Figure 77: SEA & Rest of APAC Chromium Carbide Market Y-o-Y Growth Analysis by End Use Industry, 2017-2026

Figure 78: SEA & Rest of APAC Chromium Carbide Mar ket Attractiveness Analysis by Country, 2017-2026

Figure 79: SEA & Rest of APAC Chromium Carbide Market Attractiveness Analysis by Application, 2017-2026

Figure 80: SEA & Rest of APAC Chromium Carbide Market Attractiveness Analysis by End Use Industry, 2017-2026

Figure 81: SEA & Pacific Chromium Carbide Market Absolute $ Opportunity (US$ Mn), 2017 - 2026 by Country

Figure 82: China Chromium Carbide Market Value (US$ Mn) and Volume (Tons) Forecast, 2017-2026

Figure 83: China Chromium Carbide Market BPS Analysis by Application, 2013, 2018 and 2026

Figure 84: China Chromium Carbide Market Y-o-Y Growth Analysis by Application, 2017-2026

Figure 85: China Chromium Carbide Market BPS Analysis by End Use Industry, 2013, 2018 and 2026

Figure 86: China Chromium Carbide Market Y-o-Y Growth Analysis by End Use Industry, 2017-2026

Figure 87: China Chromium Carbide Market Attractiveness Analysis by Application, 2018-2026

Figure 88: China Chromium Carbide Market Attractiveness Analysis by End Use Industry, 2018-2026

Figure 89: China Chromium Carbide Market Absolute $ Opportunity (US$ Mn), 2017 - 2026

Figure 90: Japan Chromium Carbide Market Value (US$ Mn) and Volume (Tons) Forecast, 2017-2026

Figure 91: Japan Chromium Carbide Market BPS Analysis by Application, 2013, 2018 and 2026

Figure 92: Japan Chromium Carbide Market Y-o-Y Growth Analysis by Application, 2017-2026

Figure 93: Japan Chromium Carbide Market BPS Analysis by End Use Industry, 2013, 2018 and 2026

Figure 94 Japan Chromium Carbide Market Y-o-Y Growth Analysis by End Use Industry, 2017-2026

Figure 95: China Chromium Carbide Market Attractiveness Analysis by Application, 2017-2026

Figure 96: China Chromium Carbide Market Attractiveness Analysis by End Use Industry, 2017-2026

Figure 97: Japan Chromium Carbide Market Absolute $ Opportunity (US$ Mn), 2018-2026 by Country

This site uses cookies, including third-party cookies, that help us to provide and improve our services. Privacy Policy
Google translate