

- Executive Summary
- Global Cell Counting Market Snapshot, 2026 and 2033
- Market Opportunity Assessment, 2026 - 2033, US$ Bn
- Key Market Trends
- Future Market Projections
- Premium Market Insights
- Industry Developments and Key Market Events
- PMR Analysis and Recommendations
- Market Overview
- Market Scope and Definition
- Market Dynamics
- Drivers
- Restraints
- Opportunity
- Key Trends
- Macro-Economic Factors
- Global Sectorial Outlook
- Global GDP Growth Outlook
- COVID-19 Impact Analysis
- Forecast Factors - Relevance and Impact
- Value Added Insights
- Product Adoption Analysis
- Recent Product Launches
- Regulatory Landscape
- Value Chain Analysis
- Key Deals and Mergers
- PESTLE Analysis
- Porter’s Five Force Analysis
- Price Trend Analysis, 2020 - 2033
- Key Highlights
- Key Factors Impacting Product Prices
- Pricing Analysis, By Product
- Regional Prices and Product Preferences
- Global Cell Counting Market Outlook:
- Key Highlights
- Market Size (US$ Bn) and Y-o-Y Growth
- Absolute $ Opportunity
- Market Size (US$ Bn) Analysis and Forecast
- Historical Market Size (US$ Bn) Analysis, 2020-2025
- Market Size (US$ Bn) Analysis and Forecast, 2026-2033
- Global Cell Counting Market Outlook: Product
- Introduction / Key Findings
- Historical Market Size (US$ Bn) Analysis and Volume (Units) Analysis, By Product, 2020 - 2025
- Market Size (US$ Bn) Analysis and Volume (Units) Analysis and Forecast, By Product, 2026 - 2033
- Instruments
- Hemocytometers
- Automated cell counters
- Spectrophotometers
- Flow Cytometers
- Microscopes
- Others
- Consumables & Accessories
- Reagents
- Microplates
- Others
- Instruments
- Market Attractiveness Analysis: By Product
- Global Cell Counting Market Outlook: Application
- Introduction / Key Findings
- Historical Market Size (US$ Bn) Analysis, By Application, 2020 - 2025
- Market Size (US$ Bn) Analysis and Forecast, By Application, 2026 - 2033
- Complete Blood Count
- Stem Cell Research
- Cell Based Therapeutics
- Bioprocessing
- Toxicology
- Others
- Market Attractiveness Analysis: Application
- Global Cell Counting Market Outlook: End User
- Introduction / Key Findings
- Historical Market Size (US$ Bn) Analysis, By End User, 2020 - 2025
- Market Size (US$ Bn) Analysis and Forecast, By End User, 2026 - 2033
- Hospitals
- Diagnostic Laboratories
- Research & Academic Institutes
- Pharmaceutical & Biotechnology Companies
- Others
- Market Attractiveness Analysis: End User
- Key Highlights
- Global Cell Counting Market Outlook: Region
- Key Highlights
- Historical Market Size (US$ Bn) Analysis, By Region, 2020 - 2025
- Market Size (US$ Bn) Analysis and Forecast, By Region, 2026 - 2033
- North America
- Europe
- East Asia
- South Asia and Oceania
- Latin America
- Middle East & Africa
- Market Attractiveness Analysis: Region
- North America Cell Counting Market Outlook:
- Key Highlights
- Historical Market Size (US$ Bn) Analysis, By Market, 2020 - 2025
- By Country
- By Product
- By Application
- By End User
- Market Size (US$ Bn) Analysis and Forecast, By Country, 2026 - 2033
- U.S.
- Canada
- Market Size (US$ Bn) Analysis and Volume (Units) Analysis and Forecast, By Product, 2026 - 2033
- Instruments
-
- Hemocytometers
- Automated cell counters
- Spectrophotometers
- Flow Cytometers
- Microscopes
- Others
-
- Consumables & Accessories
-
- Reagents
- Microplates
- Others
-
- Instruments
- Market Size (US$ Bn) Analysis and Forecast, By Application, 2026 - 2033
- Complete Blood Count
- Stem Cell Research
- Cell Based Therapeutics
- Bioprocessing
- Toxicology
- Others
- Market Size (US$ Bn) Analysis and Forecast, By End User, 2026 - 2033
- Hospitals
- Diagnostic Laboratories
- Research & Academic Institutes
- Pharmaceutical & Biotechnology Companies
- Others
- Market Attractiveness Analysis
- Europe Cell Counting Market Outlook:
- Key Highlights
- Historical Market Size (US$ Bn) Analysis, By Market, 2020 - 2025
- By Country
- By Product
- By Application
- By End User
- Market Size (US$ Bn) Analysis and Forecast, By Country, 2026 - 2033
- Germany
- France
- U.K.
- Italy
- Spain
- Russia
- Rest of Europe
- Market Size (US$ Bn) Analysis and Volume (Units) Analysis and Forecast, By Product, 2026 - 2033
- Instruments
-
- Hemocytometers
- Automated cell counters
- Spectrophotometers
- Flow Cytometers
- Microscopes
- Others
-
- Consumables & Accessories
-
- Reagents
- Microplates
- Others
-
- Instruments
- Market Size (US$ Bn) Analysis and Forecast, By Application, 2026 - 2033
- Complete Blood Count
- Stem Cell Research
- Cell Based Therapeutics
- Bioprocessing
- Toxicology
- Others
- Market Size (US$ Bn) Analysis and Forecast, By End User, 2026 - 2033
- Hospitals
- Diagnostic Laboratories
- Research & Academic Institutes
- Pharmaceutical & Biotechnology Companies
- Others
- Market Attractiveness Analysis
- East Asia Cell Counting Market Outlook:
- Key Highlights
- Historical Market Size (US$ Bn) Analysis, By Market, 2020 - 2025
- By Country
- By Product
- By Application
- By End User
- Market Size (US$ Bn) Analysis and Forecast, By Country, 2026 - 2033
- China
- Japan
- South Korea
- Market Size (US$ Bn) Analysis and Volume (Units) Analysis and Forecast, By Product, 2026 - 2033
- Instruments
-
- Hemocytometers
- Automated cell counters
- Spectrophotometers
- Flow Cytometers
- Microscopes
- Others
-
- Consumables & Accessories
-
- Reagents
- Microplates
- Others
-
- Instruments
- Market Size (US$ Bn) Analysis and Forecast, By Application, 2026 - 2033
- Complete Blood Count
- Stem Cell Research
- Cell Based Therapeutics
- Bioprocessing Toxicology
- Others
- Market Size (US$ Bn) Analysis and Forecast, By End User, 2026 - 2033
- Hospitals
- Diagnostic Laboratories
- Research & Academic Institutes
- Pharmaceutical & Biotechnology Companies
- Others
- Market Attractiveness Analysis
- South Asia & Oceania Cell Counting Market Outlook:
- Key Highlights
- Historical Market Size (US$ Bn) Analysis, By Market, 2020 - 2025
- By Country
- By Product
- By Application
- By End User
- Market Size (US$ Bn) Analysis and Forecast, By Country, 2026 - 2033
- India
- Southeast Asia
- ANZ
- Rest of South Asia & Oceania
- Market Size (US$ Bn) Analysis and Volume (Units) Analysis and Forecast, By Product, 2026 - 2033
- Instruments
-
- cell counters
- Hemocytometers
- Automated Spectrophotometers
- Flow Cytometers
- Microscopes
- Others
-
- Consumables & Accessories
-
- Reagents
- Microplates
- Others
-
- Instruments
- Market Size (US$ Bn) Analysis and Forecast, By Application, 2026 - 2033
- Complete Blood Count
- Stem Cell Research
- Cell Based Therapeutics
- Bioprocessing
- Toxicology
- Others
- Market Size (US$ Bn) Analysis and Forecast, By End User, 2026 - 2033
- Hospitals
- Diagnostic Laboratories
- Research & Academic Institutes
- Pharmaceutical & Biotechnology Companies
- Others
- Market Attractiveness Analysis
- Latin America Cell Counting Market Outlook:
- Key Highlights
- Historical Market Size (US$ Bn) Analysis, By Market, 2020 - 2025
- By Country
- By Product
- By Application
- By End User
- Market Size (US$ Bn) Analysis and Forecast, By Country, 2026 - 2033
- Brazil
- Mexico
- Rest of Latin America
- Market Size (US$ Bn) Analysis and Volume (Units) Analysis and Forecast, By Product, 2026 - 2033
- Instruments
-
- cell counters
- Hemocytometers
- Automated Spectrophotometers
- Flow Cytometers
- Microscopes
- Others
-
- Consumables & Accessories
-
- Reagents
- Microplates
- Others
-
- Instruments
- Market Size (US$ Bn) Analysis and Forecast, By Application, 2026 - 2033
- Complete Blood Count
- Stem Cell Research
- Cell Based Therapeutics
- Bioprocessing
- Toxicology
- Others
- Market Size (US$ Bn) Analysis and Forecast, By End User, 2026 - 2033
- Hospitals
- Diagnostic Laboratories
- Research & Academic Institutes
- Pharmaceutical & Biotechnology Companies
- Others
- Market Attractiveness Analysis
- Middle East & Africa Cell Counting Market Outlook:
- Key Highlights
- Historical Market Size (US$ Bn) Analysis, By Market, 2020 - 2025
- By Country
- By Product
- By Application
- By End User
- Market Size (US$ Bn) Analysis and Forecast, By Country, 2026 - 2033
- GCC Countries
- Egypt
- South Africa
- Northern Africa
- Rest of Middle East & Africa
- Market Size (US$ Bn) Analysis and Volume (Units) Analysis and Forecast, By Product, 2026 - 2033
- Instruments
-
- cell counters
- Hemocytometers
- Automated Spectrophotometers
- Flow Cytometers
- Microscopes
- Others
-
- Consumables & Accessories
-
- Reagents
- Microplates
- Others
-
- Instruments
- Market Size (US$ Bn) Analysis and Forecast, By Application, 2026 - 2033
- Complete Blood Count
- Stem Cell Research
- Cell Based Therapeutics
- Bioprocessing
- Toxicology
- Others
- Market Size (US$ Bn) Analysis and Forecast, By End User, 2026 - 2033
- Hospitals
- Diagnostic Laboratories
- Research & Academic Institutes
- Pharmaceutical & Biotechnology Companies
- Others
- Market Attractiveness Analysis
- Competition Landscape
- Market Structure
- Competition Intensity Mapping By Market
- Competition Dashboard
- Company Profiles (Details - Overview, Recent Developments)
- Thermo Fisher Scientific, Inc.
- Overview
- Segments and Product & End User
- Key Financials
- Market Developments
- Market Strategy
- Merck KGaA
- Agilent Technologies
- PerkinElmer, Inc.
- BD
- Danaher
- Bio-Rad Laboratories, Inc.
- BioTek Instruments, Inc.
- GE Healthcare
- DeNovix Inc.
- Abbott Laboratories
- Beckman Coulter, Inc.
- Sysmex Corporation
- Olympus Corporation
- Others
- Thermo Fisher Scientific, Inc.
- Market Structure
- Appendix
- Research Methodology
- Research Assumptions
- Acronyms and Abbreviations


- Biotechnology
- Cell Counting Market
Cell Counting Market Size, Share, Growth, and Regional Forecast, 2026 - 2033
Cell Counting Market by Product (Instruments and Consumables & Accessories), by Application (Complete Blood Count, Stem Cell Research, Cell Based Therapeutics, Bioprocessing, Toxicology, and Others), by End User (Hospitals, Diagnostic Laboratories, Research & Academic Institutes, Pharmaceutical & Biotechnology Companies, and Others), and Regional Analysis from 2026 - 2033
Key Industry Highlights
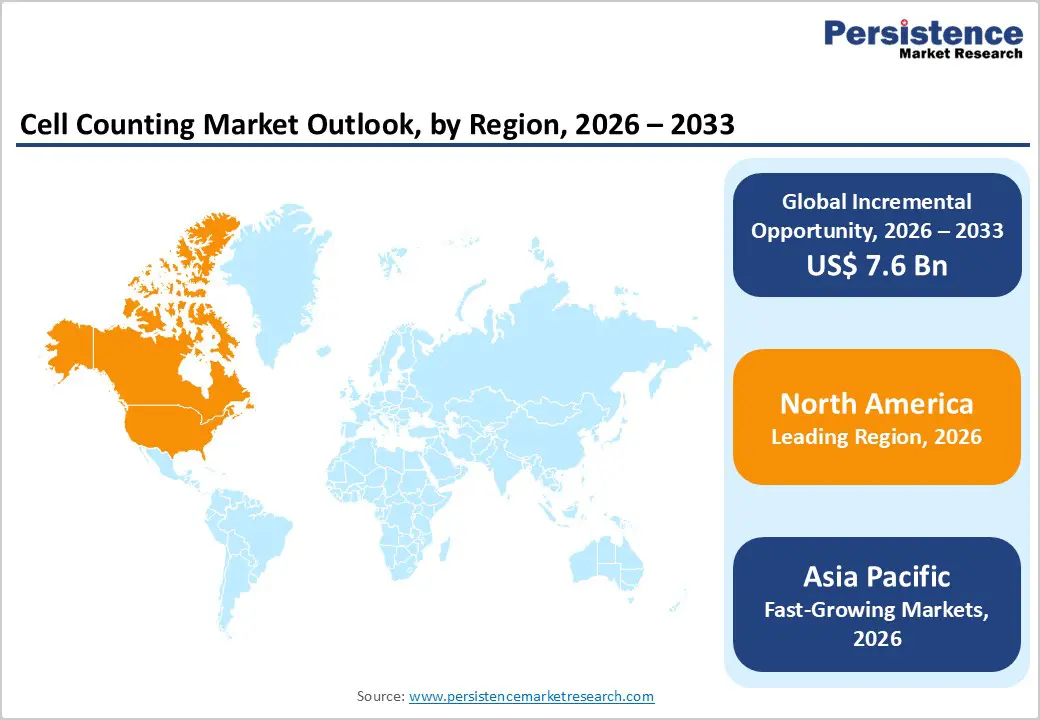
- Leading Region: North America holds the largest share at 47.3%, supported by advanced healthcare infrastructure, high diagnostic testing volumes, strong biomedical research funding, widespread adoption of automated laboratory systems, and presence of major life sciences companies.
- Fastest-Growing Region: Asia Pacific is expanding fastest due to rising healthcare expenditure, increasing diagnostic access, rapid growth of pharmaceutical and biotechnology industries, expanding academic research activity, and government support for life sciences. Leading Product Segment: Consumables & accessories dominate the market due to recurring usage, regulatory requirements, high testing frequency, and essential role across clinical, research, and bioprocessing workflows.
- Fastest-Growing Product Segment: Instruments are growing rapidly as laboratories adopt automated and image-based systems to improve accuracy, throughput, and operational efficiency. Leading Application Segment: Complete blood count remains the top segment, driven by high routine diagnostic volumes and its critical role in disease detection and monitoring.
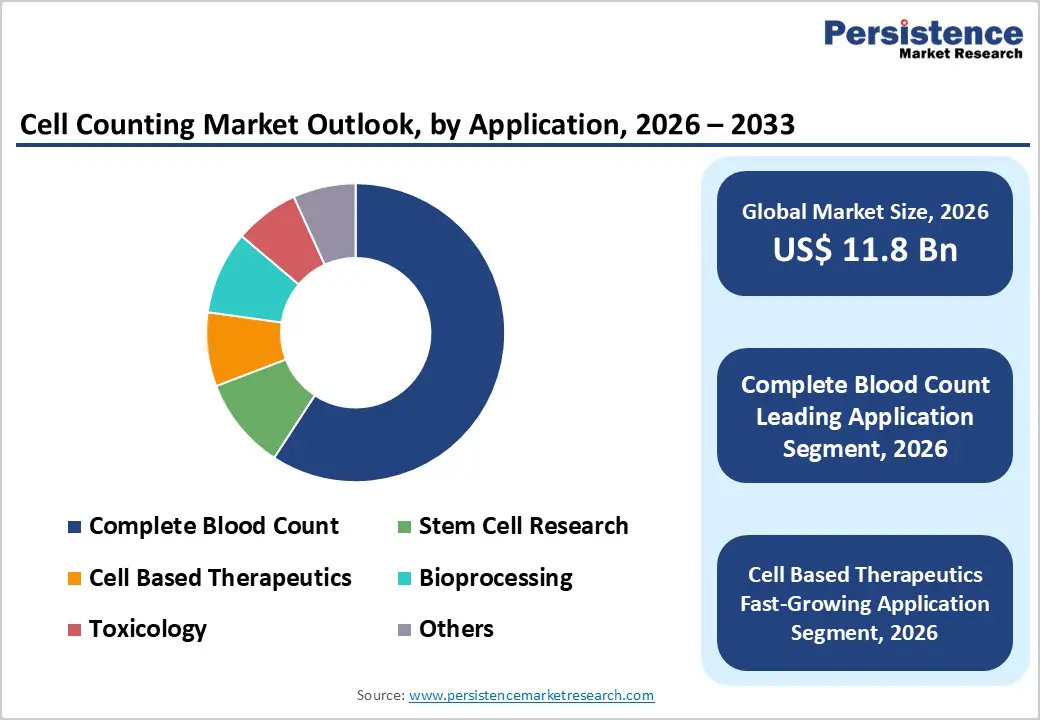
- Fastest-Growing Application Segment: Cell-based therapeutics is scaling quickly as growth in cell and gene therapy development increases demand for precise cell quantification across manufacturing and clinical stages.
| Key Insights | Details |
|---|---|
|
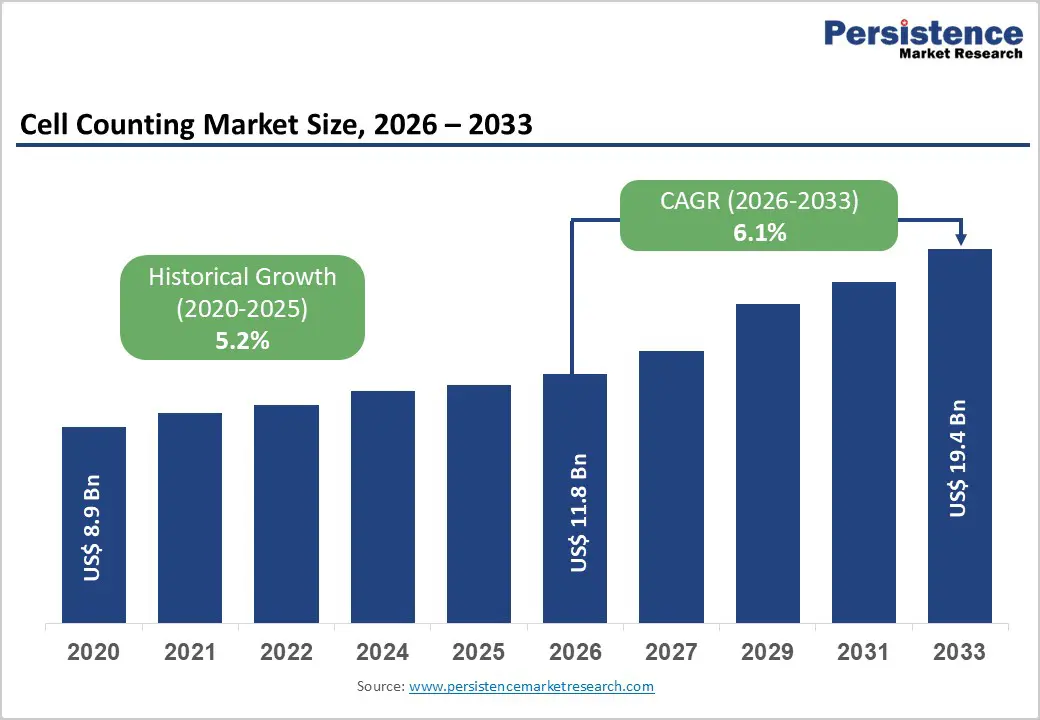
Cell Counting Market Size (2026E) |
US$ 11.8 Bn |
|
Market Value Forecast (2033F) |
US$ 19.4 Bn |
|
Projected Growth (CAGR 2026 to 2033) |
6.1% |
|
Historical Market Growth (CAGR 2020 to 2025) |
5.2% |
Market Dynamics
Driver - Rising Diagnostic Volumes, Expansion of Cell-Based Research, and Laboratory Automation
Growth is primarily driven by increasing demand for accurate and high-throughput cell analysis across clinical diagnostics, biomedical research, and biopharmaceutical manufacturing. Rising prevalence of chronic diseases such as cancer, hematological disorders, autoimmune conditions, and infectious diseases has significantly increased routine diagnostic testing volumes, particularly complete blood count and immune profiling assays. Aging populations and greater emphasis on preventive healthcare further support sustained demand for cell counting technologies.
Additionally, rapid expansion of cell-based research, including stem cell studies, regenerative medicine, and cell and gene therapy development, is accelerating adoption across research and academic institutes. Precise cell quantification is critical throughout drug discovery, toxicity testing, and bioprocess monitoring, reinforcing the role of both instruments and consumables. Technological advancements such as automated cell counters, image-based analysis, fluorescence detection, and integration with laboratory information systems have improved accuracy, reproducibility, and workflow efficiency. These innovations reduce manual errors, shorten turnaround times, and support high-throughput laboratory environments. Additionally, increasing investment in biotechnology, pharmaceutical R&D, and translational research globally continues to strengthen long-term growth momentum.
Restraints - High Equipment Costs, Technical Complexity, and Regulatory Compliance Burden
The market faces notable restraints related to the high upfront cost of advanced automated and image-based cell counting instruments. Capital-intensive systems can limit adoption among small laboratories, academic institutes with constrained budgets, and facilities in cost-sensitive regions. Beyond acquisition costs, ongoing expenses related to consumables, calibration, software upgrades, maintenance, and service contracts increase total cost of ownership.
Technical complexity and the need for skilled personnel also pose challenges. Advanced cell counting platforms require trained laboratory professionals to ensure accurate operation, data interpretation, and compliance with standardized protocols. Inadequate training or limited technical expertise can lead to inconsistent results, underutilization of system capabilities, or workflow inefficiencies. Regulatory requirements related to diagnostic validation, quality control, and data integrity further add to operational complexity, particularly for clinical and pharmaceutical applications. In emerging markets, limited laboratory infrastructure, lower awareness of advanced cell analysis tools, and affordability constraints may restrict adoption. Additionally, variability in regulatory frameworks across regions can delay product approvals and increase compliance costs for manufacturers, collectively slowing market penetration.
Opportunity - Growth in Emerging Markets, Advanced Automation, and Cell & Gene Therapy Expansion
Significant growth opportunities are emerging from expanding healthcare infrastructure and increasing research investments in emerging economies. Rapid development of diagnostic laboratories, academic research centers, and pharmaceutical manufacturing hubs across Asia Pacific, Latin America, and the Middle East is creating strong demand for reliable and scalable cell counting solutions. Rising government funding for biotechnology, genomics, and life sciences research further supports adoption.
Technological advancements focused on automation, artificial intelligence, and real-time data analytics present additional opportunities. Development of compact, user-friendly, and fully automated cell counters reduces operator dependency and improves consistency, making these systems attractive to high-throughput and decentralized laboratories. Integration with digital laboratory platforms and cloud-based data management enhances workflow optimization and compliance. Growing momentum in cell and gene therapy development is another major opportunity, as precise cell counting is essential across manufacturing, quality control, and clinical trial stages. Expansion of bioprocessing activities, contract research organizations, and biologics production further strengthens demand. Strategic collaborations between manufacturers, research institutions, and biopharma companies are expected to accelerate innovation, standardization, and long-term market expansion.
Category-wise Analysis
By Product, Consumables & Accessories Dominate Due to Recurring Usage and High Workflow Dependency
Consumables & accessories are projected to dominate the global cell counting market in 2026, accounting for a revenue share of 54.0%. Their leadership is driven by their indispensable role in routine laboratory workflows, including frequent replacement requirements for reagents, assay kits, slides, chambers, and calibration components. Unlike instruments, consumables generate continuous demand across clinical diagnostics, research laboratories, biopharmaceutical manufacturing, and academic settings. Increasing testing volumes for hematology, oncology research, immunology, and cell-based assays further accelerate adoption. The growing focus on accuracy, contamination control, and regulatory compliance has heightened reliance on high-quality certified consumables. Additionally, expanding bioprocessing and cell therapy pipelines require consistent cell monitoring across multiple production stages, reinforcing repeat purchases. Technological advancements improving assay sensitivity, shelf life, and compatibility with automated counters further support market dominance. As laboratories prioritize operational continuity and validated consumable performance, this segment is expected to retain leadership throughout the forecast period.
By Application, Complete Blood Count Leads Due to High Diagnostic Volumes and Routine Clinical Use
The complete blood count (CBC) segment is expected to dominate the global cell counting market in 2026, capturing a revenue share of 59.2%. This dominance is primarily attributed to the widespread use of CBC as a first-line diagnostic test across hospitals, diagnostic laboratories, and outpatient facilities. CBC testing is essential for detecting infections, anemia, hematological disorders, immune conditions, and monitoring chronic diseases, resulting in consistently high testing volumes worldwide. Rising prevalence of lifestyle-related diseases, aging populations, and increasing demand for preventive health screening further drive test frequency. Automation in hematology laboratories has significantly improved throughput, accuracy, and turnaround time, strengthening reliance on cell counting technologies. Additionally, expanding access to diagnostics in emerging markets and growing adoption of point-of-care hematology analyzers support sustained demand. Given its non-replaceable role in clinical diagnostics, CBC is expected to remain the leading application segment over the forecast period.
By End User, Research & Academic Institutes Lead Due to Intensive Cell-Based Research Activity
Research & academic institutes are projected to dominate the global cell counting market in 2026, accounting for a revenue share of 39.8%. This leadership is driven by extensive cell-based experimentation across life sciences research, including oncology, immunology, stem cell biology, and molecular diagnostics. Academic laboratories routinely conduct cell viability, proliferation, and concentration analyses, resulting in high usage of both instruments and consumables. Increasing government and private funding for biomedical research, translational medicine, and regenerative therapies further supports demand. These institutes often serve as early adopters of advanced automated and image-based cell counting systems to enhance reproducibility and data accuracy. Collaborative research programs with pharmaceutical and biotechnology companies also contribute to sustained equipment utilization. While hospitals and diagnostic labs generate steady demand, research and academic institutes remain the primary revenue contributors due to continuous experimentation cycles, long-term projects, and high dependency on precise cell quantification tools.
Region-wise Insights
North America Cell Counting Market Trends
North America is expected to dominate the global cell counting market with a value share of 47.3% in 2026, led primarily by the United States. The region benefits from a highly developed healthcare and life sciences ecosystem, strong research infrastructure, and early adoption of advanced laboratory technologies. High prevalence of chronic diseases, cancer, and immune disorders drives routine diagnostic testing, particularly complete blood count procedures. Additionally, North America hosts a significant concentration of leading pharmaceutical, biotechnology, and contract research organizations, supporting sustained demand for cell counting solutions in drug discovery and bioprocessing.
Strong government funding for biomedical research, along with NIH-supported academic programs, further accelerates market growth. Regulatory emphasis on data accuracy, standardization, and quality assurance promotes adoption of automated and validated cell counting systems. Continuous technological innovation, frequent laboratory upgrades, and increasing focus on personalized medicine are expected to reinforce North America’s leadership throughout the forecast period.
Europe Cell Counting Market Trends
The Europe cell counting market is expected to grow steadily, supported by strong regulatory oversight, high laboratory standards, and expanding biomedical research activity across countries such as Germany, the U.K., France, Italy, and Spain. The region benefits from a well-established diagnostic infrastructure and growing emphasis on early disease detection and preventive healthcare. Increasing incidence of hematological disorders, cancer, and autoimmune diseases is driving routine cell analysis across clinical and research settings.
European laboratories place strong emphasis on accuracy, reproducibility, and compliance with stringent medical device and laboratory regulations, supporting demand for high-quality cell counting instruments and consumables. Growth in biopharmaceutical manufacturing, particularly biosimilars and cell-based therapies, is further strengthening market penetration. Expansion of academic research programs and cross-border collaborations continues to support adoption. As innovation in life sciences remains a regional priority, Europe is expected to maintain consistent long-term growth.
Asia Pacific Cell Counting Market Trends
The Asia Pacific cell counting market is expected to register a relatively higher CAGR of around 8.3% between 2026 and 2033, driven by rapid healthcare expansion, rising research investments, and improving diagnostic access. Countries such as China, India, Japan, South Korea, and Australia are witnessing increasing demand for cell counting technologies due to growing disease burden, expanding pharmaceutical manufacturing, and rising clinical testing volumes.
Government initiatives supporting biotechnology, genomics, and translational research are significantly boosting laboratory infrastructure development. Increasing adoption of automated hematology analyzers in hospitals and diagnostic labs is improving testing efficiency and accuracy. Cost-effective instruments, availability of local manufacturers, and rising outsourcing of research and bioprocessing activities further enhance market accessibility. Growing medical research output, expanding academic collaborations, and increasing healthcare expenditure position Asia Pacific as the fastest-growing regional market over the forecast period.
Market Competitive Landscape
The global cell counting market is highly competitive, with strong participation from companies such as Thermo Fisher Scientific, Inc., Merck KGaA, Agilent Technologies, PerkinElmer, Inc., and BD. These players leverage extensive global distribution networks, strong brand recognition, and diversified life sciences–focused product portfolios to address the growing demand for accurate, reliable, and high-throughput cell analysis solutions.
Their offerings emphasize advanced automation, imaging- and impedance-based technologies, analytical precision, workflow efficiency, and compatibility across multiple applications including clinical diagnostics, stem cell research, bioprocessing, and cell-based therapeutics. Continuous technological innovation, regulatory compliance, clinical and analytical accuracy, product reliability, and adherence to international quality and manufacturing standards remain critical for sustaining competitive positioning in the global cell counting market.
Key Industry Developments:
- In January 2025, Illumina, Inc. announced the launch of the world’s largest genome-wide genetic perturbation dataset aimed at accelerating AI-driven drug discovery across the pharmaceutical ecosystem. The initiative, called the Illumina Billion Cell Atlas, represents the first phase of a broader program to construct a 5 billion–cell atlas over three years. Once completed, it is expected to become the most comprehensive map of human disease biology to date, enabling deeper insights into gene function, disease mechanisms, and therapeutic target identification.
- In August 2024, DeNovix announced the release of the CellDrop FLi Automated Cell Counter, the latest update to its CellDrop product line. The launch features enhanced hardware designed to improve cell counting accuracy and performance, along with six new cell counting applications, including support for fixed samples, hepatocytes, and Erythrosin B–based viability assays.
Companies Covered in Cell Counting Market
- Thermo Fisher Scientific, Inc.
- Merck KGaA
- Agilent Technologies
- PerkinElmer, Inc.
- BD
- Danaher
- Bio-Rad Laboratories, Inc.
- BioTek Instruments, Inc.
- GE Healthcare
- DeNovix Inc.
- Abbott Laboratories
- Beckman Coulter, Inc.
- Sysmex Corporation
- Olympus Corporation
- Others
Frequently Asked Questions
The global cell counting market is projected to be valued at US$ 11.8 Bn in 2026.
Rising burden of chronic diseases, expanding biopharmaceutical and cell-based research, and increasing adoption of automated diagnostic technologies are driving global cell counting demand.
The global cell counting market is poised to witness a CAGR of 6.1% between 2026 and 2033.
Rapid growth of cell and gene therapies, stem cell research, and AI-enabled automated cell counting solutions presents significant expansion opportunities globally.
Thermo Fisher Scientific, Inc., Merck KGaA, Agilent Technologies, PerkinElmer, Inc., and BD are some of the key players in the cell counting market.


