

- Executive Summary
- Global Care Management Solutions Market Snapshot 2026 and 2033
- Market Opportunity Assessment, 2026-2033, US$ Bn
- Key Market Trends
- Industry Developments and Key Market Events
- Demand Side and Supply Side Analysis
- PMR Analysis and Recommendations
- Market Overview
- Market Scope and Definitions
- Value Chain Analysis
- Macro-Economic Factors
- Global GDP Outlook
- Healthcare Budget Allocation
- Healthcare Insurance Penetration
- Digital Infrastructure Penetration
- Telehealth & Connectivity Adoption
- Healthcare Service Utilization Trends
- Forecast Factors – Relevance and Impact
- COVID-19 Impact Assessment
- PESTLE Analysis
- Porter's Five Forces Analysis
- Geopolitical Tensions: Market Impact
- Regulatory and Technology Landscape
- Market Dynamics
- Drivers
- Restraints
- Opportunities
- Trends
- Price Trend Analysis
- Price by Solution
- Price Impact Factors
- Global Care Management Solutions Market Outlook: Historical (2020 – 2025) and Forecast (2026 – 2033)
- Key Highlights
- Global Care Management Solutions Market Outlook: Solution
- Introduction/Key Findings
- Historical Market Size (US$ Bn) Analysis by Solution, 2020-2025
- Current Market Size (US$ Bn) Forecast, by Solution, 2026-2033
- Software
- Integrated Suite
- Standalone Software
- Disease Management
- Utilization Management
- Case Management
- Patient Engagement & Monitoring
- Others
- Services
- Professional Services
- Care Management Assessment Services
- Consulting
- Integration & Implementation
- Support & Maintenance
- Managed Services
- Professional Services
- Software
- Market Attractiveness Analysis: Solution
- Global Care Management Solutions Market Outlook: Deployment
- Introduction/Key Findings
- Historical Market Size (US$ Bn) Analysis by Deployment, 2020-2025
- Current Market Size (US$ Bn) Forecast, by Deployment, 2026-2033
- Cloud-based
- On-premises
- Hybrid
- Market Attractiveness Analysis: Deployment
- Global Care Management Solutions Market Outlook: End User
- Introduction/Key Findings
- Historical Market Size (US$ Bn) Analysis by End User, 2020-2025
- Current Market Size (US$ Bn) Forecast, by End User, 2026-2033
- Hospitals & Clinics
- Accountable Care Organizations (ACOs)
- Health Insurance Providers
- Home Healthcare Providers
- Others
- Market Attractiveness Analysis: End User
- Global Care Management Solutions Market Outlook: Region
- Key Highlights
- Historical Market Size (US$ Bn) Analysis by Region, 2020-2025
- Current Market Size (US$ Bn) Forecast, by Region, 2026-2033
- North America
- Europe
- East Asia
- South Asia & Oceania
- Latin America
- Middle East & Africa
- Market Attractiveness Analysis: Region
- North America Care Management Solutions Market Outlook: Historical (2020 – 2025) and Forecast (2026 – 2033)
- Key Highlights
- North America Market Size (US$ Bn) Forecast, by Country, 2026-2033
- U.S.
- Canada
- North America Market Size (US$ Bn) Forecast, by Solution, 2026-2033
- Software
- Integrated Suite
- Standalone Software
- Disease Management
- Utilization Management
- Case Management
- Patient Engagement & Monitoring
- Others
- Services
- Professional Services
- Care Management Assessment Services
- Consulting
- Integration & Implementation
- Support & Maintenance
- Managed Services
- Professional Services
- Software
- North America Market Size (US$ Bn) Forecast, by Deployment, 2026-2033
- Cloud-based
- On-premises
- Hybrid
- North America Market Size (US$ Bn) Forecast, by End User, 2026-2033
- Hospitals & Clinics
- Accountable Care Organizations (ACOs)
- Health Insurance Providers
- Home Healthcare Providers
- Others
- Europe Care Management Solutions Market Outlook: Historical (2020 – 2025) and Forecast (2026 – 2033)
- Key Highlights
- Europe Market Size (US$ Bn) Forecast, by Country, 2026-2033
- Germany
- Italy
- France
- U.K.
- Spain
- Russia
- Rest of Europe
- Europe Market Size (US$ Bn) Forecast, by Solution, 2026-2033
- Software
- Integrated Suite
- Standalone Software
- Disease Management
- Utilization Management
- Case Management
- Patient Engagement & Monitoring
- Others
- Services
- Professional Services
- Care Management Assessment Services
- Consulting
- Integration & Implementation
- Support & Maintenance
- Managed Services
- Professional Services
- Software
- Europe Market Size (US$ Bn) Forecast, by Deployment, 2026-2033
- Cloud-based
- On-premises
- Hybrid
- Europe Market Size (US$ Bn) Forecast, by End User, 2026-2033
- Hospitals & Clinics
- Accountable Care Organizations (ACOs)
- Health Insurance Providers
- Home Healthcare Providers
- Others
- East Asia Care Management Solutions Market Outlook: Historical (2020 – 2025) and Forecast (2026 – 2033)
- Key Highlights
- East Asia Market Size (US$ Bn) Forecast, by Country, 2026-2033
- China
- Japan
- South Korea
- East Asia Market Size (US$ Bn) Forecast, by Solution, 2026-2033
- Software
- Integrated Suite
- Standalone Software
- Disease Management
- Utilization Management
- Case Management
- Patient Engagement & Monitoring
- Others
- Services
- Professional Services
- Care Management Assessment Services
- Consulting
- Integration & Implementation
- Support & Maintenance
- Managed Services
- Professional Services
- Software
- East Asia Market Size (US$ Bn) Forecast, by Deployment, 2026-2033
- Cloud-based
- On-premises
- Hybrid
- East Asia Market Size (US$ Bn) Forecast, by End User, 2026-2033
- Hospitals & Clinics
- Accountable Care Organizations (ACOs)
- Health Insurance Providers
- Home Healthcare Providers
- Others
- South Asia & Oceania Care Management Solutions Market Outlook: Historical (2020 – 2025) and Forecast (2026 – 2033)
- Key Highlights
- South Asia & Oceania Market Size (US$ Bn) Forecast, by Country, 2026-2033
- India
- Southeast Asia
- ANZ
- Rest of SAO
- South Asia & Oceania Market Size (US$ Bn) Forecast, by Solution, 2026-2033
- Software
- Integrated Suite
- Standalone Software
- Disease Management
- Utilization Management
- Case Management
- Patient Engagement & Monitoring
- Others
- Services
- Professional Services
- Care Management Assessment Services
- Consulting
- Integration & Implementation
- Support & Maintenance
- Managed Services
- Professional Services
- Software
- South Asia & Oceania Market Size (US$ Bn) Forecast, by Deployment, 2026-2033
- Cloud-based
- On-premises
- Hybrid
- South Asia & Oceania Market Size (US$ Bn) Forecast, by End User, 2026-2033
- Hospitals & Clinics
- Accountable Care Organizations (ACOs)
- Health Insurance Providers
- Home Healthcare Providers
- Others
- Latin America Care Management Solutions Market Outlook: Historical (2020 – 2025) and Forecast (2026 – 2033)
- Key Highlights
- Latin America Market Size (US$ Bn) Forecast, by Country, 2026-2033
- Brazil
- Mexico
- Rest of LATAM
- Latin America Market Size (US$ Bn) Forecast, by Solution, 2026-2033
- Software
- Integrated Suite
- Standalone Software
- Disease Management
- Utilization Management
- Case Management
- Patient Engagement & Monitoring
- Others
- Services
- Professional Services
- Care Management Assessment Services
- Consulting
- Integration & Implementation
- Support & Maintenance
- Managed Services
- Professional Services
- Software
- Latin America Market Size (US$ Bn) Forecast, by Deployment, 2026-2033
- Cloud-based
- On-premises
- Hybrid
- Latin America Market Size (US$ Bn) Forecast, by End User, 2026-2033
- Hospitals & Clinics
- Accountable Care Organizations (ACOs)
- Health Insurance Providers
- Home Healthcare Providers
- Others
- Middle East & Africa Care Management Solutions Market Outlook: Historical (2020 – 2025) and Forecast (2026 – 2033)
- Key Highlights
- Middle East & Africa Market Size (US$ Bn) Forecast, by Country, 2026-2033
- GCC Countries
- South Africa
- Northern Africa
- Rest of MEA
- Middle East & Africa Market Size (US$ Bn) Forecast, by Solution, 2026-2033
- Software
- Integrated Suite
- Standalone Software
- Disease Management
- Utilization Management
- Case Management
- Patient Engagement & Monitoring
- Others
- Services
- Professional Services
- Care Management Assessment Services
- Consulting
- Integration & Implementation
- Support & Maintenance
- Managed Services
- Professional Services
- Software
- Middle East & Africa Market Size (US$ Bn) Forecast, by Deployment, 2026-2033
- Cloud-based
- On-premises
- Hybrid
- Middle East & Africa Market Size (US$ Bn) Forecast, by End User, 2026-2033
- Hospitals & Clinics
- Accountable Care Organizations (ACOs)
- Health Insurance Providers
- Home Healthcare Providers
- Others
- Competition Landscape
- Market Share Analysis, 2025
- Market Structure
- Competition Intensity Mapping
- Competition Dashboard
- Company Profiles
- Epic Systems Corporation
- Company Overview
- Product Portfolio/Offerings
- Key Financials
- SWOT Analysis
- Company Strategy and Key Developments
- Cerner Corporation
- Allscripts Healthcare Solutions, Inc.
- Cognizant Technology Solutions
- ZeOmega, Inc.
- Medecision, Inc.
- EXL Service Holdings, Inc.
- IBM Corporation
- Koninklijke Philips N.V.
- Health Catalyst, Inc.
- Salesforce, Inc.
- Optum, Inc.
- Others
- Epic Systems Corporation
- Appendix
- Research Methodology
- Research Assumptions
- Acronyms and Abbreviations


- Hardware & Software IT Services
- Care Management Solutions Market
Care Management Solutions Market Size, Share, and Growth Forecast, 2026 – 2033
Care Management Solutions Market by Solution (Software, Services), Deployment (Cloud-based, On-premises, Hybrid), End User (Hospitals & Clinics, Accountable Care Organizations, Health Insurance Providers, Home Healthcare Providers, Others), and Regional Analysis for 2026 – 2033
Care Management Solutions Market Size and Trends
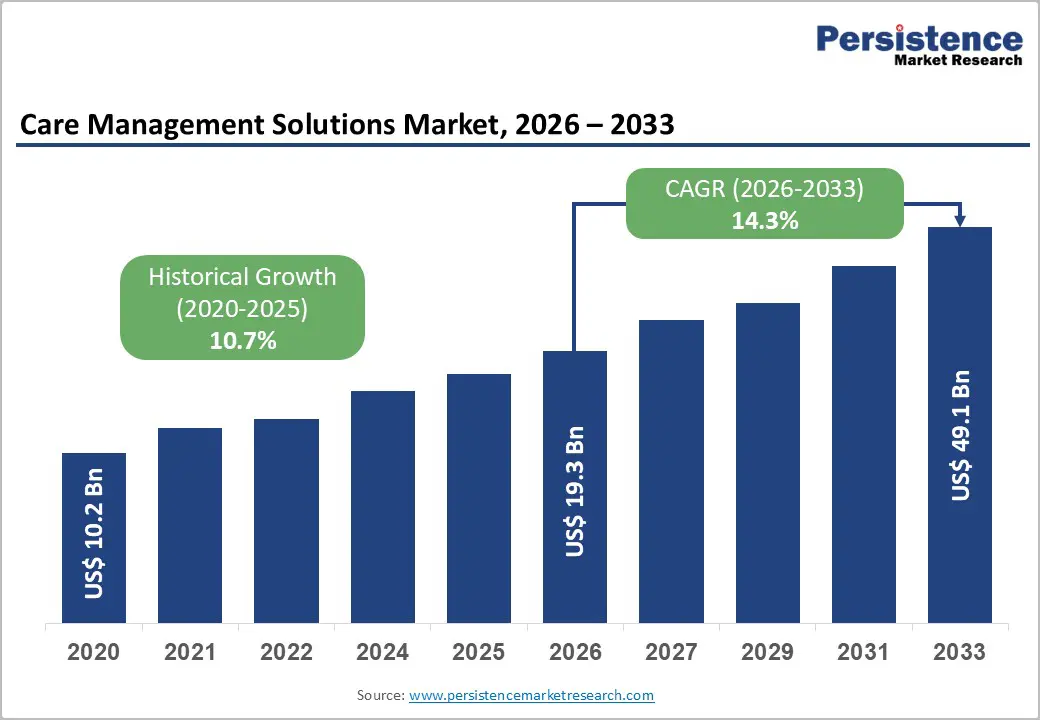
The global Care Management Solutions Market size is projected to rise from US$19.3 Bn in 2026 to US$49.1 Bn by 2033. It is anticipated to witness a CAGR of 14.3% during the forecast period from 2026 to 2033, driven by the escalating prevalence of chronic diseases requiring continuous patient monitoring and coordinated care delivery, coupled with healthcare organizations' strategic shift toward value-based care models that incentivize quality outcomes rather than service volume. Healthcare systems are increasingly adopting care management solutions to reduce preventable hospital readmissions, improve patient engagement through remote monitoring technologies, and optimize operational efficiency through data-driven clinical decision-making.
Key Industry Highlights:
- Leading Solution: Software dominates with over 65% market share in 2026, valued at more than US$ 12.5Bn, driven by the need for centralized patient data management, chronic disease monitoring, care coordination, and value-based care optimization. Services are the fastest-growing segment, supported by implementation, integration, training, and ongoing system support needs.
- Leading Deployment: On-premises solutions hold over 35% market share in 2026, valued at over US$ 6.7Bn, preferred for data privacy, regulatory compliance, and integration with legacy IT systems. Cloud-based deployment is growing fastest due to scalability, rapid deployment, interoperability, and support for remote care and telehealth.
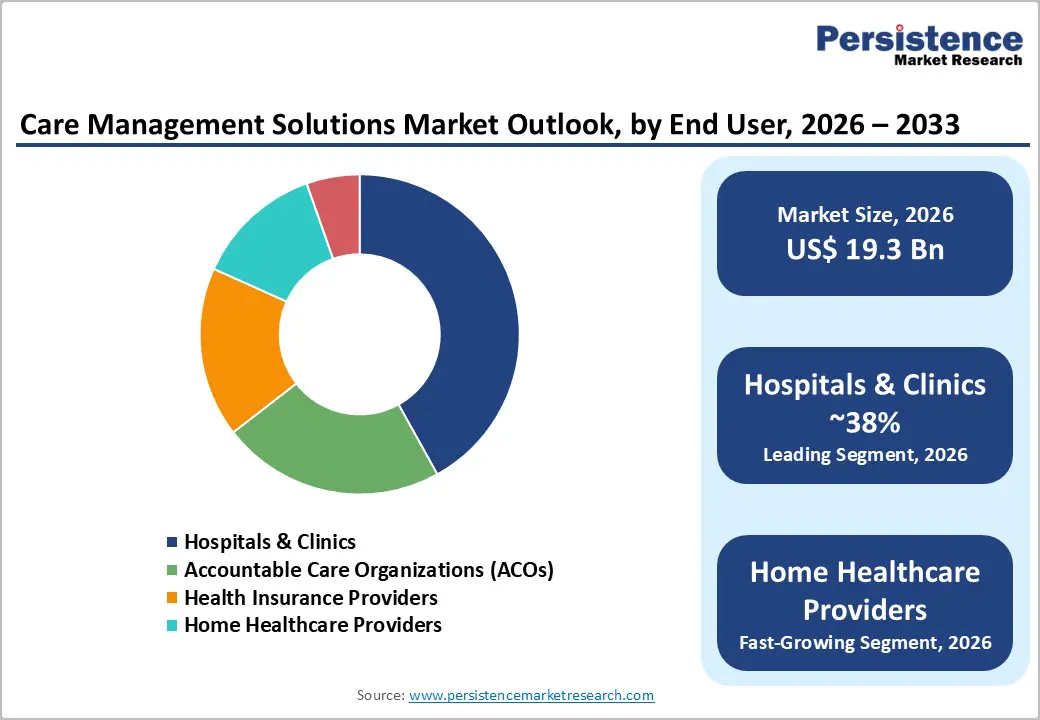
- Leading End User: Hospitals & clinics command the largest share at over 38% in 2026, valued at more than US$ 7.3Bn, driven by complex patient populations, chronic disease management, and value-based care requirements. Home healthcare providers are the fastest-growing end users, fueled by aging populations, chronic disease prevalence, remote monitoring needs, and cost-effective patient-centric care delivery.
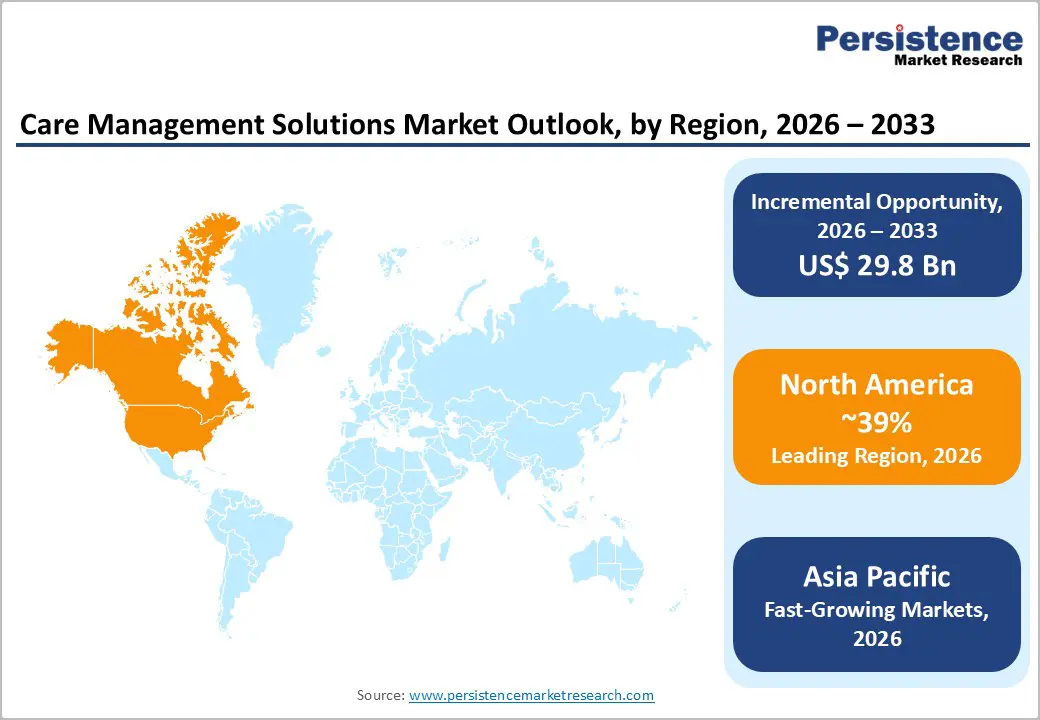
- Leading Region: North America leads with over 39% market share in 2026, valued at approximately US$ 7.5Bn, supported by advanced healthcare infrastructure, high IT spending, Medicare/Medicaid value-based models, and mature digital health ecosystems. Asia Pacific is the fastest-growing region at a 19.6% CAGR, driven by digital health investments, 5G rollout, telehealth expansion, and increasing chronic disease burden. Europe holds more than 20% share, supported by aging demographics, EHDS-enabled interoperability, and national eHealth initiatives.
| Key Insights | Details |
|---|---|
|
Care Management Solutions Market Size (2026E) |
US$19.3 Bn |
|
Market Value Forecast (2033F) |
US$49.1 Bn |
|
Projected Growth (CAGR 2026 to 2033) |
14.3% |
|
Historical Market Growth (CAGR 2020 to 2025) |
10.7% |
Market Dynamics
Driver
Growing Chronic Disease Prevalence Demanding Continuous Care Coordination
The rising global prevalence of chronic diseases, particularly among aging populations, is driving demand for advanced care management solutions that support remote monitoring, coordinated care, and condition-specific interventions. Chronic conditions such as diabetes, heart failure, COPD, and hypertension require continuous management across multiple providers. Studies show that AI-enabled remote patient monitoring and predictive analytics reduce hospital readmissions by 25–50% and decrease emergency visits for high-risk patients.
CMS reimbursement for Chronic Care Management (CCM) and Remote Patient Monitoring (RPM) services further incentivize adoption, with healthcare systems reporting improved patient satisfaction, medication adherence, and overall care quality. These clinical and economic benefits are encouraging healthcare organizations to invest in integrated platforms that consolidate patient data, automate workflows, and enable seamless communication across care teams.
Accelerating Shift to Value-Based Care Models
The shift from fee-for-service to value-based care is a key driver for care management solutions. As of January 2025, 53.4% of Traditional Medicare beneficiaries participate in accountable care relationships, the largest annual increase of 4.3 percentage points, including 103 new ACOs joining the REACH Model. Value-based models incentivize providers to improve outcomes and reduce costs via coordinated care, population health management, and preventive interventions capabilities enabled by care management solutions. These tools help identify high-risk patients, assign case managers, and implement post-discharge continuity plans, lowering unnecessary utilization and enhancing reimbursement performance.
Restraint
Persistent Interoperability Challenges and Legacy System Integration Barriers
Fragmented healthcare IT landscapes and legacy system dependencies continue to impede care management solution adoption. Despite standards like HL7 FHIR and TEFCA, many EHRs operate in proprietary, non-communicative formats, causing asymmetric data flows ONC reports 48% of hospitals share patient data without receiving it back. Integrating legacy systems is costly and time-intensive, requiring specialized expertise, change management, and capital investment. These interoperability barriers delay implementation, increase total cost of ownership, necessitate complex middleware, and limit clinical value by restricting access to comprehensive patient information, thereby constraining market growth despite strong provider demand.
Data Privacy, Security, and Regulatory Compliance Complexity
Care management solutions rely on comprehensive patient data, including clinical, behavioral, pharmacy, and claims information, to enable population health stratification, predictive modeling, and personalized care. Compliance with stringent regulations like HIPAA, emerging privacy standards, and patient consent frameworks complicates solution design and deployment. Healthcare organizations must implement robust security measures, including encryption, role-based access, and audit trails, to safeguard sensitive information against rising cyber threats. These regulatory complexities increase implementation timelines, costs, and operational burdens, particularly for smaller providers with limited IT capacity. Balancing clinical benefits of data sharing with strict privacy requirements often leads to restrictive data governance, potentially limiting solution effectiveness and adoption speed.
Opportunity
Artificial Intelligence and Predictive Analytics Integration Transforming Clinical Decision-Making
Healthcare organizations are increasingly adopting AI, machine learning, and predictive analytics within care management solutions to streamline administrative tasks, enhance clinical decision-making, and enable personalized patient care. Innovaccer Inc.’s Copilots and Agents for Care Management, launched in April 2025 showed a 28% reduction in care manager documentation time and a 20% increase in patient engagement, demonstrating AI-driven efficiency. These systems automate chart reviews, documentation, care planning, and patient outreach, allowing clinicians to focus on direct care. Predictive algorithms identify high-risk patients, enabling proactive interventions through remote monitoring, readmission prevention, and discharge coordination. Growing data availability, advanced computational capabilities, regulatory support, and demonstrated clinical benefits are driving strong adoption opportunities for healthcare providers and AI vendors.
Expansion of Remote Patient Monitoring and Telehealth Integration Capabilities
The rapid adoption of remote patient monitoring, wearable devices, and telehealth is expanding the clinical scope of care management solutions. Improved connectivity and broadband infrastructure enable real-time transmission of patient data from home-based devices to clinical teams. These solutions are increasingly integrated with IoT-enabled medical devices, smartphone health apps, and remote monitoring platforms, creating comprehensive patient engagement ecosystems. Healthcare providers use these tools to monitor chronic conditions, detect early deterioration, optimize medication adherence, and coordinate care across settings. Growing telehealth adoption in Asia Pacific and government digital health initiatives are driving opportunities for vendors to expand geographically and address local clinical, infrastructure, and regulatory needs.
Category-wise Analysis
Solution Analysis,
Software dominates the global market, capturing more than 65% market share in 2026 with a value exceeding US$ 12.5 Bn, due to the growing need for centralized patient data management across providers, payers, and care teams. Healthcare organizations increasingly require real-time analytics and clinical decision-support tools to manage chronic diseases, reduce hospital readmissions, and improve patient outcomes. The shift toward value-based care models has intensified demand for software platforms that enable care coordination, risk stratification, and performance tracking. It supports scalability, interoperability, and cost efficiency, reinforcing software’s dominance in the market.
Services demonstrate significant growth due to the rising need for end-to-end implementation, customization, and integration with existing healthcare IT systems. Healthcare providers require ongoing training, technical support, and workflow optimization to effectively use care management platforms. The increasing complexity of value-based care and regulatory compliance drives demand for consulting and managed services. Data analytics, remote monitoring support, and continuous system upgrades make service offerings critical for achieving improved patient outcomes and cost efficiency.
Deployment Analysis,
On-premises hold over 35% of the market share in 2026, with a value exceeding US$ 6.7 Bn, as healthcare providers require maximum control over sensitive patient data to meet strict data privacy and regulatory compliance needs. Large hospitals and integrated care networks prefer on-premises systems for customization and integration with legacy EHR and hospital IT infrastructure. It also ensures high system reliability and low latency, critical for real-time clinical decision-making. Organizations with existing IT investments find on-premises solutions more cost-effective in the long term and less dependent on external networks or cloud service availability.
Cloud-based is expected to grow at the highest rate as providers need scalable, cost-efficient platforms that can be deployed quickly without heavy IT infrastructure. They support real-time data access and remote care coordination, which is critical for managing chronic diseases and value-based care models. The growing need for interoperability with EHRs, telehealth, and analytics tools also favors cloud adoption. Cloud solutions meet the demand for secure data sharing, regulatory compliance, and continuous updates in a rapidly evolving healthcare environment.
End User Analysis,
Hospitals & clinics command the largest market share at over 38% in 2026 with a value exceeding US$ 7.3 Bn, due to their growing need to manage complex patient populations with chronic and multi-morbid conditions. Rising patient volumes, pressure to reduce readmissions, and the shift toward value-based care models require integrated solutions for care coordination, patient monitoring, and outcome tracking. These providers also need real-time clinical insights and interoperability with EHR systems to improve clinical decision-making. Regulatory compliance and the demand for cost optimization drive hospitals and clinics to invest heavily in comprehensive care management platforms.
Home healthcare providers are expected to grow at a significant rate due to the rising need for cost-effective, patient-centric care delivery outside hospitals. The growing elderly population and chronic disease burden are increasing the demand for continuous monitoring, medication adherence, and coordinated care at home. Care management solutions help home healthcare providers integrate remote patient monitoring, care coordination, and real-time data sharing with physicians and payers. The need to reduce hospital readmissions and improve outcomes under value-based care models is accelerating adoption among home-based care providers.
Regional Insights
North America Care Management Solutions Market Trends
North America accounts for over 39% of the care management solutions market share in 2026, reaching approximately US$7.5 Bn, driven by advanced healthcare infrastructure, high healthcare IT spending, and strong regulatory support for value-based care. The U.S. dominates the region, supported by Medicare and Medicaid–led value-based payment models, widespread EHR adoption, and a mature digital health ecosystem. Providers are increasingly deploying care management platforms to enhance chronic disease management, care coordination, and reimbursement optimization. Canada shows steady growth due to healthcare modernization initiatives and rising chronic disease prevalence. The region’s regulatory maturity enables early adoption of AI-driven analytics, predictive care tools, and integrated telehealth, setting benchmarks for global markets.
Asia Pacific Care Management Solutions Market Trends
Asia Pacific is expected to grow at the highest rate with a CAGR of 19.6%, driven by healthcare system modernization, rising chronic disease burden, and strong government investments in digital health infrastructure. China, India, and Japan are leading adoption through national initiatives supporting EHR implementation, telemedicine expansion, and care coordination platforms. India’s digital health stack, telehealth regulations, and chronic disease programs are accelerating uptake across public and private providers. Rapid 5G rollout enables real-time remote patient monitoring and telehealth in geographically dispersed regions, while persistent provider shortages increase reliance on care management solutions to improve care coordination and reduce clinician workload. Strong manufacturing ecosystems in China and India support the development of cost-effective, locally tailored care management solutions.
Europe Care Management Solutions Market Trends
Europe is expected to hold more than 20% share by 2026, driven by accelerated digital health transformation, aging demographics, and persistent healthcare workforce shortages. The European Health Data Space (EHDS) is strengthening interoperability and patient data governance, reducing deployment complexity and enabling cross-border scalability of care management platforms. Germany and the UK are leading adoption through national eHealth strategies, with Germany expanding EHR penetration and the NHS advancing large-scale digital care coordination initiatives. The Netherlands, where over 95% of clinicians use EHRs, exemplifies mature digital health adoption supporting telehealth-enabled care management. Growing primary care shortages across Europe are further increasing demand for solutions that enable task shifting to nurses and care coordinators under physician oversight.
Competitive Landscape
The care management solutions market exhibits moderate consolidation characteristics, with large vendor dominance in the acute care hospital segment contrasting with fragmented competition in the payer and home healthcare provider segments. Healthcare organizations are implementing vendor consolidation strategies, selecting integrated EHR platforms with embedded care management capabilities rather than deploying standalone solutions. Strategic vendor expansion includes acquisitions, consolidating complementary capabilities, research and development investments in AI integration, and partnership development enabling interoperability across vendor ecosystems, addressing healthcare provider demands for comprehensive, integrated platforms.
Key Industry Developments
- In April 2025, Innovaccer Inc. launched Copilots and Agents for Care Management, introducing healthcare-native artificial intelligence capabilities to automate administrative documentation, patient outreach, and discharge follow-up care coordination, with early deployment results demonstrating a 28% reduction in documentation time and 20% increase in patient engagement, representing a significant advancement in AI-enabled care management automation.
- In April 2025, HealthEdge unveiled its HealthEdge Provider Data Management platform, launching an AI-driven solution enabling health payers to automate and standardize provider data management across complex healthcare networks, with initial deployment at PEHP Health & Benefits demonstrating immediate improvements in data accuracy and regulatory compliance across 65,000 practitioners and 16,000 organizations.
Companies Covered in Care Management Solutions Market
- Epic Systems Corporation
- Cerner Corporation
- Allscripts Healthcare Solutions, Inc.
- Cognizant Technology Solutions
- ZeOmega, Inc.
- Medecision, Inc.
- EXL Service Holdings, Inc.
- IBM Corporation
- Koninklijke Philips N.V.
- Health Catalyst, Inc.
- Salesforce, Inc.
- Optum, Inc.
- Others
Frequently Asked Questions
The global market is projected to be valued at US$19.3 Bn in 2026.
The healthcare industry’s transition to value-based payment models, the rising prevalence of chronic diseases requiring continuous care coordination and remote monitoring, and the increasing focus on operational efficiency and quality metric optimization are key drivers of the market.
The market is expected to witness a CAGR of 14.3% from 2026 to 2033.
Artificial intelligence and machine learning integration into care management platforms represents a primary growth opportunity, as vendors implementing advanced clinical decision support capabilities are creating strong market expansion potential.
Epic Systems Corporation, Cerner Corporation, Allscripts Healthcare Solutions, Inc., Cognizant Technology Solutions, ZeOmega, Inc. are among the leading key players.


