

- Executive Summary
- Global Bone Void Fillers Market Snapshot 2026 and 2033
- Market Opportunity Assessment, 2026-2033, US$ Bn
- Key Market Trends
- Industry Developments and Key Market Events
- Demand Side and Supply-Side Analysis
- PMR Analysis and Recommendations
- Market Overview
- Market Scope and Definitions
- Market Dynamics
- Driver
- Restraint
- Opportunities
- Trends
- Macro-Economic Factors
- Global GDP Outlook
- Global Prison Growth Outlook
- Global Crime Rates by Country
- Global Prison Population by Country
- Global Private Prison Market Growth Outlook
- Forecast Factors – Relevance and Impact
- COVID-19 Impact Assessment
- Value Added Insights
- Value Chain analysis
- Key Market Players
- Product Adoption Analysis
- Key Promotional Strategies by key players
- PESTLE Analysis
- Porter's Five Forces Analysis
- Regulatory and Technology Landscape
- Global Bone Void Fillers Market Outlook: Historical (2020 – 2025) and Forecast (2026 – 2033)
- Key Highlights
- Global Bone Void Fillers Market Outlook: Material Type
- Introduction/Key Findings
- Historical Market Size (US$ Bn) Analysis by Material Type, 2020-2025
- Current Market Size (US$ Bn) Forecast, by Material Type, 2026-2033
- Demineralized Bone
- Calcium Sulphate
- Calcium Phosphate
- Tri Calcium Phosphate
- Others
- Market Attractiveness Analysis: Material Type
- Global Bone Void Fillers Market Outlook: End User
- Introduction/Key Findings
- Historical Market Size (US$ Bn) Analysis by End User, 2020-2025
- Current Market Size (US$ Bn) Forecast, by End User, 2026-2033
- Hospitals
- Ambulatory Surgical Centers
- Specialized Clinics
- Market Attractiveness Analysis: End User
- Global Bone Void Fillers Market Outlook: Region
- Key Highlights
- Historical Market Size (US$ Bn) Analysis by Region, 2020-2025
- Current Market Size (US$ Bn) Forecast, by Region, 2026-2033
- North America
- Europe
- East Asia
- South Asia & Oceania
- Latin America
- Middle East & Africa
- Market Attractiveness Analysis: Region
- North America Bone Void Fillers Market Outlook: Historical (2020 – 2025) and Forecast (2026 – 2033)
- Key Highlights
- North America Market Size (US$ Bn) Forecast, by Country, 2026-2033
- U.S.
- Canada
- North America Market Size (US$ Bn) Forecast, by Material Type, 2026-2033
- Demineralized Bone
- Calcium Sulphate
- Calcium Phosphate
- Tri Calcium Phosphate
- Others
- North America Market Size (US$ Bn) Forecast, by End User, 2026-2033
- Hospitals
- Ambulatory Surgical Centers
- Specialized Clinics
- Europe Bone Void Fillers Market Outlook: Historical (2020 – 2025) and Forecast (2026 – 2033)
- Key Highlights
- Europe Market Size (US$ Bn) Forecast, by Country, 2026-2033
- Germany
- Italy
- France
- U.K.
- Spain
- Russia
- Rest of Europe
- Europe Market Size (US$ Bn) Forecast, by Material Type, 2026-2033
- Demineralized Bone
- Calcium Sulphate
- Calcium Phosphate
- Tri Calcium Phosphate
- Others
- Europe Market Size (US$ Bn) Forecast, by End User, 2026-2033
- Hospitals
- Ambulatory Surgical Centers
- Specialized Clinics
- East Asia Bone Void Fillers Market Outlook: Historical (2020 – 2025) and Forecast (2026 – 2033)
- Key Highlights
- East Asia Market Size (US$ Bn) Forecast, by Country, 2026-2033
- China
- Japan
- South Korea
- East Asia Market Size (US$ Bn) Forecast, by Material Type, 2026-2033
- Demineralized Bone
- Calcium Sulphate
- Calcium Phosphate
- Tri Calcium Phosphate
- Others
- East Asia Market Size (US$ Bn) Forecast, by End User, 2026-2033
- Hospitals
- Ambulatory Surgical Centers
- Specialized Clinics
- South Asia & Oceania Bone Void Fillers Market Outlook: Historical (2020 – 2025) and Forecast (2026 – 2033)
- Key Highlights
- South Asia & Oceania Market Size (US$ Bn) Forecast, by Country, 2026-2033
- India
- Southeast Asia
- ANZ
- Rest of SAO
- South Asia & Oceania Market Size (US$ Bn) Forecast, by Material Type, 2026-2033
- Demineralized Bone
- Calcium Sulphate
- Calcium Phosphate
- Tri Calcium Phosphate
- Others
- South Asia & Oceania Market Size (US$ Bn) Forecast, by End User, 2026-2033
- Hospitals
- Ambulatory Surgical Centers
- Specialized Clinics
- Latin America Bone Void Fillers Market Outlook: Historical (2020 – 2025) and Forecast (2026 – 2033)
- Key Highlights
- Latin America Market Size (US$ Bn) Forecast, by Country, 2026-2033
- Brazil
- Mexico
- Rest of LATAM
- Latin America Market Size (US$ Bn) Forecast, by Material Type, 2026-2033
- Demineralized Bone
- Calcium Sulphate
- Calcium Phosphate
- Tri Calcium Phosphate
- Others
- Latin America Market Size (US$ Bn) Forecast, by End User, 2026-2033
- Hospitals
- Ambulatory Surgical Centers
- Specialized Clinics
- Middle East & Africa Bone Void Fillers Market Outlook: Historical (2020 – 2025) and Forecast (2026 – 2033)
- Key Highlights
- Middle East & Africa Market Size (US$ Bn) Forecast, by Country, 2026-2033
- GCC Countries
- South Africa
- Northern Africa
- Rest of MEA
- Middle East & Africa Market Size (US$ Bn) Forecast, by Material Type, 2026-2033
- Demineralized Bone
- Calcium Sulphate
- Calcium Phosphate
- Tri Calcium Phosphate
- Others
- Middle East & Africa Market Size (US$ Bn) Forecast, by End User, 2026-2033
- Hospitals
- Ambulatory Surgical Centers
- Specialized Clinics
- Competition Landscape
- Market Share Analysis, 2025
- Market Structure
- Competition Intensity Mapping
- Competition Dashboard
- Company Profiles
- Medtronic Plc
- Company Overview
- Product Portfolio/Offerings
- Key Financials
- SWOT Analysis
- Company Strategy and Key Developments
- Johnson and Johnson
- Zimmer Biomet
- Stryker Corporation
- NuVasive®, Inc.
- Wright Medical Group, Inc.
- Hoya Corporation
- Braun Melsungen AG
- Heraeus Holding
- Smith & Nephew plc
- Others
- Medtronic Plc
- Appendix
- Research Methodology
- Research Assumptions
- Acronyms and Abbreviations


- Medical Devices
- Bone Void Fillers Market
Bone Void Fillers Market Size, Share, and Growth Forecast 2026 - 2033
Bone Void Fillers Market by Material Type (Demineralized Bone, Calcium Sulphate, Calcium Phosphate, Tri Calcium Phosphate, Others), by End User (Hospitals, Ambulatory Surgical Centers, Specialized Clinics), by Regional Analysis, 2026-2033
Bone Void Fillers Market Size and Trend Analysis
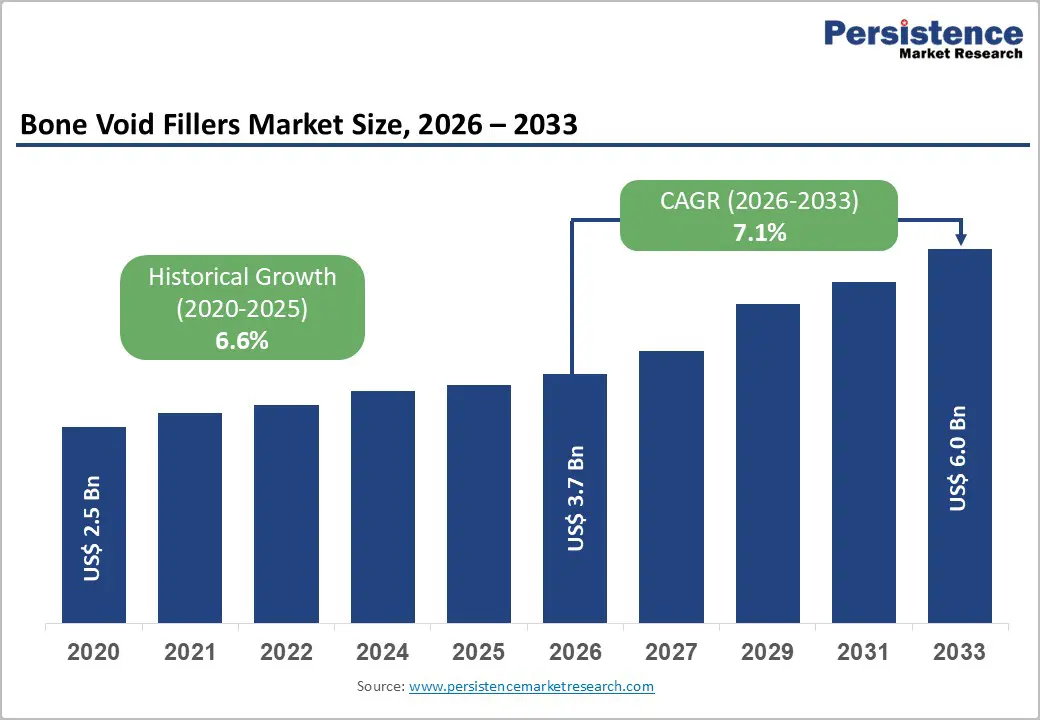
The global bone void fillers market size is expected to be valued at US$ 3.7 billion in 2026 and projected to reach US$ 6.0 billion by 2033, growing at a CAGR of 7.1% between 2026 and 2033.
The global bone void fillers market is experiencing steady growth, driven by increasing orthopedic procedure volumes and rising prevalence of bone-related disorders. Market expansion is supported by growing demand for minimally invasive treatments, particularly in trauma, spinal, and reconstructive surgeries. Demineralized bone matrix continues to hold a significant share due to proven clinical efficacy, while synthetic fillers such as calcium sulfate and tricalcium phosphate are gaining momentum because of their biocompatibility and cost advantages. Technological advancements, including injectable and antibiotic-eluting formulations, are improving surgical efficiency and reducing infection risks. Regionally, North America remains the largest market, while Asia Pacific is emerging as the fastest-growing region due to improving healthcare infrastructure and rising trauma cases.
Key Market highlights
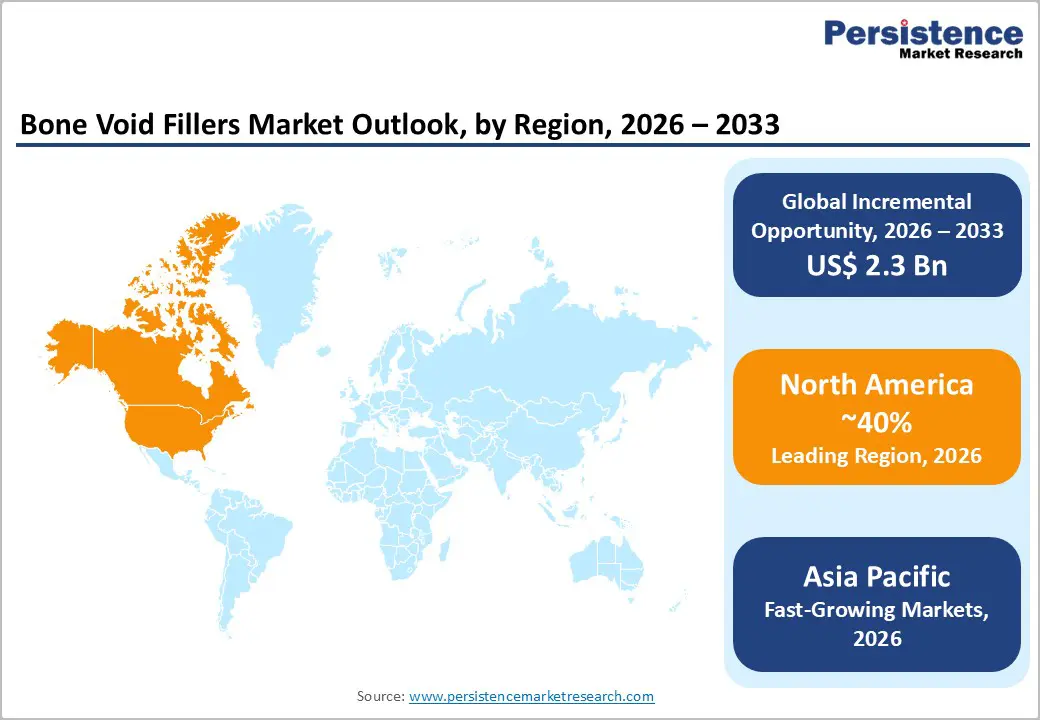
- Leading Region: North America accounts for approximately 40% market share in 2025, supported by high orthopedic procedure volumes, advanced healthcare infrastructure, and favorable reimbursement policies.
- Fastest Growing Region: Asia Pacific is witnessing the fastest growth, driven by rising trauma cases, expanding hospital infrastructure, increasing medical tourism, and adoption of cost-effective synthetic bone void fillers.
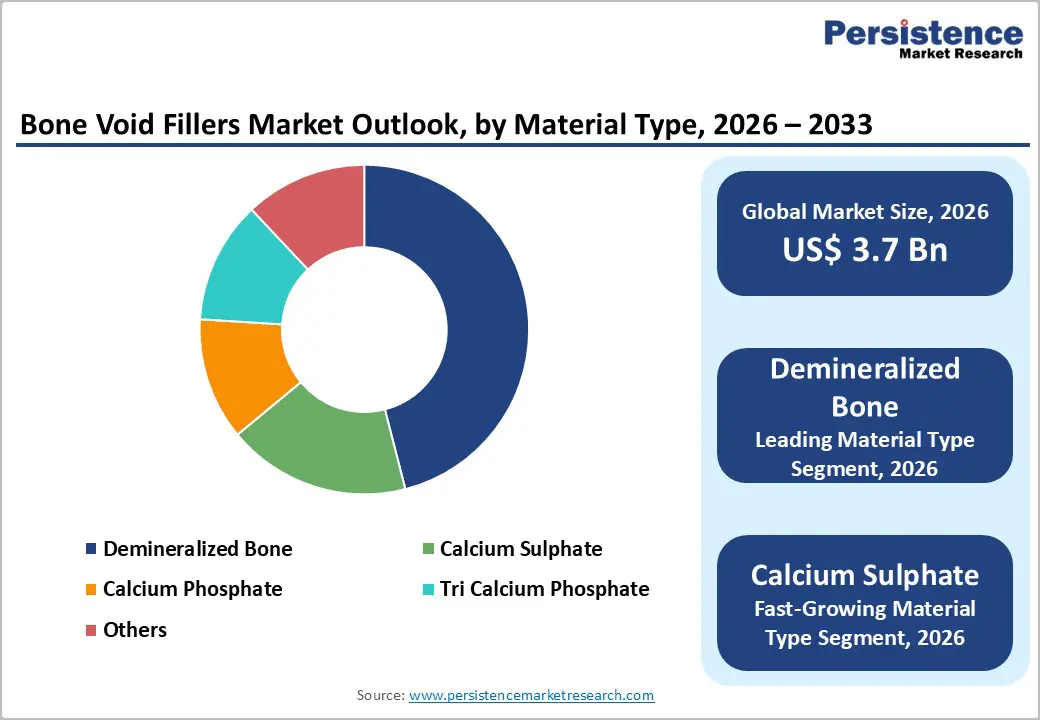
- Dominant Segment: Demineralized Bone Matrix (DBM) leads the material segment with around 46% market share in 2025, owing to strong osteoinductive properties and wide clinical acceptance in spine and trauma surgeries.
- Fastest Growing Segment: Calcium sulfate–based bone void fillers are the fastest growing, fueled by increasing use of injectable and antibiotic-eluting formulations for infection management and minimally invasive orthopedic procedures.
| Report Attribute | Details |
|---|---|
|
Bone Void Fillers Market Size (2026E) |
US$ 3.7 billion |
|
Market Value Forecast (2033F) |
US$ 6.0 billion |
|
Projected Growth CAGR (2026-2033) |
7.1% |
|
Historical Market Growth (2020-2025) |
6.6% |
Market Dynamics
Driver- Rising Burden of Orthopedic Disorders Driving Demand for Bone Void Fillers
The rising burden of orthopedic disorders is a major factor supporting the expansion of the bone void fillers market. Conditions such as chronic osteomyelitis, bone tumors, traumatic fractures, and bone lesions are becoming increasingly common due to aging populations, sedentary lifestyles, and a growing incidence of sports-related injuries and road accidents. Bone void fillers play a critical role in managing these conditions by providing structural support and promoting bone regeneration, particularly in cases of chronic osteomyelitis where dead bone cavities must be filled after infection removal. As the volume of orthopedic and trauma surgeries continues to increase worldwide, the demand for effective bone void management solutions is expected to rise steadily.
Another key growth driver is the growing adoption of advanced and synthetic bone void fillers. Concerns related to post-surgical infections have encouraged the use of antibiotic-eluting bone void fillers, which help deliver localized infection control while supporting bone healing. At the same time, synthetic fillers such as calcium sulfate and tricalcium phosphate are gaining preference due to their high biocompatibility, sterility, and reduced donor site morbidity compared to traditional grafts. These materials closely resemble the mineral composition of natural bone, enabling better integration and predictable outcomes. Ongoing research and product innovation are further strengthening clinical confidence, thereby accelerating market adoption.
Restraint- Low Penetration and Clinical Barriers of Bone Void Fillers
The growth of the global bone void fillers market is significantly constrained by a combination of clinical limitations and high procedural costs. One of the primary restraints is the low penetration and restricted clinical acceptance of bone void filling materials. Surgeons remain cautious due to the associated risks, such as incomplete or delayed bone regeneration, infection of surrounding soft tissue or bone, filler leakage or rupture, and inconsistent clinical outcomes. In addition, many bone void fillers require invasive surgical procedures, which increase the risk of complications and limit their widespread adoption, particularly in outpatient and low-resource healthcare settings. These clinical uncertainties reduce physician confidence and slow adoption across global markets.
Another major restraint is the high cost of orthopedic surgeries in which bone void fillers are commonly used. The overall cost of orthopedic procedures typically ranges between US$25,000 and US$30,000, including consultation and surgical expenses. The use of bone void fillers adds an additional US$1,000–2,000 to the procedure, placing a substantial financial burden on patients and healthcare systems. In price-sensitive markets, limited reimbursement coverage further restricts usage, thereby hampering the overall growth potential of the bone void fillers market.
Opportunity- Growth Opportunities from the Expansion of Ambulatory Surgical Centers
The rapid expansion of ambulatory surgical centers (ASCs) presents a strong growth opportunity for the bone void fillers market. ASCs are emerging as one of the fastest-growing end-user segments, driven by their ability to deliver high-quality orthopedic care at lower costs and with shorter patient stays. These centers collectively perform millions of orthopedic procedures each year, with a growing preference for minimally invasive techniques. Injectable bone void fillers are increasingly favored in ASC settings due to their ease of use, reduced operating time, and compatibility with outpatient workflows. As aging populations seek faster recovery and same-day discharge options, the shift toward outpatient orthopedic surgeries is expected to accelerate further, strengthening demand for bone void fillers.
In parallel, product innovations tailored to ASC requirements are creating additional revenue opportunities. Advanced formulations such as antibiotic-eluting calcium sulfate fillers address critical concerns related to post-surgical infections, particularly in osteomyelitis and trauma cases. These solutions support localized drug delivery while maintaining structural bone support, aligning well with infection-control protocols in outpatient environments. Manufacturers expanding their portfolios with ASC-friendly, injectable, and infection-resistant bone void fillers are well positioned to capitalize on rising procedure volumes and the growing clinical importance of ambulatory surgical centers.
Category-wise Insights
Material Type Analysis
Demineralized Bone Matrix (DBM) remains the leading material segment in the bone void fillers market, accounting for nearly 46% market share in 2025. Its dominance is primarily attributed to strong osteoinductive capabilities, as DBM contains natural growth factors that stimulate stem cell differentiation into osteoblasts, supporting effective and reliable bone regeneration. This biological advantage makes DBM a preferred choice in demanding orthopedic applications, including spinal fusion procedures, trauma-related bone defects, and complex reconstructive surgeries. In addition, the availability of donor-derived sources helps reduce the need for autografts, thereby minimizing donor site morbidity and shortening recovery times. DBM is also increasingly used in dental and maxillofacial procedures, supported by high implant volumes in developed markets such as Europe. Consistent clinical outcomes, surgeon familiarity, and established regulatory pathways further reinforce DBM’s leadership position within the global bone void fillers market.
End User Analysis
Hospitals continue to dominate the end-user landscape of the bone void fillers market, holding close to 49% market share in 2025. This leadership is driven by the high volume of orthopedic and trauma-related procedures performed in hospital settings, particularly complex surgeries that require advanced imaging, surgical expertise, and post-operative care. Hospitals are the primary centers for treating fractures, bone defects, spinal conditions, and reconstructive cases, all of which frequently require bone void fillers. Their access to a broad range of graft materials, specialized surgeons, and multidisciplinary teams support consistent usage across multiple indications. Moreover, hospitals benefit from higher patient inflow and established reimbursement mechanisms in many regions. Continued investments in hospital infrastructure, expansion of orthopedic departments, and rising trauma cases globally are expected to sustain hospitals’ leading role as the primary end users of bone void fillers.
Regional Insights
North America Bone Void Fillers Market Trends and Insights
North America continues to represent the largest regional market for bone void fillers, supported by a high volume of orthopedic procedures and advanced clinical adoption. The region benefits from well-established healthcare infrastructure, widespread access to specialized orthopedic surgeons, and strong awareness of advanced bone regeneration solutions. Rising incidences of trauma, age-related bone disorders, and sports injuries contribute significantly to procedure volumes. In addition, early adoption of innovative products, including injectable and antibiotic-eluting bone void fillers, has strengthened market penetration across hospitals and ambulatory surgical centers. Favorable reimbursement policies for orthopedic interventions in the U.S. further encourage the use of bone void fillers in complex fracture and spinal surgeries. Ongoing clinical research, combined with active participation of leading medical device manufacturers, continues to support product development and regulatory approvals. These factors collectively position North America as a mature yet innovation-driven market with steady demand across trauma, spinal, and reconstructive applications.
Asia Pacific Bone Void Fillers Market Trends and Insights
The Asia Pacific bone void fillers market is experiencing rapid growth, driven by expanding healthcare access and increasing orthopedic procedure volumes. Rising incidences of road accidents, sports injuries, and degenerative bone conditions across densely populated countries are creating strong demand for bone repair solutions. Improvements in hospital infrastructure and the growing availability of trained orthopedic specialists are enhancing procedural capacity across both public and private healthcare facilities. Cost-effective synthetic bone void fillers, such as calcium sulfate and tricalcium phosphate, are gaining preference in the region due to affordability and ease of use. Additionally, the expansion of medical tourism in countries like India, Thailand, and South Korea is supporting higher surgical volumes. Governments are also investing in healthcare modernization and trauma care systems, further strengthening market growth. Together, these trends position Asia Pacific as the fastest-growing regional market for bone void fillers over the forecast period.
Competitive Landscape
Market Structure Analysis
The bone void fillers market is moderately competitive and characterized by a high level of consolidation, with a limited number of large players accounting for a significant share of global revenues. Leading companies maintain strong positions through broad product portfolios, established distribution networks, and long-standing relationships with hospitals and orthopedic surgeons. As the market continues to expand, mergers and acquisitions remain a key strategic focus for industry participants. Companies are actively pursuing acquisitions to strengthen their technological capabilities, enter new geographic markets, and diversify offerings across synthetic, biologic, and antibiotic-eluting bone void fillers. These inorganic growth strategies also enable faster regulatory access and reduce time-to-market for advanced solutions. In addition, players are investing in research and development to enhance clinical outcomes and address unmet needs in trauma and reconstructive procedures, further intensifying competitive dynamics.?
Key Market Developments
- In July 2025: Medtronic reached a key enrollment milestone in the INFUSE™ Bone Graft TLIF study and received an FDA-approved protocol amendment for degenerative spine indications.
- In April 2023: Abyrx, Inc. announced that its MONTAGE Settable, Resorbable Bone Putty received additional U.S. FDA clearances for use as a bone void filler as well as a cranial bone cement.
Companies Covered in Bone Void Fillers Market
- Medtronic Plc
- Johnson and Johnson
- Zimmer Biomet
- Stryker Corporation
- NuVasive®, Inc.
- Wright Medical Group, Inc.
- Hoya Corporation
- Braun Melsungen AG
- Heraeus Holding
- Smith & Nephew plc
- Others
Frequently Asked Questions
The global bone void fillers market is expected to reach US$ 3.7 billion in 2026.
The increasing prevalence of orthopedic problems along with the increase in the adoption of antibiotic-eluting bone void fillers and synthetic bone void fillers are the key factors driving the growth of the market.
North America leads with 40% share in 2025.
Expansion of ambulatory surgical centers and rising demand for injectable, antibiotic-eluting bone void fillers in outpatient orthopedic procedures.
Johnson and Johnson, Zimmer Biomet, Stryker Corporation, NuVasive®, Inc., and Hoya Corporation are among the top players in the market.


