Automotive Multifunction Switches Market

Global Market Study on Automotive Multifunction Switches: Automated Motion Control Operations and Advanced In-car Functionalities Grab the Spotlight

Automotive Multifunction Switches Market Taxonomy By Passenger Cars, Light Commercial Vehicles, Heavy Commercial Vehicles, Electric Cars Vehicle Type Which includes Compact Cars, SUV, Luxury Cars, Trucks and Trailers, Battery Electric Vehicles, Plug-in Hybrid Electric Vehicles

Report ID: PMRREP29305

Number of Pages: 208

Format: PPT*, PDF, EXCEL

Industry: Automotive

Published Date: July-2019

Report Price

$4900*

Buy Now

Table of Content

1. Executive Summary

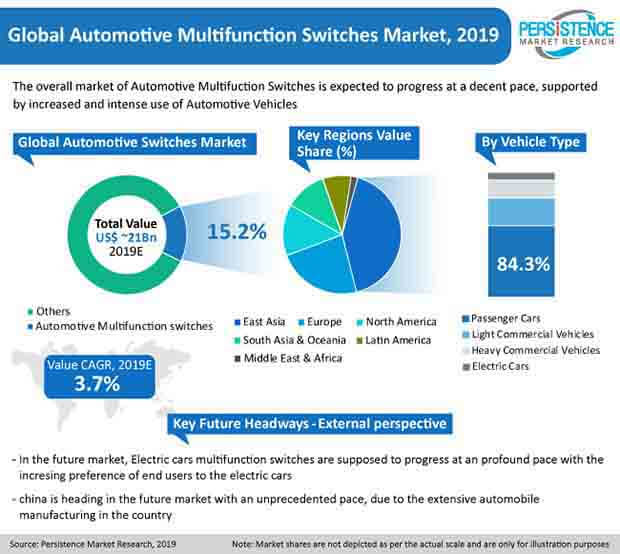
    1.1. Global Market Outlook

    1.2. Demand Side Trends

    1.3. Supply Side Trends

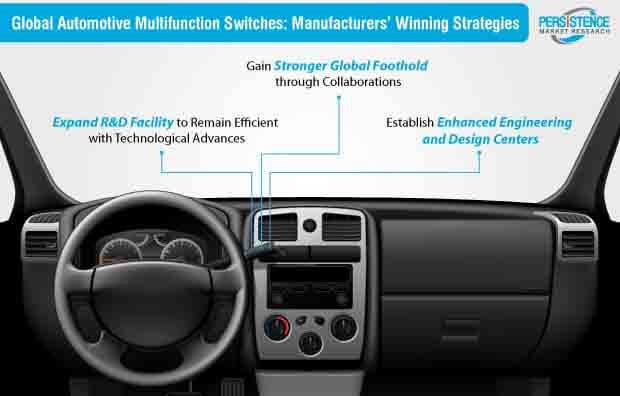
    1.4. Analysis and Recommendations

2. Market Overview

    2.1. Market Coverage / Taxonomy

    2.2. Market Definition / Scope / Limitations

    2.3. Parent Market Overview

3. Market Forecast

    3.1. Pricing Analysis

4. Global Automotive Multifunction Switches – Pricing Analysis

    4.1. Pricing Analysis

5. Global Automotive Multifunction Switches Value Analysis

    5.1. Value Analysis

6. Global Automotive Multifunction Switches – Market Background

    6.1. Macroeconomics Factors

        6.1.1. Urbanization Outlook

        6.1.2. North America GDP & automotive multifunction switches Sales Outlook

        6.1.3. Latin America GDP & automotive multifunction switches Sales Outlook

        6.1.4. Europe GDP & automotive multifunction switches Sales Outlook

        6.1.5. APAC GDP & automotive multifunction switches Sales Outlook

        6.1.6. MEA GDP & automotive multifunction switches Sales Outlook

    6.2. Forecast Factors: Relevance and Impact

        6.2.1. Raw material availability in abundance and economic price of raw materials

        6.2.2. Increased demographic diversity for the vehicle production could act as a catalyst

        6.2.3. Global Automobile sales Outlook

        6.2.4. Global Automobile manufacturing Outlook

        6.2.5. GDP Growth

        6.2.6. Preference Towards Electro-mobility

    6.3. Value Chain Analysis

    6.4. Market Dynamics

        6.4.1. Drivers

        6.4.2. Restraints

        6.4.3. Opportunity Analysis

        6.4.4. Market Trends

7. Global Automotive Multifunction Switches Market Analysis 2014–2018 and Forecast 2019-2029, by Vehicle Type

    7.1. Introduction / Key Findings

    7.2. Historical Market Size (US$ Mn) and Volume (‘000 Units) Analysis By Vehicle Type, 2014 - 2018

    7.3. Current and Future Market Size (US$ Mn) and Volume (‘000 Units) Analysis and Forecast By Vehicle Type, 2019 - 2029

        7.3.1. Passenger Cars

            7.3.1.1. Compact Cars

            7.3.1.2. Mid-size Cars

            7.3.1.3. SUV

            7.3.1.4. Luxury Cars

        7.3.2. Light Commercial Vehicles

        7.3.3. Heavy Commercial Vehicles

            7.3.3.1. Trucks and Trailers

            7.3.3.2. Buses and Coaches

        7.3.4. Electric Vehicles

            7.3.4.1. Battery Electric Vehicles

            7.3.4.2. Hybrid Electric Vehicles

            7.3.4.3. Plug-in Hybrid Electric Vehicles

    7.4. Market Attractiveness Analysis By Vehicle Type

8. Global Automotive Multifunction Switches Market Analysis 2014–2018 and Forecast 2019-2029, by Sales Channel

    8.1. Introduction / Key Findings

    8.2. Historical Market Size (US$ Mn) and Volume (‘000 Units) Analysis By Sales Channel, 2014 - 2018

    8.3. Current and Future Market Size (US$ Mn) and Volume (‘000 Units) Analysis and Forecast By Sales Channel, 2019 - 2029

        8.3.1. OEM

        8.3.2. Aftermarket

    8.4. Market Attractiveness Analysis By Sales Channel

9. Global Automotive Multifunction Switches Market Analysis 2014–2018 and Forecast 2019-2029, by Region

    9.1. Introduction

    9.2. Historical Market Size (US$ Mn) and Volume (‘000 Units) Analysis By Region, 2014 - 2018

    9.3. Current Market Size (US$ Mn) and Volume (‘000 Units) Analysis and Forecast By Region, 2019 - 2029

        9.3.1. North America

        9.3.2. Latin America

        9.3.3. Europe

        9.3.4. East Asia

        9.3.5. South Asia & Oceania

        9.3.6. Middle East and Africa (MEA)

    9.4. Market Attractiveness Analysis By Region

10. North America Automotive Multifunction Switches Market Analysis 2014–2018 and Forecast 2019-2029

    10.1. Introduction

    10.2. Historical Market Size (US$ Mn) and Volume (‘000 Units) Trend Analysis By Market Taxonomy, 2014 - 2018

    10.3. Market Size (US$ Mn) and Volume (‘000 Units) Forecast By Market Taxonomy, 2019 - 2029

        10.3.1. By Country

            10.3.1.1. U.S.

            10.3.1.2. Canada

        10.3.2. By Vehicle Type

        10.3.3. By Sales Channel

    10.4. Market Attractiveness Analysis

        10.4.1. By Country

        10.4.2. By Vehicle Type

        10.4.3. By Sales Channel

11. Latin America Automotive Multifunction Switches Market Analysis 2014–2018 and Forecast 2019-2029

    11.1. Introduction

    11.2. Historical Market Size (US$ Mn) and Volume (‘000 Units) Trend Analysis By Market Taxonomy, 2014 - 2018

    11.3. Market Size (US$ Mn) and Volume (‘000 Units) Forecast By Market Taxonomy, 2019 - 2029

        11.3.1. By Country

            11.3.1.1. Brazil

            11.3.1.2. Mexico

            11.3.1.3. Rest of Latin America

        11.3.2. By Vehicle Type

        11.3.3. By Sales Channel

    11.4. Market Attractiveness Analysis

        11.4.1. By Country

        11.4.2. By Vehicle Type

12. Europe Automotive Multifunction Switches Market Analysis 2014–2018 and Forecast 2019-2029

    12.1. Introduction

    12.2. Historical Market Size (US$ Mn) and Volume (‘000 Units) Trend Analysis By Market Taxonomy, 2014 - 2018

    12.3. Market Size (US$ Mn) and Volume (‘000 Units) Forecast By Market Taxonomy, 2019 - 2029

        12.3.1. By Country

            12.3.1.1. Germany

            12.3.1.2. France

            12.3.1.3. U.K.

            12.3.1.4. Spain

            12.3.1.5. Italy

            12.3.1.6. Russia

            12.3.1.7. Poland

            12.3.1.8. Rest of Europe

        12.3.2. By Vehicle Type

        12.3.3. By Switch Structure

    12.4. Market Attractiveness Analysis

        12.4.1. By Country

        12.4.2. By Vehicle Type

        12.4.3. By Sales Channel

        12.4.4. By Sales Channel

    12.5. Market Attractiveness Analysis

        12.5.1. By Country

        12.5.2. By Vehicle Type

        12.5.3. By Sales Channel

13. East Asia Automotive Multifunction Switches Market Analysis 2014–2018 and Forecast 2019-2029

    13.1. Introduction

    13.2. Historical Market Size (US$ Mn) and Volume (‘000 Units) Trend Analysis By Market Taxonomy, 2014 - 2018

    13.3. Market Size (US$ Mn) and Volume (‘000 Units) Forecast By Market Taxonomy, 2019 - 2029

        13.3.1. By Country

            13.3.1.1. China

            13.3.1.2. Japan

            13.3.1.3. South Korea

        13.3.2. By Vehicle Type

        13.3.3. By Sales Channel

    13.4. Market Attractiveness Analysis

        13.4.1. By Country

        13.4.2. By Vehicle Type

        13.4.3. By Sales Channel

14. South Asia & Oceania Automotive Multifunction Switches Market Analysis 2014–2018 and Forecast 2019-2029

    14.1. Introduction

    14.2. Historical Market Size (US$ Mn) and Volume (‘000 Units) Trend Analysis By Market Taxonomy, 2014 - 2018

    14.3. Market Size (US$ Mn) and Volume (‘000 Units) Forecast By Market Taxonomy, 2019 - 2029

        14.3.1. By Country

            14.3.1.1. India

            14.3.1.2. ASEAN

            14.3.1.3. ANZ

            14.3.1.4. Rest of South Asia

        14.3.2. By Vehicle Type

        14.3.3. By Sales Channel

15. Middle East and Africa Automotive Multifunction Switches Market Analysis 2014–2018 and Forecast 2019-2029

    15.1. Introduction

    15.2. Historical Market Size (US$ Mn) and Volume (‘000 Units) Trend Analysis By Market Taxonomy, 2014 - 2018

    15.3. Market Size (US$ Mn) and Volume (‘000 Units) Forecast By Market Taxonomy, 2019 - 2029

        15.3.1. By Country

            15.3.1.1. South Africa

            15.3.1.2. Turkey

            15.3.1.3. Rest of Middle East and Africa

        15.3.2. By Vehicle Type

        15.3.3. By Sales Channel

    15.4. Market Attractiveness Analysis

        15.4.1. By Country

        15.4.2. By Vehicle Type

        15.4.3. By Sales Channel

16. Emerging Countries Automotive Multifunction Switches Market Analysis 2014–2018 and Forecast 2019-2029

    16.1. Introduction

        16.1.1. Market Value Proportion Analysis, By Key Countries

        16.1.2. Global Vs. Country Growth Comparison

    16.2. Mexico Automotive Multifunction Switches Market Analysis

        16.2.1. Introduction

        16.2.2. Pricing Analysis

        16.2.3. Market Value Proportion Analysis by Market Taxonomy

        16.2.4. Market Volume (‘000 Units) and Value (US$ Mn) Analysis and Forecast by Market Taxonomy

            16.2.4.1. By Vehicle Type

            16.2.4.2. By Sales Channel

        16.2.5. Mexico Automotive Multifunction Switches Market - Competition Landscape

    16.3. India Automotive Multifunction Switches Market Analysis

        16.3.1. Introduction

        16.3.2. Pricing Analysis

        16.3.3. Market Value Proportion Analysis by Market Taxonomy

        16.3.4. Market Volume (‘000 Units) and Value (US$ Mn) Analysis and Forecast by Market Taxonomy

            16.3.4.1. By Vehicle Type

            16.3.4.2. By Sales Channel

        16.3.5. India Automotive Multifunction Switches Market - Competition Landscape

    16.4. Turkey Automotive Multifunction Switches Market Analysis

        16.4.1. Introduction

        16.4.2. Pricing Analysis

        16.4.3. Market Value Proportion Analysis by Market Taxonomy

        16.4.4. Market Volume (‘000 Units) and Value (US$ Mn) Analysis and Forecast by Market Taxonomy

            16.4.4.1. By Vehicle Type

            16.4.4.2. By Sales Channel

        16.4.5. Turkey Automotive Multifunction Switches Market - Competition Landscape

17. Market Structure Analysis

    17.1. Market Analysis by Tier of Companies (Automotive Multifunction Switches)

    17.2. Market Concentration

    17.3. Market Share Analysis of Top Players

18. Competition Analysis

    18.1. Competition Dashboard

    18.2. Competition Benchmarking

    18.3. Competition Deep Dive

        18.3.1. TOKAI RIKA CO., LTD.

            18.3.1.1. Overview

            18.3.1.2. Product Portfolio

            18.3.1.3. Profitability by Market Segments (Product/Vehicle/Channel/Region)

            18.3.1.4. Sales Footprint

            18.3.1.5. Strategy Overview

                18.3.1.5.1. Marketing Strategy

                18.3.1.5.2. Product Strategy

                18.3.1.5.3. Channel Strategy

        18.3.2. Toyodenso Co.,Ltd

            18.3.2.1. Overview

            18.3.2.2. Product Portfolio

            18.3.2.3. Profitability by Market Segments (Product/Vehicle/Channel/Region)

            18.3.2.4. Sales Footprint

            18.3.2.5. Strategy Overview

                18.3.2.5.1. Marketing Strategy

                18.3.2.5.2. Product Strategy

                18.3.2.5.3. Channel Strategy

        18.3.3. Leopold Kostal GmbH & Co. KG

            18.3.3.1. Overview

            18.3.3.2. Product Portfolio

            18.3.3.3. Profitability by Market Segments (Product/Vehicle/Channel/Region)

            18.3.3.4. Sales Footprint

            18.3.3.5. Strategy Overview

                18.3.3.5.1. Marketing Strategy

                18.3.3.5.2. Product Strategy

                18.3.3.5.3. Channel Strategy

        18.3.4. Merit Automotive Electronics Systems, S.L.U.

            18.3.4.1. Overview

            18.3.4.2. Product Portfolio

            18.3.4.3. Profitability by Market Segments (Product/Vehicle/Channel/Region)

            18.3.4.4. Sales Footprint

            18.3.4.5. Strategy Overview

                18.3.4.5.1. Marketing Strategy

                18.3.4.5.2. Product Strategy

                18.3.4.5.3. Channel Strategy

        18.3.5. UNO Minda, N K Minda Group

            18.3.5.1. Overview

            18.3.5.2. Product Portfolio

            18.3.5.3. Profitability by Market Segments (Product/Vehicle/Channel/Region)

            18.3.5.4. Sales Footprint

            18.3.5.5. Strategy Overview

                18.3.5.5.1. Marketing Strategy

                18.3.5.5.2. Product Strategy

                18.3.5.5.3. Channel Strategy

        18.3.6. Wells Vehicle Electronics

            18.3.6.1. Overview

            18.3.6.2. Product Portfolio

            18.3.6.3. Profitability by Market Segments (Product/Vehicle/Channel/Region)

            18.3.6.4. Sales Footprint

            18.3.6.5. Strategy Overview

                18.3.6.5.1. Marketing Strategy

                18.3.6.5.2. Product Strategy

                18.3.6.5.3. Channel Strategy

        18.3.7. Danlaw Technologies India Ltd

            18.3.7.1. Overview

            18.3.7.2. Product Portfolio

            18.3.7.3. Profitability by Market Segments (Product/Vehicle/Channel/Region)

            18.3.7.4. Sales Footprint

            18.3.7.5. Strategy Overview

                18.3.7.5.1. Marketing Strategy

                18.3.7.5.2. Product Strategy

                18.3.7.5.3. Channel Strategy

        18.3.8. COBO SPA

            18.3.8.1. Overview

            18.3.8.2. Product Portfolio

            18.3.8.3. Profitability by Market Segments (Product/Vehicle/Channel/Region)

            18.3.8.4. Sales Footprint

            18.3.8.5. Strategy Overview

                18.3.8.5.1. Marketing Strategy

                18.3.8.5.2. Product Strategy

                18.3.8.5.3. Channel Strategy

        18.3.9. Valeo

            18.3.9.1. Overview

            18.3.9.2. Product Portfolio

            18.3.9.3. Profitability by Market Segments (Product/Vehicle/Channel/Region)

            18.3.9.4. Sales Footprint

            18.3.9.5. Strategy Overview

                18.3.9.5.1. Marketing Strategy

                18.3.9.5.2. Product Strategy

                18.3.9.5.3. Channel Strategy

        18.3.10. Fiat Chrysler Automobiles

            18.3.10.1. Overview

            18.3.10.2. Product Portfolio

            18.3.10.3. Profitability by Market Segments (Product/Vehicle/Channel/Region)

            18.3.10.4. Sales Footprint

            18.3.10.5. Strategy Overview

                18.3.10.5.1. Marketing Strategy

                18.3.10.5.2. Product Strategy

                18.3.10.5.3. Channel Strategy

        18.3.11. LS Automotive

            18.3.11.1. Overview

            18.3.11.2. Product Portfolio

            18.3.11.3. Profitability by Market Segments (Product/Vehicle/Channel/Region)

            18.3.11.4. Sales Footprint

            18.3.11.5. Strategy Overview

                18.3.11.5.1. Marketing Strategy

                18.3.11.5.2. Product Strategy

                18.3.11.5.3. Channel Strategy

        18.3.12. Nexteer Automotive

            18.3.12.1. Overview

            18.3.12.2. Product Portfolio

            18.3.12.3. Profitability by Market Segments (Product/Vehicle/Channel/Region)

            18.3.12.4. Sales Footprint

            18.3.12.5. Strategy Overview

                18.3.12.5.1. Marketing Strategy

                18.3.12.5.2. Product Strategy

                18.3.12.5.3. Channel Strategy

19. Assumptions and Acronyms Used

20. Research Methodology

Sample Report

Report Sample is Available

In-depth report coverage is now just a few seconds away

Download PDF Get FREE Report Sample

List Of Table

Table 01: Automotive Multifunction Switches Market Volume (000’'000 Units) Historical Data 2013 – 2017 and Forecast 2019 – 2029 By Vehicle type

Table 02: Automotive Multifunction Switches Market Value (US$ Mn) Historical Data 2013 – 2017 and Forecast 2019 – 2029 By Vehicle type

Table 03: Automotive Multifunction Switches Market Value (US$ Mn) and Volume ('000 Units) Historical Data 2014 – 2018 and Forecast 2019 – 2029 By Sales Channel

Table 04: Automotive Multifunction Switches Market Value (US$ Mn) Volume ('000 Units) Historical Data 2014 – 2018 and Forecast 2019 – 2029 by Region

Table 05: North America Automotive Multifunction Switches Market Value (US$ Mn) and Volume ('000 Units) Historical Data 2014 – 2018 and Forecast 2019 – 2029 by Country

Table 06: North America Automotive Multifunction Switches Market Volume ('000 Units) Historical Data 2014 – 2018 and Forecast 2019 – 2029 By Vehicle Type

Table 07: North America Automotive Multifunction Switches Market Value (Mn US$) Historical Data 2014 – 2018 and Forecast 2019 – 2029 By Vehicle Type

Table 08: North America Automotive Multifunction Switches Market Value (US$ Mn) and Volume ('000 Units) Historical Data 2014 – 2018 and Forecast 2019 – 2029 By Sales Channel

Table 09: Latin America Automotive Multifunction Switches Market Value (US$ Mn) and Volume ('000 Units) Historical Data 2014 – 2018 and Forecast 2019 – 2029 by Country

Table 10: Latin America Automotive Multifunction Switches Market Volume ('000 Units) Historical Data 2014 – 2018 and Forecast 2019 – 2029 By Vehicle Type

Table 11: Latin America Automotive Multifunction Switches Market Value (Mn US$) Historical Data 2014 – 2018 and Forecast 2019 – 2029 By Vehicle Type

Table 12: South Asia Automotive Multifunction Switches Market Value (US$ Mn) and Volume ('000 Units) Historical Data 2014 – 2018 and Forecast 2019 – 2029 By Sales Channel

Table 13: Europe Automotive Multifunction Switches Market Value (US$ Mn) and Volume ('000 Units) Historical Data 2014 – 2018 and Forecast 2019 – 2029 by Country

Table 14: Europe Automotive Multifunction Switches Market Volume ('000 Units) Historical Data 2014 – 2018 and Forecast 2019 – 2029 by Vehicle Type

Table 15: Europe Automotive Multifunction Switches Market Value (Mn US$) Historical Data 2014 – 2018 and Forecast 2019 – 2029 by Vehicle Type

Table 16: South Asia Automotive Multifunction Switches Market Value (US$ Mn) and Volume ('000 Units) Historical Data 2014 – 2018 and Forecast 2019 – 2029 By Sales Channel

Table 17: East Asia & Oceania Automotive Multifunction Switches Market Value (US$ Mn) and Volume ('000 Units) Historical Data 2014 – 2018 and Forecast 2019 – 2029 by Country

Table 18: East Asia Automotive Multifunction Switches Market Volume ('000 Units) Historical Data 2014 – 2018 and Forecast 2019 – 2029 by Vehicle Type

Table 19: East Asia Automotive Multifunction Switches Market Value (Mn US$) Historical Data 2014 – 2018 and Forecast 2019 – 2029 by Vehicle Type

Table 20: South Asia Automotive Multifunction Switches Market Value (US$ Mn) and Volume ('000 Units) Historical Data 2014 – 2018 and Forecast 2019 – 2029 By Sales Channel

Table 21: South Asia Automotive Multifunction Switches Market Value (US$ Mn) and Volume ('000 Units) Historical Data 2014 – 2018 and Forecast 2019 – 2029 by Country

Table 22: South Asia Automotive Multifunction Switches Market Volume ('000 Units) Historical Data 2014 – 2018 and Forecast 2019 – 2029 by Vehicle Type

Table 23: South Asia Automotive Multifunction Switches Market Value (Mn US$) Historical Data 2014 – 2018 and Forecast 2019 – 2029 by Vehicle Type

Table 24: South Asia Automotive Multifunction Switches Market Value (US$ Mn) and Volume ('000 Units) Historical Data 2014 – 2018 and Forecast 2019 – 2029 By Sales Channel

Table 25: Middle East & Africa Automotive Multifunction Switches Market Value (US$ Mn) and Volume ('000 Units) Historical Data 2014 – 2018 and Forecast 2019 – 2029 by Country

Table 26: Middle East & Africa Automotive Multifunction Switches Market Volume ('000 Units) Historical Data 2014 – 2018 and Forecast 2019 – 2029 by Vehicle Type

Table 27: Middle East & Africa Automotive Multifunction Switches Market Value (Mn US$) Historical Data 2014 – 2018 and Forecast 2019 – 2029 by Vehicle Type

Table 28: Middle East & Africa Automotive Multifunction Switches Market Value (US$ Mn) and Volume ('000 Units) Historical Data 2014 – 2018 and Forecast 2019 – 2029 By Sales Channel

Table 29: Mexico Automotive Multifunction Switches Market Volume ('000 Units) Historical Data 2014–2018 and Forecast 2019–2029 by End Use

Table 30: Mexico Automotive Multifunction Switches Market Value (US$ Mn) Historical Data 2014–2018 and Forecast 2019–2029 by End Use

Table 31: Mexico Automotive Multifunction Switches Market Value (US$ Mn) and Volume ('000 Units) Historical Data 2014–2018 and Forecast 2019–2029 by Product Type

Table 32: India Automotive Multifunction Switches Market Volume ('000 Units) Historical Data 2014–2018 and Forecast 2019–2029 by End Use

Table 33: India Automotive Multifunction Switches Market Value (US$ Mn) Historical Data 2014–2018 and Forecast 2019–2029 by End Use

Table 34: India Automotive Multifunction Switches Market Value (US$ Mn) and Volume ('000 Units) Historical Data 2014–2018 and Forecast 2019–2029 by Product Type

Table 35: Turkey Automotive Multifunction Switches Market Volume ('000 Units) Historical Data 2014–2018 and Forecast 2019–2029 by End Use

Table 36: Turkey Automotive Multifunction Switches Market Value (US$ Mn) Historical Data 2014–2018 and Forecast 2019–2029 by End Use

Table 37: Turkey Automotive Multifunction Switches Market Value (US$ Mn) and Volume ('000 Units) Historical Data 2014–2018 and Forecast 2019–2029 by Product Type

Custom Report Cover

Make This Report Your Own

Take Advantage of Intelligence Tailored to your Business Objective

> Get a Customized Version

- List Of Chart -

Figure 01: Global Historical Market Volume (000’ '000 Units) Analysis, 2014-2019

Figure 02: Global Current and Future Market Volume (000’ '000 Units) Analysis, 2019-2029

Figure 03: Automotive Multifunction Switches Market Historical Value (US$ Mn), 2014 – 2019

Figure 04: Automotive Multifunction Switches Market Value (US$ Mn) Forecast, 2019 – 2029

Figure 05: Automotive Multifunction Switches Market Absolute $ Opportunity, 2013 to 2019 and 2029

Figure 06: Urbanization Outlook (Y-o-Y Change) V/S automotive multifunction switches Market (Y-o-Y Change)

Figure 07: North America GDP Growth Y-o-Y (%) and automotive multifunction switches Sales Forecast Comparison, 2017 – 2028

Figure 08: Latin America GDP Growth Y-o-Y (%) and automotive multifunction switches Sales Forecast Comparison, 2017 – 2028

Figure 09: Europe GDP Growth Y-o-Y (%) and automotive multifunction switches Sales Forecast Comparison, 2017 – 2028

Figure 10: APAC GDP Growth Y-o-Y (%) and automotive multifunction switches Sales Forecast Comparison, 2017 – 2028

Figure 11: MEA GDP Growth Y-o-Y (%) and automotive multifunction switches Sales Forecast Comparison, 2017 – 2028

Figure 12: Automotive Multifunction Switches Market Share and BPS Analysis by Vehicle type– 2019 & 2029

Figure 13: Automotive Multifunction Switches Market Y-o-Y Growth Projections by Vehicle type, 2019-2029

Figure 14: Automotive Multifunction Switches Market Attractiveness by Vehicle type, 2019-2029

Figure 15: Automotive Multifunction Switches Market Absolute $ Opportunity by Passenger car , 2019 – 2029

Figure 16: Automotive Multifunction Switches Market Absolute $ Opportunity by Light Commercial Vehicle Segment, 2019 – 2029

Figure 17: Automotive Multifunction Switches Market Absolute $ Opportunity by Heavy Commercial Vehicles, 2019 – 2029

Figure 18: Automotive Multifunction Switches Market Absolute $ Opportunity by Electric vehicle Segment, 2019 – 2029

Figure 19: Automotive Multifunction Switches Market Share and BPS Analysis by Sales Channel– 2019 & 2029

Figure 20: Automotive Multifunction Switches Market Y-o-Y Growth Projections by Sales Channel, 2019-2029

Figure 21: Automotive Multifunction Switches Market Attractiveness by Sales Channel, 2019-2029

Figure 22: Automotive Multifunction Switches Market Absolute $ Opportunity by OEM Segment, 2018 – 2029

Figure 23: Automotive Multifunction Switches Market Absolute $ Opportunity by Aftermarket Segment, 2018 – 2029

Figure 24: Automotive Multifunction Switches Market Share & BPS Analysis by Region, 2019 & 2029

Figure 25: Automotive Multifunction Switches Market Y-o-Y Growth Projection by Region, 2019-2029

Figure 26: Automotive Multifunction Switches Market Attractiveness Analysis by Region, 2019 – 2029

Figure 27: North America Automotive Multifunction Switches Market Share and BPS Analysis by Country– 2019 & 2029

Figure 28: North America Automotive Multifunction Switches Market Y-o-Y Growth Projections by Country, 2019-2029

Figure 29: North America Automotive Multifunction Switches Market Attractiveness by Country, 2019-2029

Figure 30: U.S. Automotive Multifunction Switches Market Absolute $ Opportunity, 2018 – 2029

Figure 31: Canada Automotive Multifunction Switches Market Absolute $ Opportunity, 2018 – 2029

Figure 32: North America Automotive Multifunction Switches Market Share and BPS Analysis by Vehicle Type– 2019 & 2029

Figure 33: North America Automotive Multifunction Switches Market Y-o-Y Growth Projections by Vehicle Type, 2019-2029

Figure 34: North America Automotive Multifunction Switches Market Attractiveness by Vehicle Type, 2019-2029

Figure 35: North America Automotive Multifunction Switches Market Share and BPS Analysis by Sales Channel– 2019 & 2029

Figure 36: North America Automotive Multifunction Switches Market Y-o-Y Growth Projections by Sales Channel, 2019-2029

Figure 37: North America Automotive Multifunction Switches Market Attractiveness by Sales Channel, 2019-2029

Figure 38: Latin America Automotive Multifunction Switches Market Share and BPS Analysis by Country– 2019 & 2029

Figure 39: Latin America Automotive Multifunction Switches Market Y-o-Y Growth Projections by Country, 2019-2029

Figure 40: Latin America Automotive Multifunction Switches Market Attractiveness by Country, 2019-2029

Figure 41: Brazil Automotive Multifunction Switches Market Absolute $ Opportunity, 2018 – 2029

Figure 42: Automotive Multifunction Switches Market Absolute $ Opportunity (US$ Mn) by Region, 2019-2029

Figure 43: Mexico Automotive Multifunction Switches Market Absolute $ Opportunity, 2018 – 2029

Figure 44: Rest of Latin America Automotive Multifunction Switches Market Absolute $ Opportunity, 2018 – 2029

Figure 45: Latin America Automotive Multifunction Switches Market Share and BPS Analysis by Vehicle Type– 2019 & 2029

Figure 46: Latin America Automotive Multifunction Switches Market Y-o-Y Growth Projections by Vehicle Type, 2019-2029

Figure 47: Latin America Automotive Multifunction Switches Market Attractiveness by Vehicle Type, 2019-2029

Figure 48: Latin America & Oceania Automotive Multifunction Switches Market Share and BPS Analysis by Sales Channel– 2019 & 2029

Figure 49: Latin America & Oceania Automotive Multifunction Switches Market Y-o-Y Growth Projections by Sales Channel, 2019-2029

Figure 50: Latin America & Oceania Automotive Multifunction Switches Market Attractiveness by Sales Channel, 2019-2029

Figure 51: Europe Automotive Multifunction Switches Market Share and BPS Analysis by Country– 2019 & 2029

Figure 52: Europe Automotive Multifunction Switches Market Y-o-Y Growth Projections by Country, 2019-2029

Figure 53: Europe Automotive Multifunction Switches Market Attractiveness by Country, 2019-2029

Figure 54: Germany Automotive Multifunction Switches Market Absolute $ Opportunity, 2018 – 2029

Figure 55: France Automotive Multifunction Switches Market Absolute $ Opportunity, 2018 – 2029

Figure 56: U.K. Automotive Multifunction Switches Market Absolute $ Opportunity, 2018 – 2029

Figure 57: Spain Automotive Multifunction Switches Market Absolute $ Opportunity, 2017 – 2028

Figure 58: Italy Automotive Multifunction Switches Market Absolute $ Opportunity, 2017 – 2028

Figure 59: Russia Automotive Multifunction Switches Market Absolute $ Opportunity, 2017 – 2028

Figure 60: Poland Automotive Multifunction Switches Market Absolute $ Opportunity, 2017 – 2028

Figure 61: Rest of Europe Automotive Multifunction Switches Market Absolute $ Opportunity, 2017 – 2028

Figure 62: Europe Automotive Multifunction Switches Market Share and BPS Analysis by Vehicle Type– 2019 & 2029

Figure 63: Europe Automotive Multifunction Switches Market Y-o-Y Growth Projections by Vehicle Type, 2019-2029

Figure 64: Europe Automotive Multifunction Switches Market Attractiveness by Vehicle Type, 2019-2029

Figure 65: Europe Automotive Multifunction Switches Market Share and BPS Analysis by Sales Channel– 2019 & 2029

Figure 66: Europe Automotive Multifunction Switches Market Y-o-Y Growth Projections by Sales Channel, 2019-2029

Figure 67: Europe Automotive Multifunction Switches Market Attractiveness by Sales Channel, 2019-2029

Figure 68: East Asia & Oceania Automotive Multifunction Switches Market Share and BPS Analysis by Country– 2019 & 2019

Figure 69: East Asia & Oceania Automotive Multifunction Switches Market Y-o-Y Growth Projections by Country, 2019-2019

Figure 70: East Asia & Oceania Automotive Multifunction Switches Market Attractiveness by Country, 2019-2019

Figure 71: China Automotive Multifunction Switches Market Absolute $ Opportunity, 2018 – 2029

Figure 72: Japan Automotive Multifunction Switches Market Absolute $ Opportunity, 2018 – 2029

Figure 73: South Korea Automotive Multifunction Switches Market Absolute $ Opportunity, 2018 – 2029

Figure 74: East Asia Automotive Multifunction Switches Market Share and BPS Analysis by Vehicle Type– 2019 & 2029

Figure 75: East Asia Automotive Multifunction Switches Market Y-o-Y Growth Projections by Vehicle Type, 2019-2029

Figure 76: East Asia Automotive Multifunction Switches Market Attractiveness by Vehicle Type, 2019-2029

Figure 77: East Asia & Oceania Automotive Multifunction Switches Market Share and BPS Analysis by Sales Channel– 2019 & 2029

Figure 78: East Asia & Oceania Automotive Multifunction Switches Market Y-o-Y Growth Projections by Sales Channel, 2019-2029

Figure 79: East Asia & Oceania Automotive Multifunction Switches Market Attractiveness by Sales Channel, 2019-2029

Figure 80: South Asia Automotive Multifunction Switches Market Share and BPS Analysis by Country– 2019 & 2019

Figure 81: South Asia Automotive Multifunction Switches Market Y-o-Y Growth Projections by Country, 2019-2019

Figure 82: South Asia Automotive Multifunction Switches Market Attractiveness by Country, 2019-2019

Figure 83: India Automotive Multifunction Switches Market Absolute $ Opportunity, 2018 – 2029

Figure 84: ASEAN Countries Automotive Multifunction Switches Market Absolute $ Opportunity, 2018 – 2029

Figure 85: ANZ Automotive Multifunction Switches Market Absolute $ Opportunity, 2018 – 2029

Figure 86: Rest of South Asia Automotive Multifunction Switches Market Absolute $ Opportunity, 2018 – 2029

Figure 87: South Asia Automotive Multifunction Switches Market Share and BPS Analysis by Vehicle Type– 2019 & 2029

Figure 88: South Asia Automotive Multifunction Switches Market Y-o-Y Growth Projections by Vehicle Type, 2019-2029

Figure 89: South Asia Automotive Multifunction Switches Market Attractiveness by Vehicle Type, 2019-2029

Figure 90: South Asia Automotive Multifunction Switches Market Share and BPS Analysis by Sales Channel– 2019 & 2029

Figure 91: South Asia Automotive Multifunction Switches Market Y-o-Y Growth Projections by Sales Channel, 2019-2029

Figure 92: South Asia Automotive Multifunction Switches Market Attractiveness by Sales Channel, 2019-2029

Figure 93: Middle East & Africa Automotive Multifunction Switches Market Share and BPS Analysis by Country– 2019 & 2029

Figure 94: Middle East & Africa Automotive Multifunction Switches Market Y-o-Y Growth Projections by Country, 2019-2029

Figure 95: Middle East & Africa Automotive Multifunction Switches Market Attractiveness by Country, 2019-2029

Figure 96: South Africa Automotive Multifunction Switches Market Absolute $ Opportunity, 2018 – 2029

Figure 97: Turkey Automotive Multifunction Switches Market Absolute $ Opportunity, 2018 – 2029

Figure 98: Rest of MEA Automotive Multifunction Switches Market Absolute $ Opportunity, 2018 – 2029

Figure 99: Middle East & Africa Automotive Multifunction Switches Market Share and BPS Analysis by Vehicle Type– 2019 & 2029

Figure 100: Middle East & Africa Automotive Multifunction Switches Market Y-o-Y Growth Projections by Vehicle Type, 2019-2029

Figure 101: Middle East & Africa Automotive Multifunction Switches Market Attractiveness by Vehicle Type, 2019-2029

Figure 102: Middle East & Africa Automotive Multifunction Switches Market Share and BPS Analysis by Sales Channel– 2019 & 2029

Figure 103: Middle East & Africa Automotive Multifunction Switches Market Y-o-Y Growth Projections by Sales Channel, 2019-2029

Figure 104: Middle East & Africa Automotive Multifunction Switches Market Attractiveness by Sales Channel, 2019-2029

Figure 105: Emerging Markets Automotive Multifunction Switches Market Share by Country, 2019E

Figure 106: Global Automotive Multifunction Switches Market Share by Region, 2019E

Figure 107: Emerging Countries Automotive Multifunction Switches Market Y-o-Y Growth Projections, 2018-2029

Figure 108: Emerging Countries Market Share and BPS Analysis – 2019 & 2029

Figure 109: Automotive Multifunction Switches Market Structure

This site uses cookies, including third-party cookies, that help us to provide and improve our services. Privacy Policy
Google translate