

- Executive Summary
- Global Atherectomy Devices Market Snapshot, 2026 and 2033
- Market Opportunity Assessment, 2026 – 2033, US$ Mn
- Key Market Trends
- Future Market Projections
- Premium Market Insights
- Industry Developments and Key Market Events
- PMR Analysis and Recommendations
- Market Overview
- Market Scope and Definition
- Market Dynamics
- Drivers
- Restraints
- Opportunity
- Challenges
- Key Trends
- Macro-Economic Factors
- Global Sectorial Outlook
- Global GDP Growth Outlook
- COVID-19 Impact Analysis
- Forecast Factors – Relevance and Impact
- Value Added Insights
- Product Adoption Analysis
- Regulatory Landscape
- Value Chain Analysis
- Key Deals and Mergers
- PESTLE Analysis
- Porter’s Five Force Analysis
- Price Trend Analysis, 2020 – 2033
- Key Highlights
- Key Factors Impacting Product Prices
- Pricing Analysis, By Device Type
- Regional Prices and Product Preferences
- Global Atherectomy Devices Market Outlook:
- Key Highlights
- Market Volume (Units) Projections
- Market Size (US$ Mn) and Y-o-Y Growth
- Absolute $ Opportunity
- Market Size (US$ Mn) Analysis and Forecast
- Historical Market Size (US$ Mn) Analysis, 2020-2025
- Market Size (US$ Mn) Analysis and Forecast, 2026–2033
- Global Atherectomy Devices Market Outlook: Device Type
- Introduction / Key Findings
- Historical Market Size (US$ Mn) and Volume (Units) Analysis, By Device Type, 2020-2025
- Market Size (US$ Mn) and Volume (Units) Analysis and Forecast, By Device Type, 2026–2033
- Directional Atherectomy
- Rotational Atherectomy
- Orbital Atherectomy
- Laser Atherectomy
- Market Attractiveness Analysis: Device Type
- Global Atherectomy Devices Market Outlook: Indication
- Introduction / Key Findings
- Historical Market Size (US$ Mn) Analysis, By Indication, 2020-2025
- Market Size (US$ Mn) Analysis and Forecast, By Indication, 2026–2033
- Coronary Artery Diseases
- Peripheral Artery Diseases
- Others
- Market Attractiveness Analysis: Indication
- Global Atherectomy Devices Market Outlook: End User
- Introduction / Key Findings
- Historical Market Size (US$ Mn) Analysis, By End User, 2020-2025
- Market Size (US$ Mn) Analysis and Forecast, By End User, 2026–2033
- Hospitals
- Ambulatory Surgical Centers (ASCs)
- Research Laboratories & Academic Institutes
- Others
- Market Attractiveness Analysis: End User
- Key Highlights
- Global Atherectomy Devices Market Outlook: Region
- Key Highlights
- Historical Market Size (US$ Mn) and Volume (Units) Analysis, By Region, 2020-2025
- Market Size (US$ Mn) and Volume (Units) Analysis and Forecast, By Region, 2026–2033
- North America
- Europe
- East Asia
- South Asia and Oceania
- Latin America
- Middle East & Africa
- Market Attractiveness Analysis: Region
- North America Atherectomy Devices Market Outlook:
- Key Highlights
- Historical Market Size (US$ Mn) and Volume (Units) Analysis, By Market, 2020-2025
- By Country
- By Device Type
- By Indication
- By End User
- Market Size (US$ Mn) Analysis and Forecast, By Country, 2026–2033
- U.S.
- Canada
- Market Size (US$ Mn) and Volume (Units) Analysis and Forecast, By Device Type, 2026–2033
- Directional Atherectomy
- Rotational Atherectomy
- Orbital Atherectomy
- Laser Atherectomy
- Market Size (US$ Mn) Analysis and Forecast, By Indication, 2026–2033
- Coronary Artery Diseases
- Peripheral Artery Diseases
- Others
- Market Size (US$ Mn) Analysis and Forecast, By End User, 2026–2033
- Hospitals
- Ambulatory Surgical Centers (ASCs)
- Research Laboratories & Academic Institutes
- Others
- Market Attractiveness Analysis
- Europe Atherectomy Devices Market Outlook:
- Key Highlights
- Historical Market Size (US$ Mn) and Volume (Units) Analysis, By Market, 2020-2025
- By Country
- By Device Type
- By Indication
- By End User
- Market Size (US$ Mn) Analysis and Forecast, By Country, 2026–2033
- Germany
- France
- U.K.
- Italy
- Spain
- Russia
- Rest of Europe
- Market Size (US$ Mn) and Volume (Units) Analysis and Forecast, By Device Type, 2026–2033
- Directional Atherectomy
- Rotational Atherectomy
- Orbital Atherectomy
- Laser Atherectomy
- Market Size (US$ Mn) Analysis and Forecast, By Indication, 2026–2033
- Coronary Artery Diseases
- Peripheral Artery Diseases
- Others
- Market Size (US$ Mn) Analysis and Forecast, By End User, 2026–2033
- Hospitals
- Ambulatory Surgical Centers (ASCs)
- Research Laboratories & Academic Institutes
- Others
- Market Attractiveness Analysis
- East Asia Atherectomy Devices Market Outlook:
- Key Highlights
- Historical Market Size (US$ Mn) and Volume (Units) Analysis, By Market, 2020-2025
- By Country
- By Device Type
- By Indication
- By End User
- Market Size (US$ Mn) Analysis and Forecast, By Country, 2026–2033
- China
- Japan
- South Korea
- Market Size (US$ Mn) and Volume (Units) Analysis and Forecast, By Device Type, 2026–2033
- Directional Atherectomy
- Rotational Atherectomy
- Orbital Atherectomy
- Laser Atherectomy
- Market Size (US$ Mn) Analysis and Forecast, By Indication, 2026–2033
- Coronary Artery Diseases
- Peripheral Artery Diseases
- Others
- Market Size (US$ Mn) Analysis and Forecast, By End User, 2026–2033
- Hospitals
- Ambulatory Surgical Centers (ASCs)
- Research Laboratories & Academic Institutes
- Others
- Market Attractiveness Analysis
- South Asia & Oceania Atherectomy Devices Market Outlook:
- Key Highlights
- Historical Market Size (US$ Mn) and Volume (Units) Analysis, By Market, 2020-2025
- By Country
- By Device Type
- By Indication
- By End User
- Market Size (US$ Mn) Analysis and Forecast, By Country, 2026–2033
- India
- Southeast Asia
- ANZ
- Rest of South Asia & Oceania
- Market Size (US$ Mn) and Volume (Units) Analysis and Forecast, By Device Type, 2026–2033
- Directional Atherectomy
- Rotational Atherectomy
- Orbital Atherectomy
- Laser Atherectomy
- Market Size (US$ Mn) Analysis and Forecast, By Indication, 2026–2033
- Coronary Artery Diseases
- Peripheral Artery Diseases
- Others
- Market Size (US$ Mn) Analysis and Forecast, By End User, 2026–2033
- Hospitals
- Ambulatory Surgical Centers (ASCs)
- Research Laboratories & Academic Institutes
- Others
- Market Attractiveness Analysis
- Latin America Atherectomy Devices Market Outlook:
- Key Highlights
- Historical Market Size (US$ Mn) and Volume (Units) Analysis, By Market, 2020-2025
- By Country
- By Device Type
- By Indication
- By End User
- Market Size (US$ Mn) Analysis and Forecast, By Country, 2026–2033
- Brazil
- Mexico
- Rest of Latin America
- Market Size (US$ Mn) and Volume (Units) Analysis and Forecast, By Device Type, 2026–2033
- Directional Atherectomy
- Rotational Atherectomy
- Orbital Atherectomy
- Laser Atherectomy
- Market Size (US$ Mn) Analysis and Forecast, By Indication, 2026–2033
- Coronary Artery Diseases
- Peripheral Artery Diseases
- Others
- Market Size (US$ Mn) Analysis and Forecast, By End User, 2026–2033
- Hospitals
- Ambulatory Surgical Centers (ASCs)
- Research Laboratories & Academic Institutes
- Others
- Market Attractiveness Analysis
- Middle East & Africa Atherectomy Devices Market Outlook:
- Key Highlights
- Historical Market Size (US$ Mn) and Volume (Units) Analysis, By Market, 2020-2025
- By Country
- By Device Type
- By Indication
- By End User
- Market Size (US$ Mn) Analysis and Forecast, By Country, 2026–2033
- GCC Countries
- Egypt
- South Africa
- Northern Africa
- Rest of Middle East & Africa
- Market Size (US$ Mn) and Volume (Units) Analysis and Forecast, By Device Type, 2026–2033
- Directional Atherectomy
- Rotational Atherectomy
- Orbital Atherectomy
- Laser Atherectomy
- Market Size (US$ Mn) Analysis and Forecast, By Indication, 2026–2033
- Coronary Artery Diseases
- Peripheral Artery Diseases
- Others
- Market Size (US$ Mn) Analysis and Forecast, By End User, 2026–2033
- Hospitals
- Ambulatory Surgical Centers (ASCs)
- Research Laboratories & Academic Institutes
- Others
- Market Attractiveness Analysis
- Competition Landscape
- Market Share Analysis, 2025
- Market Structure
- Competition Intensity Mapping By Market
- Competition Dashboard
- Company Profiles (Details – Overview, Financials, Strategy, Recent Developments)
- Medtronic
- Overview
- Segments and Product Types
- Key Financials
- Market Developments
- Market Strategy
- Abbott
- Boston Scientific Corporation
- Terumo Medical Corporation
- Cardiovascular Systems, Inc.
- Koninklijke Philips N.V.
- Cordis
- Avinger
- BD
- Others
- Medtronic
- Appendix
- Research Methodology
- Research Assumptions
- Acronyms and Abbreviations


- Medical Devices
- Global Atherectomy Devices Market
Global Atherectomy Devices Market Size, Share, Growth, and Regional Forecast, 2026 to 2033
Atherectomy Devices Market by Device Type (Directional Atherectomy, Rotational Atherectomy, Orbital Atherectomy, Laser Atherectomy), Indication (Coronary Artery Diseases, Peripheral Artery Diseases, Others), End User (Hospitals, Ambulatory Surgical Centers (ASCs), Research Laboratories & Academic Institutes, Others), and Regional Analysis from 2026 to 2033
Atherectomy Devices Market Size and Trends Analysis
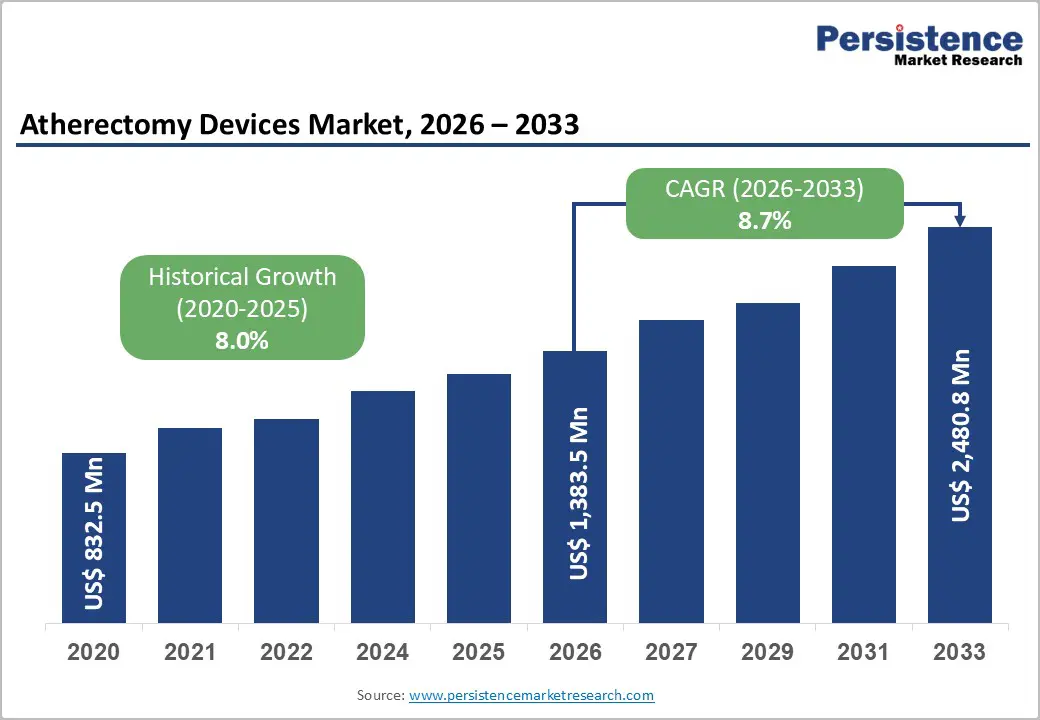
The global atherectomy devices market is estimated to grow from US$ 1,383.5 Mn in 2026 to US$ 2,480.8 Mn by 2033. The market is projected to record a CAGR of 8.7% during the forecast period from 2026 to 2033.
The global atherectomy devices market is expanding steadily due to rising cardiovascular disease prevalence, emergency admissions, and demand for precise interventions. North America dominates with advanced healthcare infrastructure and early technology adoption. Asia-Pacific is the fastest-growing region, driven by expanding facilities, increasing patient volumes, improved access, and growing awareness of early diagnosis and treatment.
Key Industry Highlights
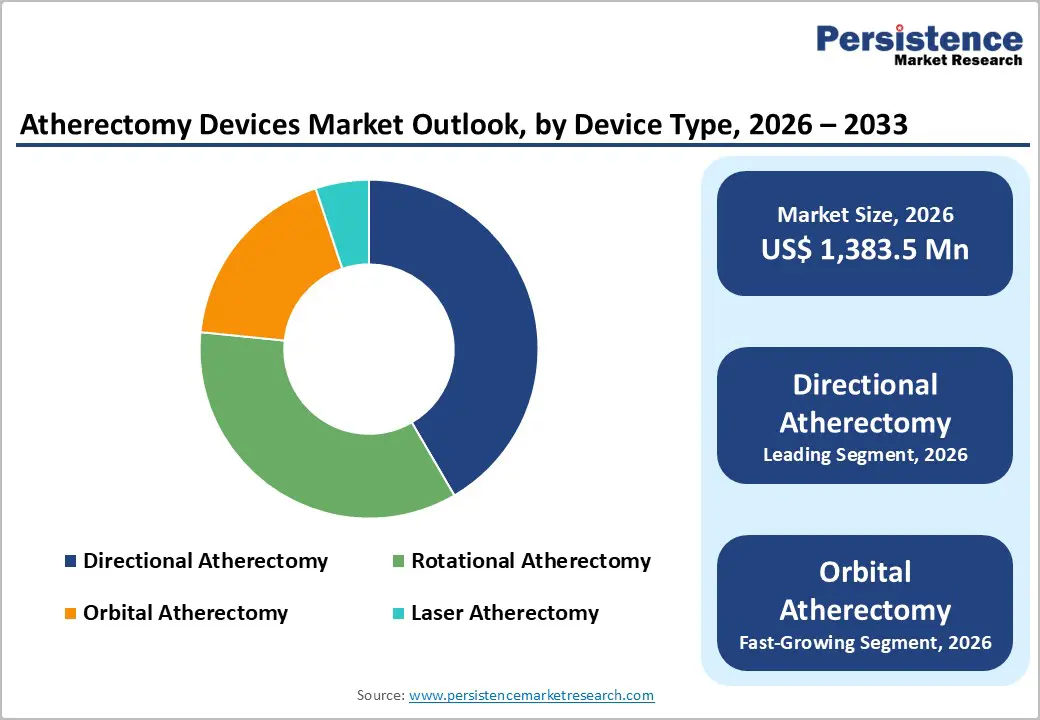
- Dominant Segment: Directional atherectomy devices account for the largest share of the market in 2025 with 41.6% share, driven by broad clinical use, procedural versatility, high success rates, and compatibility with both peripheral and coronary interventions. Adoption is supported across hospitals, surgical centers, and specialty vascular clinics.
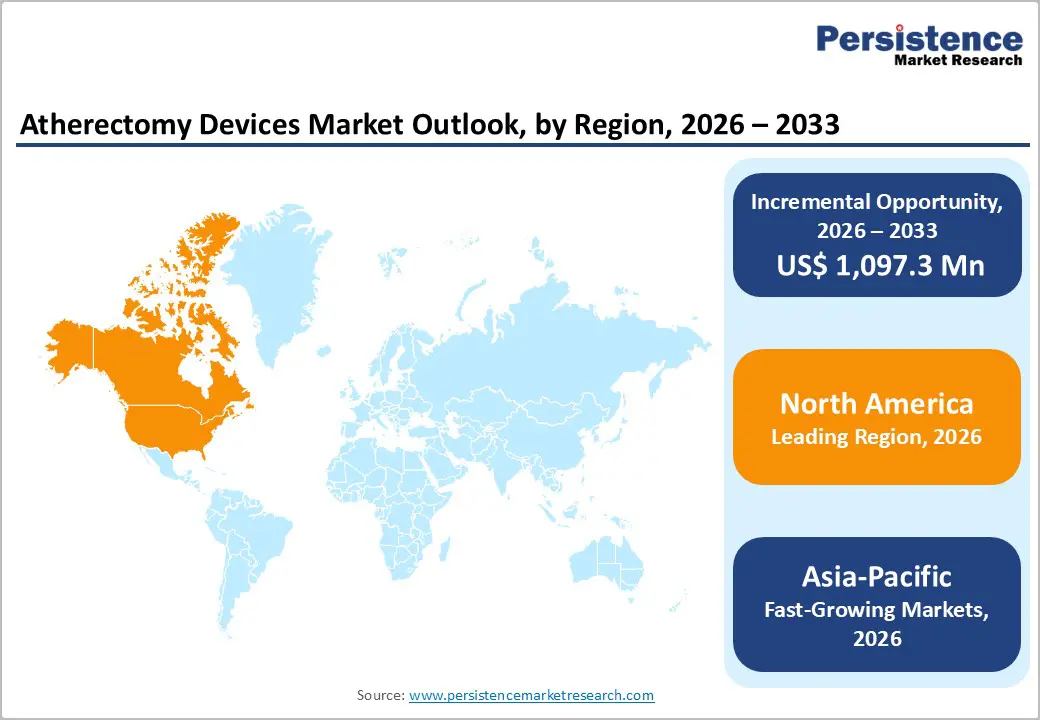
- Dominant Region: North America leads with 42.4% share in 2025, supported by advanced healthcare infrastructure, early adoption of interventional technologies, and high procedural volume. Asia-Pacific is the fastest-growing region, fueled by expanding facilities, rising patient prevalence, improved access, and growing awareness of early diagnosis and treatment.
- Market Drivers: Growth is fueled by increasing prevalence of peripheral and coronary artery diseases, rising emergency and critical care interventions, demand for precise plaque removal, minimally invasive procedures, and technological innovations in atherectomy systems.
- Market Opportunity: Key opportunities lie in orbital and laser atherectomy devices, integration with imaging guidance (IVUS/OCT), portable catheter-based systems, expanding PAD interventions, and growing adoption in emerging economies with improving healthcare infrastructure.
| Global Market Attributes | Key Insights |
|---|---|
| Global Atherectomy Devices Market Size (2026E) | US$ 1,383.5 Mn |
| Market Value Forecast (2033F) | US$ 2,480.8 Mn |
| Projected Growth (CAGR 2026 to 2033) | 8.7% |
| Historical Market Growth (CAGR 2020 to 2025) | 8.0% |
Market Dynamics
Driver: Rising prevalence of coronary and peripheral artery diseases globally
Coronary artery disease (CAD) remains a major health burden worldwide, representing a significant portion of cardiovascular disease morbidity and mortality. According to the Global Burden of Disease estimates, CAD affected approximately 154 million people globally in 2016, accounting for about one third of all cardiovascular disease burden and 2.2% of the overall global disease burden. In the United States alone, American Heart Association data indicate that an estimated 7.6 % of men and 5.0 % of women were living with CAD during 2009–2012, underscoring continued high prevalence in developed regions. Early detection and catheter based interventions are critical, as CAD often leads to myocardial infarction and complications requiring advanced interventional tools like atherectomy devices.
Peripheral artery disease (PAD), another major atherosclerotic condition, is also increasing in absolute case numbers across the globe. Global estimates from 2019 show that over 113 million individuals were living with PAD, a more than 70 % increase since 1990, despite shifts in age standardized rates. PAD prevalence rises markedly with age and is associated with diabetes, smoking, and hypertension conditions that also drive CAD risk. The growing absolute burden of PAD, particularly in aging populations, elevates demand for precise revascularization procedures such as atherectomy, which can improve limb perfusion and reduce complications from critical limb ischemia.
Restraints: High cost of atherectomy devices and associated procedural expenses
Atherectomy procedures are significantly more expensive than traditional angioplasty or stent based interventions, creating a financial barrier in many healthcare systems. Peer reviewed hospital data show that the mean in hospital cost for coronary atherectomy was about $9,345 versus $7,301 for standard angioplasty, representing a roughly 28 % higher cost primarily due to device and supply expenses. This increase is driven by the need for multiple specialized devices per procedure and additional imaging or support technologies. Such higher procedural costs can deter adoption, especially where comparative cost effectiveness is not well established in clinical guidelines.
In the United States, official reimbursement data reflect this cost differential: Medicare outpatient reimbursement rates for atherectomy procedures (e.g., ~$11,341 for percutaneous atherectomy with angioplasty) are substantially above typical angioplasty payments, which adds financial pressure on healthcare providers to justify the higher expenses. Additionally, physicians in office based settings may receive much higher reimbursement for atherectomy than angioplasty (e.g., over $12,000 versus a few hundred dollars in hospitals under older Medicare data), highlighting the complex reimbursement landscape that can incentivize use but also increases overall health system costs. These financial dynamics restrict broader adoption in cost sensitive environments and place emphasis on reimbursement policy reform to align procedural value with expenditures.
Opportunity: Development of orbital and laser atherectomy devices for complex lesions
Orbiting atherectomy systems have emerged as a key technology for managing severely calcified coronary artery lesions, which are poorly responsive to standard balloon angioplasty alone. Clinical evidence shows that in patients with heavy calcification, orbital atherectomy facilitates lesion modification and successful stent delivery, with procedural success rates over 90 % in early investigational studies and low major adverse cardiac event rates at 30 days. These devices are particularly useful for calcified, bifurcation, and other complex coronary anatomies where traditional approaches often fail, underscoring their value in advanced lesion preparation.
Laser atherectomy also represents an important opportunity for complex lesion treatment by using ultraviolet light to vaporize plaque and thrombotic material, which can be difficult to address with purely mechanical devices. Excimer laser systems have shown high device and procedural success rates (around 94 % in some studies) even in challenging scenarios such as chronic total occlusions and balloon resistant plaques, helping improve vessel patency and facilitate subsequent interventions. Their unique tissue specific action and compatibility with standard guidewires make them valuable in cases of non crossable or heavily calcified lesions, expanding clinical utility beyond conventional atherectomy.
Category-wise Analysis
By Device Type, Directional Atherectomy Dominates the Atherectomy Devices Market
Directional Atherectomy occupies 41.6% share of the global market in 2025, because of its versatility and procedural effectiveness in removing atheromatous plaque across a broad range of arterial lesions. Directional systems use a cutting blade within a housing to selectively excise plaque while preserving healthy vessel tissue, enabling precise plaque “debulking” and improved vessel preparation prior to adjunctive treatments such as balloon angioplasty or drug coated balloons. Clinical registries demonstrate high procedural success rates (often exceeding 85–90 %) and favorable long term vascular patency, especially in peripheral arteries treated for PAD, which contributes to clinician preference and widespread use. Directional devices are also effective for eccentric and bulky plaques where other atherectomy types may be less applicable or require adjunctive technology, reinforcing their broad clinical adoption and leading market share.
By Indication, Peripheral Artery Diseases dominates due to high prevalence, aging population, and procedural necessity
Peripheral artery disease (PAD) dominates the atherectomy devices market because it affects a large and growing global population and often requires endovascular intervention. In 2019, over 113 million people worldwide were estimated to have PAD, a significant rise from 1990, with prevalence increasing sharply with age, 15–20 % of those over 80 years are affected, and more than 8 million Americans aged 40+ live with PAD. PAD frequently leads to impaired blood flow, leg pain, and critical limb ischemia, making minimally invasive procedures like atherectomy essential. These devices effectively remove plaque and restore perfusion, improving clinical outcomes and quality of life. The combination of high disease burden and procedural necessity explains PAD’s dominant share in the atherectomy market.
Regional Insights
North America Atherectomy Devices Market Trends
North America dominates the atherectomy devices market with 42.4% share in 2025, because of its high burden of cardiovascular and peripheral artery diseases, advanced healthcare infrastructure, and strong adoption of interventional technologies. In the United States, about 127.9 million adults had some form of cardiovascular disease between 2017–2020, making CVD a leading health challenge and driving demand for advanced vascular interventions.Additionally, regions with high socio demographic index, such as North America, had the highest age standardized PAD prevalence at ~2486.5 per 100,000 person years, underscoring substantial procedural need. Strong reimbursement policies, widespread access to cath labs, and early uptake of innovative atherectomy technologies further reinforce regional leadership, as hospitals and specialty centers prioritize minimally invasive treatment options for complex arterial disease.
Europe Atherectomy Devices Market Trends
Europe is an important region in the atherectomy devices market because it bears a high burden of peripheral and coronary artery diseases and has well established interventional care infrastructure. Epidemiological data indicate that peripheral arterial disease prevalence in Europe can be as high as ~17.8 % among middle aged adults (45–55 years) in some studies, reflecting substantial clinical demand for endovascular interventions.Additionally, age standardized PAD prevalence rates in Western Europe exceed 1800–1900 per 100,000 people, illustrating a large patient base requiring advanced vascular care. Europe also has a strong network of interventional cardiology and vascular specialists and significant procedural volumes across Germany, France, the UK, and Italy, which supports the adoption of atherectomy technologies in routine practice.
Asia-Pacific Atherectomy Devices Market Trends
Asia Pacific is the fastest growing region in the atherectomy devices market because of its rapidly rising burden of cardiovascular diseases, expanding healthcare infrastructure, and increasing access to advanced interventions. Asia accounts for a major share of global CVD mortality and prevalence, with 270 million disability adjusted life years and 12 million deaths due to cardiovascular disease in 2021, representing about 61 % of global CVD mortality, highlighting immense clinical demand.Furthermore, peripheral artery disease prevalence in the region ranges from 5 % to over 12 % across countries, with even higher rates among diabetic populations, signaling widespread unmet vascular care needs. Governments and hospitals in China, India, and Japan are rapidly building interventional capacities and adopting advanced procedures to address this rising disease burden, accelerating market growth.
Market Competitive Landscape
The atherectomy devices market is competitive, led by global and regional players offering directional, rotational, orbital, and laser systems. Companies focus on device reliability, safety, procedural efficiency, and regulatory compliance. Innovation in minimally invasive, imaging-integrated, and portable atherectomy technologies, along with strategic partnerships and regional expansion, intensifies competition and drives differentiation across global vascular intervention markets.
Key Industry Developments:
- In December 2025, Medtronic announced that its Liberant thrombectomy system was used commercially for the first time at The Mount Sinai Hospital in New York by vascular surgeon Dr. Ajit Rao. The system, cleared by the U.S. FDA for removing fresh, soft emboli or thrombi from peripheral arterial and venous vessels, expanded Medtronic’s portfolio to include mechanical aspiration thrombectomy.
- In March 2025, Abbott received approval from the U.S. Food and Drug Administration to begin a clinical trial of its intravascular lithotripsy (IVL) system designed to treat severe calcification in coronary arteries prior to stenting.
Companies Covered in Global Atherectomy Devices Market
- Medtronic
- Abbott
- Boston Scientific Corporation
- Terumo Medical Corporation
- Cardiovascular Systems, Inc.
- Koninklijke Philips N.V.
- Cordis
- Avinger
- BD
- Others
Frequently Asked Questions
The global atherectomy devices market is projected to be valued at US$ 1,383.5 Mn in 2026.
Rising cardiovascular and peripheral artery disease prevalence, minimally invasive procedures, and technological advancements drive growth.
The global atherectomy devices market is poised to witness a CAGR of 8.7% between 2026 and 2033.
Expansion in Asia-Pacific, orbital and laser devices, imaging integration, PAD interventions, and portable systems.
Medtronic, Abbott, Boston Scientific Corporation, Terumo Medical Corporation, Cardiovascular Systems, Inc., Koninklijke Philips N.V.


