Asia Pacific Peracetic Acid Market

Asia Pacific Market Study on Peracetic Acid: Increasing Demand for Agrochemicals in the Agriculture Sector Anticipated to Drive Demand for Peracetic Acid

ID: PMRREP12955
Calendar

January 2017

148 Pages

Author : Swapnil Chavan

PreviewSegmentation

End use segment is anticipated to play a crucial role in the expansion of the Asia Pacific Peracetic Acid market

Growing demand for peracetic acid owing to its strong bleaching and disinfecting characteristics has made it a superior substitute to other chemicals available in the market. Peracetic acid degrades into oxygen, carbon dioxide and water which makes it an ecofriendly product. These core characteristics of the chemical and rising concerns over environmental issues is expected to fuel the Asia Pacific Peracetic Acid market.

Sales of peracetic acid reached a value of more than US$ 82.3 Mn in 2015 and are anticipated to increase at a CAGR of 8.2% over the forecast period and are likely to cross US$ 164.2 Mn by 2024 end. Peracetic acid (PAA) offers high efficiency as a bleaching and disinfecting agent compared to other substitutes available in the market.

The food and beverage section of the Asia Pacific peracetic acid market is anticipated to expand at a CAGR of 9.1%. Agrochemicals, others and detergent segments are expected to record healthy CAGRs within the foreseen period.

The EPA (Environmental Protection Agency) has exempted the residual value of peracetic acid in the food and beverage industry as it breaks down into water, oxygen and carbon dioxide. EPA operates actively in countries such as China, Indonesia, India, Australia, Japan, Korea and Singapore. Peracetic acid is one of the chemical disinfectants used to kill pathogens and decompose the organic of medical waste. Peracetic acid market insight can deal with pathological waste and drug waste as well. These qualities of the chemical are likely to impact the market expansion of the Asia Pacific peracetic acid market.

End use segment: Industry forecast

In the end use segment the food and beverage industry is likely to account for more than 26% value share by the end of the current year. It is expected to gain 210 BPS by the end of the assessment period. The others segment including dairy products, household cleaning solutions and cosmetics is projected to lose 10 BPS over the forecast period. Agrochemical end-use segment is projected to observe a slow growth over the period of forecast. The Y-O-Y growth rate by end-use shows an in-depth picture of the Asia Pacific Peracetic Acid market. Food and beverage industry in the end use segment is likely to progress rapidly during the forecast period.

Agrochemical industry is likely to witness a significant surge till 2020, but the upward march of this segment will take a nose dive by the end of the period of assessment. Others segment is also fated to witness progress and this segment will grow at a collective rate of more than 13% by the end of 2024.

Food & beverage segment is anticipated to incline toward high value–high growth during 2016–2024. This is mainly attributed to increasing demand for aseptic packaging for food products and beverages. Increasing demand for agrochemicals in the agriculture sector is expected to drive the demand for peracetic acid. The agrochemical segment is estimated to incline towards high value–high growth during 2016–2024. Water treatment segment is likely to incline towards high value–low growth during 2016–2024.

asia pacific per acetic acid market

Country-wise comparative study of the end use segment

The food and beverage segment in the China PAA market is expected to gain more than 200 BPS within the period of forecast. Lenient government regulations and bulk production is predicted to expedite the peracetic acid market growth in China. Agrochemical industry will showcase a fairly moderate growth in the dragon economy as it might lose more than 55 BPS over the forecast period.

Owing to a robust agro-based economy, the agrochemical segment in India was expected to soar till the end of 2016, but the market might lose more than 45 BPS within the period of forecast. Others segment is predicted to continue its growth march in the Indian market, while the water treatment segment is projected to incline towards high value-low growth during the forecast period for decreasing use of peracetic acid as a disinfectant solution in the near future. In Japan’s peracetic acid market the others segment will probably witness good growth and is expected to gain more than 8BPS by the end of the forecast period.  

In ASEAN countries the others segment is anticipated to incline towards high value-high growth followed by the food and beverage segment during the forecast period. In Australia and New Zealand, the food and beverage segment is likely to gain more than 145 BPS over the period of forecast. In the rest of Asia Pacific, the food and beverage segment is projected to emerge as the largest market segment with high growth.

Companies Covered in Asia Pacific Peracetic Acid Market

  • Evonik Industries AG
  • Kemira Oyj
  • PeroxyChem LLC
  • Mitsubishi Gas Chemical Company Inc.
  • National Peroxide Limited
  • Solvay Peroxythai Ltd.
  • Qingdao Hiseachem Co., Ltd
  • Tianjin Xinyuan Chemical Co.,Ltd.
  • Aditya Birla Chemicals Limited
  • MGI Chemicals Pvt. Ltd.
  • Acuro Organics Limited
  • Others
Asia Pacific Peracetic Acid Market: Market Segmentation
Attribute Details

By Grade

  • PAA- Below 5%
    • H2O2 (< 20%)
    • H2O2 (>20%)
  • PAA- 5% to 15%
    • H2O2 (< 20%)
    • H2O2 (>20%)
  • PAA- above 15%
    • H2O2 (< 20%)
    • H2O2 (>20%)

By Countries

  • China
  • India
  • Japan
  • ASEAN Countries
  • Australia & New Zealand
  • Rest of Asia Pacific

By End Use

  • Agrochemical
  • Detergent
  • Food & Beverage
  • Water Treatment
  • Textiles
  • Others

Related Reports

1. Executive Summary

2. Asia Pacific Peracetic Acid Market Introduction

    2.1. Market Definition

    2.2. Market Taxonomy

    2.3. Parent / Associated Market Overview

3. Asia Pacific Peracetic Acid Market Analysis Scenario

    3.1. Market size (US$ Mn) and Volume (Tonnes) Analysis

        3.1.1. Market size and Y-o-Y Growth

        3.1.2. Absolute $ Opportunity

    3.2. Market Size (US$ Mn) and Forecast

        3.2.1. Market Size and Y-o-Y Growth

        3.2.2. Absolute $ Opportunity

    3.3. Market Overview

        3.3.1. Pricing Analysis

        3.3.2. Value Chain

4. Market Dynamics

    4.1. Drivers

        4.1.1. Supply Side

        4.1.2. Demand Side

    4.2. Restraints

    4.3. Opportunity

    4.4. Trends

5. Asia Pacific Peracetic Acid Market Analysis and Forecast, By Grade

    5.1. Introduction

        5.1.1. Basis Point Share (BPS) Analysis By Grade

        5.1.2. Y-o-Y Growth Projections By Grade

    5.2. Market Size (US$ Mn) and Volume (Tonnes) Forecast By Grade

        5.2.1. PAA- below 5%

            5.2.1.1. H2O2 - Low (≤ 20% conc.)

            5.2.1.2. H2O2 - High (> 20% conc.)

        5.2.2. PAA- 5% to 15%

            5.2.2.1. H2O2 - Low (≤ 20% conc.)

            5.2.2.2. H2O2 - High (> 20% conc.)

        5.2.3. PAA- above 15%

            5.2.3.1. H2O2 - Low (≤ 20% conc.)

            5.2.3.2. H2O2 - High (> 20% conc.)

    5.3. Market Attractiveness Analysis By Grade

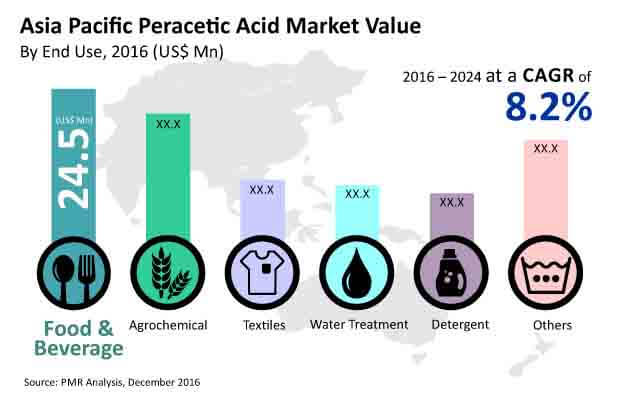
6. Asia Pacific Peracetic Acid Market Analysis and Forecast, By End Use

    6.1. Introduction

        6.1.1. Basis Point Share (BPS) Analysis By End Use

        6.1.2. Y-o-Y Growth Projections By End Use

    6.2. Market Size (US$ Mn) and Volume (Tonnes) Forecast By End Use

        6.2.1. Agrochemical

        6.2.2. Detergent

        6.2.3. Food & Beverage

        6.2.4. Water Treatment

        6.2.5. Textiles

        6.2.6. Other (Dairy, Household,etc.)

    6.3. Market Attractiveness Analysis By End Use

7. Asia Pacific Peracetic Acid Market Analysis and Forecast, By Country

    7.1. Introduction

        7.1.1. Basis Point Share (BPS) Analysis By Country

        7.1.2. Y-o-Y Growth Projections By Country

    7.2. Market Size (US$ Mn) and Volume (Tonnes) Forecast By Country

        7.2.1. China

        7.2.2. India

        7.2.3. Japan

        7.2.4. ASEAN Countries

        7.2.5. Australia & New Zealand

        7.2.6. Rest of Asia Pacific

    7.3. Market Attractiveness Analysis By Country

8. China Peracetic Acid Market Analysis and Forecast

    8.1. Introduction

        8.1.1. Basis Point Share (BPS) Analysis

        8.1.2. Y-o-Y Growth Projections

    8.2. Market Size (US$ Mn) and Volume (Tonnes) Forecast By Grade

        8.2.1. PAA- below 5%

            8.2.1.1. H2O2 -Low (≤ 20% conc.)

            8.2.1.2. H2O2 -High (> 20% conc.)

        8.2.2. PAA- 5% to 15%

            8.2.2.1. H2O2 -Low (≤ 20% conc.)

            8.2.2.2. H2O2 -High (> 20% conc.)

        8.2.3. PAA- above 15%

            8.2.3.1. H2O2 -Low (≤ 20% conc.)

            8.2.3.2. H2O2 -High (> 20% conc.)

    8.3. Market Size (US$ Mn) and Volume (Tonnes) Forecast By End Use

        8.3.1. Agrochemical

        8.3.2. Detergent

        8.3.3. Food & Beverage

        8.3.4. Water Treatment

        8.3.5. Textiles

        8.3.6. Other (Dairy, Household,etc.)

    8.4. Market Attractiveness Analysis

    8.5. Drivers and Restraints: Impact Analysis

9. India Peracetic Acid Market Analysis and Forecast

    9.1. Introduction

        9.1.1. Basis Point Share (BPS) Analysis

        9.1.2. Y-o-Y Growth Projections

    9.2. Market Size (US$ Mn) and Volume (Tonnes) Forecast By Grade

        9.2.1. PAA- below 5%

            9.2.1.1. H2O2 -Low (≤ 20% conc.)

            9.2.1.2. H2O2 -High (> 20% conc.)

        9.2.2. PAA- 5% to 15%

            9.2.2.1. H2O2 -Low (≤ 20% conc.)

            9.2.2.2. H2O2 -High (> 20% conc.)

        9.2.3. PAA- above 15%

            9.2.3.1. H2O2-Low (≤ 20% conc.)

            9.2.3.2. H2O2 -High (> 20% conc.)

    9.3. Market Size (US$ Mn) and Volume (Tonnes) Forecast By End Use

        9.3.1. Agrochemical

        9.3.2. Detergent

        9.3.3. Food & Beverage

        9.3.4. Water Treatment

        9.3.5. Textiles

        9.3.6. Other (Dairy, Household,etc.)

    9.4. Market Attractiveness Analysis

    9.5. Drivers and Restraints: Impact Analysis

10. Japan Peracetic Acid Market Analysis and Forecast

    10.1. Introduction

        10.1.1. Basis Point Share (BPS) Analysis

        10.1.2. Y-o-Y Growth Projections

    10.2. Market Size (US$ Mn) and Volume (Tonnes) Forecast By Grade

        10.2.1. PAA- below 5%

            10.2.1.1. H2O2 -Low (≤ 20% conc.)

            10.2.1.2. H2O2 -High (> 20% conc.)

        10.2.2. PAA- 5% to 15%

            10.2.2.1. H2O2 -Low (≤ 20% conc.)

            10.2.2.2. H2O2 -High (> 20% conc.)

        10.2.3. PAA- above 15%

            10.2.3.1. H2O2 -Low (≤ 20% conc.)

            10.2.3.2. H2O2 -High (> 20% conc.)

    10.3. Market Size (US$ Mn) and Volume (Tonnes) Forecast By End Use

        10.3.1.  Agrochemical

        10.3.2. Detergent

        10.3.3. Food & Beverage

        10.3.4. Water Treatment

        10.3.5. Textiles

        10.3.6. Other (Dairy, Household,etc.)

    10.4. Market Attractiveness Analysis

        10.4.1. By Grade

        10.4.2. By End Use

    10.5. Drivers and Restraints: Impact Analysis

11. ASEAN Countries Peracetic Acid Market Analysis and Forecast

    11.1. Introduction

        11.1.1. Basis Point Share (BPS) Analysis

        11.1.2. Y-o-Y Growth Projections

    11.2. Market Size (US$ Mn) and Volume (Tonnes) Forecast By Grade

        11.2.1. PAA- below 5%

            11.2.1.1. H2O2 -Low (≤ 20% conc.)

            11.2.1.2. H2O2 -High (> 20% conc.)

        11.2.2. PAA- 5% to 15%

            11.2.2.1. H2O2 -Low (≤ 20% conc.)

            11.2.2.2. H2O2 -High (> 20% conc.)

        11.2.3. PAA- above 15%

            11.2.3.1. H2O2 -Low (≤ 20% conc.)

            11.2.3.2. H2O2 -High (> 20% conc.)

    11.3. Market Size (US$ Mn) and Volume (Tonnes) Forecast By End Use

        11.3.1. Agrochemical

        11.3.2. Detergent

        11.3.3. Food & Beverage

        11.3.4. Water Treatment

        11.3.5. Textiles

        11.3.6. Other (Dairy, Household,etc.)

    11.4. Market Attractiveness Analysis

        11.4.1. By Grade

        11.4.2. By End Use

    11.5. Drivers and Restraints: Impact Analysis

12. Australia & New Zealand Peracetic Acid Market Analysis and Forecast

    12.1. Introduction

        12.1.1. Basis Point Share (BPS) Analysis

        12.1.2. Y-o-Y Growth Projections

    12.2. Market Size (US$ Mn) and Volume (Tonnes) Forecast By Grade

        12.2.1. PAA- below 5%

            12.2.1.1. H2O2 -Low (≤ 20% conc.)

            12.2.1.2. H2O2 -High (> 20% conc.)

        12.2.2. PAA- 5% to 15%

            12.2.2.1. H2O2 -Low (≤ 20% conc.)

            12.2.2.2. H2O2 -High (> 20% conc.)

        12.2.3. PAA- above 15%

            12.2.3.1. H2O2 -Low (≤ 20% conc.)

            12.2.3.2. H2O2 -High (> 20% conc.)

    12.3. Market Size (US$ Mn) and Volume (Tonnes) Forecast By End Use

        12.3.1. Agrochemical

        12.3.2. Detergent

        12.3.3. Food & Beverage

        12.3.4. Water Treatment

        12.3.5. Textiles

        12.3.6. Other (Dairy, Household,etc.)

    12.4. Market Attractiveness Analysis

    12.5. Drivers and Restraints: Impact Analysis

13. Competition Landscape

    13.1. Competition Dashboard

    13.2. Company Profiles (Details - Overview, Financials, Strategy, Recent Developments)

    13.3. Global Players

        13.3.1. Evonik Industries AG

        13.3.2. Kemira Oyj

        13.3.3. PeroxyChem LLC

        13.3.4. Mitsubishi Gas Chemical Company Inc.

        13.3.5. National Peroxide Limited

    13.4. ASEAN Based Players

        13.4.1. Solvay Peroxythai Ltd.

    13.5. China Based Players

        13.5.1. Qingdao Hiseachem Co., Ltd

        13.5.2. Tianjin Xinyuan Chemical Co.,Ltd.

    13.6. India Based Players

        13.6.1. Aditya Birla Chemicals Limited

        13.6.2. MGI Chemicals Pvt. Ltd.

        13.6.3. Acuro Organics Limited

14. Assumptions and Acronyms Used

15. Research Methodology

Research Methodology Framework for Market Research Excellence

At Persistence Market Research, we implement a comprehensive, validated, and multi-dimensional approachto market analysis that delivers actionable insights across complex market landscapes. Our methodology combines the analytical rigor of leading consulting firms with innovative research techniques, ensuring robust market assessments that guide strategic decision-making with confidence.

Core Research Philosophy

Our methodology is built on four foundational pillars:

Research Philosophy Image

At Persistence Market Research, our methodology is designed to transcend conventional market studies by combining analytical rigor, multi-source validation, and future-focused insights.

We integrate advanced research frameworks, robust data collection strategies, cutting-edge analytics, and innovative technologies to deliver a 360-degree view of complex markets.

We integrate advanced research frameworks, robust data collection strategies, cutting-edge analytics, and innovative technologies to deliver a 360-degree view of complex markets.

Each stage spanning from strategic scoping and hypothesis-building to competitive intelligence, quality validation, and actionable recommendations is engineered to provide clients with unmatched clarity, precision, and confidence in decision-making.

By embedding innovation and technology at the core, our approach ensures that insights are not only comprehensive but also predictive, empowering businesses to seize opportunities, mitigate risks, and achieve sustainable growth

Research Philosophy Image

Capturing Key Information and Events

During this phase, key research objectives focus on essential information and data points for assessing the market, including:

Research Philosophy Image

TAM-SAM-SOM Framework Implementation

We employ both top-down and bottom-up approaches to ensure accurate market sizing.

Top-Down Market SizingBottom-Up Market Sizing
Universe Definition: Total global/regional market identificationUnit Economics: Average transaction values, purchase frequencies, customer lifecycle
Segmentation Filters: Geographic, demographic, and behavioral constraintsCustomer Segmentation: Detailed buyer persona development and sizing
Market Share Analysis: Competitive landscape assessment and share allocationPenetration Analysis: Market penetration rates by segment and geography
Growth Rate Application: Historical trends and forward-looking growth assumptionsScaling Methodology: Extrapolation techniques with confidence intervals

Validation & Cross-Verification

  • Triangulation: Comparing top-down and bottom-up results for consistency
  • Sensitivity Analysis: Testing key assumptions and parameter variations
  • Peer Benchmarking: Comparison with analogous markets and industry benchmarks
  • Expert Review: External validation through industry specialist consultation

Research Philosophy Image

Forecasting & Projection Modeling

Our proprietary forecasting models incorporate multiple variables and scenarios.

Forecasting Components

  • Historical Trend Analysis: 10-year historical growth patterns and cyclical variations
  • Driver-Based Modeling: Economic indicators, demographic shifts, technology adoption
  • Scenario Planning: Base case, optimistic, and conservative projections
  • Monte Carlo Simulations: Probability-weighted outcomes and risk assessments

Model Validation

  • Back-Testing: Historical accuracy assessment over 3–5-year periods
  • Cross-Validation: Multiple modeling approaches for result comparison
  • External Benchmarking: Comparison with established market forecasts
  • Continuous Calibration: Quarterly model updates based on new data

Comprehensive Data Collection Strategy

Our secondary research phase establishes a robust knowledge base utilizing diverse, credible sources.

Secondary Data Sourcess

  • Industry Publications & Reports
  • Government & Regulatory Data
  • Financial Intelligence (filings & reports)
  • Academic Research & Digital Intelligence

Quality Assurance Protocol

  • Source credibility assessment and publication date validation
  • Data consistency checks across multiple sources
  • Bias identification and neutralization techniques
  • Information gap tracking for primary research prioritization

Research Philosophy Image

Primary Research Excellence

Our primary research methodology employs best-in-class techniques to capture unique market insights.

Quantitative Research Methods

  • Large-Scale Surveys: Statistically representative samples with 95% confidence intervals
  • Survey Methodology: Multi-channel deployment (online, telephone, in-person)
  • Question Architecture and Response Optimization

Qualitative Research Methods

  • Executive Interviews
  • Focus Groups
  • Expert Consultations

Quality Assurance & Validation Framework

Multi-Stage Validation Process

  • Source Verification and Consistency Testing
  • Outlier Detection and Bias Assessment
  • Peer Review Process and External Validation
  • Sensitivity Analysis and Confidence Intervals

Research Philosophy Image

Methodology Validation & Credibility

Our research methodology has been extensively validated through:

  • Academic Partnerships: Collaborations with top-tier business schools and research institutions
  • Client Success Stories: Documented case studies demonstrating research impact and ROI
  • Continuous Benchmarking: Performance comparison with leading global research firms

This comprehensive methodology framework positions Persistence Market Research at the forefront of market intelligence, combining the analytical sophistication of top-tier consulting firms with innovative research techniques. Our approach ensures that every market assessment delivers precise, actionable, and strategically valuable insights that drive business success in competitive market environments.

Ready to unlock your market potential? Contact our research experts to discuss how our validated methodology can transform your strategic decision-making with data-driven market intelligence.

Copyright © 2026 Persistence Market Research. All Rights Reserved

Connect With Us -