

- Executive Summary
- Global Ascorbic Acid Market Snapshot 2026 and 2033
- Market Opportunity Assessment, 2026-2033, US$ Bn
- Key Market Trends
- Industry Developments and Key Market Events
- Demand Side and Supply Side Analysis
- PMR Analysis and Recommendations
- Market Overview
- Market Scope and Definitions
- Value Chain Analysis
- Macro-Economic Factors
- Global GDP Outlook
- Global Nutrition and Supplements Industry Overview
- Global Pharmaceutical Industry Overview
- Forecast Factors – Relevance and Impact
- COVID-19 Impact Assessment
- PESTLE Analysis
- Porter's Five Forces Analysis
- Geopolitical Tensions: Market Impact
- Regulatory and Technology Landscape
- Market Dynamics
- Drivers
- Restraints
- Opportunities
- Trends
- Price Trend Analysis, 2020 – 2033
- Region-wise Price Analysis
- Price by Segments
- Price Impact Factors
- Global Ascorbic Acid Market Outlook: Historical (2020 – 2025) and Forecast (2026 – 2033)
- Key Highlights
- Global Ascorbic Acid Market Outlook: Product Type
- Introduction/Key Findings
- Historical Market Size (US$ Bn) and Volume (Tons) Analysis by Product Type, 2020-2025
- Current Market Size (US$ Bn) and Volume (Tons) Forecast, by Product Type, 2026-2033
- Sodium Ascorbate
- Calcium Ascorbate
- Potassium Ascorbate
- Magnesium Ascorbate
- Others
- Market Attractiveness Analysis: Product Type
- Global Ascorbic Acid Market Outlook: Grade
- Introduction/Key Findings
- Historical Market Size (US$ Bn) and Volume (Tons) Analysis by Grade, 2020-2025
- Current Market Size (US$ Bn) and Volume (Tons) Forecast, by Grade, 2026-2033
- Food & Pharmaceutical
- Industrial
- Market Attractiveness Analysis: Grade
- Global Ascorbic Acid Market Outlook: Application
- Introduction/Key Findings
- Historical Market Size (US$ Bn) and Volume (Tons) Analysis by Application, 2020-2025
- Current Market Size (US$ Bn) and Volume (Tons) Forecast, by Application, 2026-2033
- Food & Beverages
- Pharmaceutical
- Cosmetics
- Chemicals
- Agriculture
- Others
- Market Attractiveness Analysis: Application
- Global Ascorbic Acid Market Outlook: Region
- Key Highlights
- Historical Market Size (US$ Bn) and Volume (Tons) Analysis by Region, 2020-2025
- Current Market Size (US$ Bn) and Volume (Tons) Forecast, by Region, 2026-2033
- North America
- Europe
- East Asia
- South Asia & Oceania
- Latin America
- Middle East & Africa
- Market Attractiveness Analysis: Region
- North America Ascorbic Acid Market Outlook: Historical (2020 – 2025) and Forecast (2026 – 2033)
- Key Highlights
- Pricing Analysis
- North America Market Size (US$ Bn) and Volume (Tons) Forecast, by Country, 2026-2033
- U.S.
- Canada
- North America Market Size (US$ Bn) and Volume (Tons) Forecast, by Product Type, 2026-2033
- Sodium Ascorbate
- Calcium Ascorbate
- Potassium Ascorbate
- Magnesium Ascorbate
- Others
- North America Market Size (US$ Bn) and Volume (Tons) Forecast, by Grade, 2026-2033
- Food & Pharmaceutical
- Industrial
- North America Market Size (US$ Bn) and Volume (Tons) Forecast, by Application, 2026-2033
- Food & Beverages
- Pharmaceutical
- Cosmetics
- Chemicals
- Agriculture
- Others
- Europe Ascorbic Acid Market Outlook: Historical (2020 – 2025) and Forecast (2026 – 2033)
- Key Highlights
- Pricing Analysis
- Europe Market Size (US$ Bn) and Volume (Tons) Forecast, by Country, 2026-2033
- Germany
- Italy
- France
- U.K.
- Spain
- Russia
- Rest of Europe
- Europe Market Size (US$ Bn) and Volume (Tons) Forecast, by Product Type, 2026-2033
- Sodium Ascorbate
- Calcium Ascorbate
- Potassium Ascorbate
- Magnesium Ascorbate
- Others
- Europe Market Size (US$ Bn) and Volume (Tons) Forecast, by Grade, 2026-2033
- Food & Pharmaceutical
- Industrial
- Europe Market Size (US$ Bn) and Volume (Tons) Forecast, by Application, 2026-2033
- Food & Beverages
- Pharmaceutical
- Cosmetics
- Chemicals
- Agriculture
- Others
- East Asia Ascorbic Acid Market Outlook: Historical (2020 – 2025) and Forecast (2026 – 2033)
- Key Highlights
- Pricing Analysis
- East Asia Market Size (US$ Bn) and Volume (Tons) Forecast, by Country, 2026-2033
- China
- Japan
- South Korea
- East Asia Market Size (US$ Bn) and Volume (Tons) Forecast, by Product Type, 2026-2033
- Sodium Ascorbate
- Calcium Ascorbate
- Potassium Ascorbate
- Magnesium Ascorbate
- Others
- East Asia Market Size (US$ Bn) and Volume (Tons) Forecast, by Grade, 2026-2033
- Food & Pharmaceutical
- Industrial
- East Asia Market Size (US$ Bn) and Volume (Tons) Forecast, by Application, 2026-2033
- Food & Beverages
- Pharmaceutical
- Cosmetics
- Chemicals
- Agriculture
- Others
- South Asia & Oceania Ascorbic Acid Market Outlook: Historical (2020 – 2025) and Forecast (2026 – 2033)
- Key Highlights
- Pricing Analysis
- South Asia & Oceania Market Size (US$ Bn) and Volume (Tons) Forecast, by Country, 2026-2033
- India
- Southeast Asia
- ANZ
- Rest of SAO
- South Asia & Oceania Market Size (US$ Bn) and Volume (Tons) Forecast, by Product Type, 2026-2033
- Sodium Ascorbate
- Calcium Ascorbate
- Potassium Ascorbate
- Magnesium Ascorbate
- Others
- South Asia & Oceania Market Size (US$ Bn) and Volume (Tons) Forecast, by Grade, 2026-2033
- Food & Pharmaceutical
- Industrial
- South Asia & Oceania Market Size (US$ Bn) and Volume (Tons) Forecast, by Application, 2026-2033
- Food & Beverages
- Pharmaceutical
- Cosmetics
- Chemicals
- Agriculture
- Others
- Latin America Ascorbic Acid Market Outlook: Historical (2020 – 2025) and Forecast (2026 – 2033)
- Key Highlights
- Pricing Analysis
- Latin America Market Size (US$ Bn) and Volume (Tons) Forecast, by Country, 2026-2033
- Brazil
- Mexico
- Rest of LATAM
- Latin America Market Size (US$ Bn) and Volume (Tons) Forecast, by Product Type, 2026-2033
- Sodium Ascorbate
- Calcium Ascorbate
- Potassium Ascorbate
- Magnesium Ascorbate
- Others
- Latin America Market Size (US$ Bn) and Volume (Tons) Forecast, by Grade, 2026-2033
- Food & Pharmaceutical
- Industrial
- Latin America Market Size (US$ Bn) and Volume (Tons) Forecast, by Application, 2026-2033
- Food & Beverages
- Pharmaceutical
- Cosmetics
- Chemicals
- Agriculture
- Others
- Middle East & Africa Ascorbic Acid Market Outlook: Historical (2020 – 2025) and Forecast (2026 – 2033)
- Key Highlights
- Pricing Analysis
- Middle East & Africa Market Size (US$ Bn) and Volume (Tons) Forecast, by Country, 2026-2033
- GCC Countries
- South Africa
- Northern Africa
- Rest of MEA
- Middle East & Africa Market Size (US$ Bn) and Volume (Tons) Forecast, by Product Type, 2026-2033
- Sodium Ascorbate
- Calcium Ascorbate
- Potassium Ascorbate
- Magnesium Ascorbate
- Others
- Middle East & Africa Market Size (US$ Bn) and Volume (Tons) Forecast, by Grade, 2026-2033
- Food & Pharmaceutical
- Industrial
- Middle East & Africa Market Size (US$ Bn) and Volume (Tons) Forecast, by Application, 2026-2033
- Food & Beverages
- Pharmaceutical
- Cosmetics
- Chemicals
- Agriculture
- Others
- Competition Landscape
- Market Share Analysis, 2025
- Market Structure
- Competition Intensity Mapping
- Competition Dashboard
- Company Profiles
- BASF SE
- Company Overview
- Product Portfolio/Offerings
- Key Financials
- SWOT Analysis
- Company Strategy and Key Developments
- DSM Nutritional Products
- Cargill, Inc.
- Zhejiang Medicine Co., Ltd.
- Northeast Pharmaceutical Group Co., Ltd.
- CSPC Pharmaceutical Group Ltd.
- Shandong Luwei Pharmaceutical Co., Ltd.
- North China Pharmaceutical Co. Ltd
- Glanbia Nutritionals China (Suzhou) Co., Ltd
- China BBCA Group Corporation
- BASF SE
- Appendix
- Research Methodology
- Research Assumptions
- Acronyms and Abbreviations


- Specialty & Fine Chemicals
- Ascorbic Acid Market
Ascorbic Acid Market Size, Share, and Growth Forecast 2026 – 2033
Ascorbic Acid Market by Product Type (Sodium Ascorbate, Calcium Ascorbate, Potassium Ascorbate, Magnesium Ascorbate, Others), Grade (Food & Pharmaceutical, Industrial), Application (Food & Beverages, Pharmaceutical, Cosmetics, Chemicals, Agriculture, Others), and Regional Analysis for 2026–2033
Ascorbic Acid Market Size and Trend Analysis
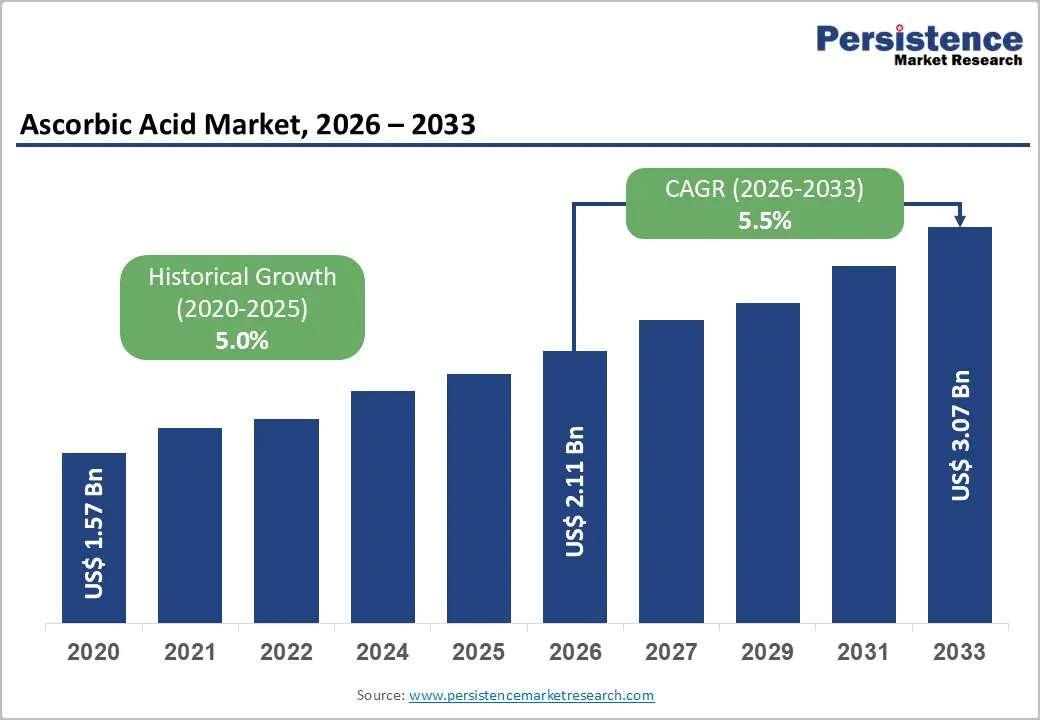
The global Ascorbic Acid market size is supposed to be valued at US$ 2.1 billion in 2026 and is projected to reach US$ 3.1 billion by 2033, growing at a CAGR of 5.5% between 2026 and 2033. The market expansion is primarily driven by rising consumer awareness of immunity-boosting nutrients and preventive healthcare, particularly following the COVID-19 pandemic, which substantially increased vitamin C supplement consumption.
The rising demand for functional foods and natural preservatives in the food and beverage sector, coupled with pharmaceutical industry requirements for therapeutic formulations, continues to fuel robust market growth. Additionally, the cosmetics industry's increasing incorporation of ascorbic acid derivatives in anti-aging and skin brightening formulations, driven by consumers' preference for clinically validated active ingredients, contributes significantly to market momentum.
Key Industry Highlights:
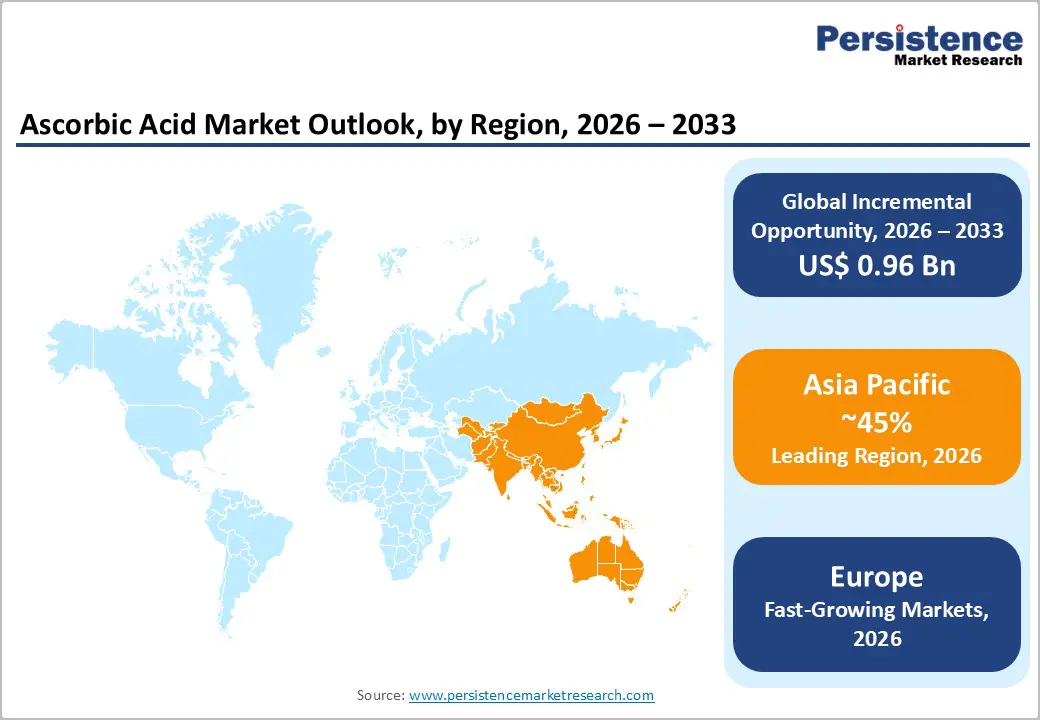
- Regional Leader: Asia-Pacific maintains a dominant market position with approximately 45% of global revenues, driven by China's production capacity exceeding 350,000 metric tons annually and commanding manufacturing cost advantages enabling aggressive export market penetration across North America, Europe, and emerging economies.
- Fastest Growing Region: Europe demonstrates robust expansion momentum with particularly strong growth trajectories in France, Germany, and Italy, fueled by consumer preference for pharmaceutical-grade formulations, cosmeceutical applications, and sustainability-focused production standards.
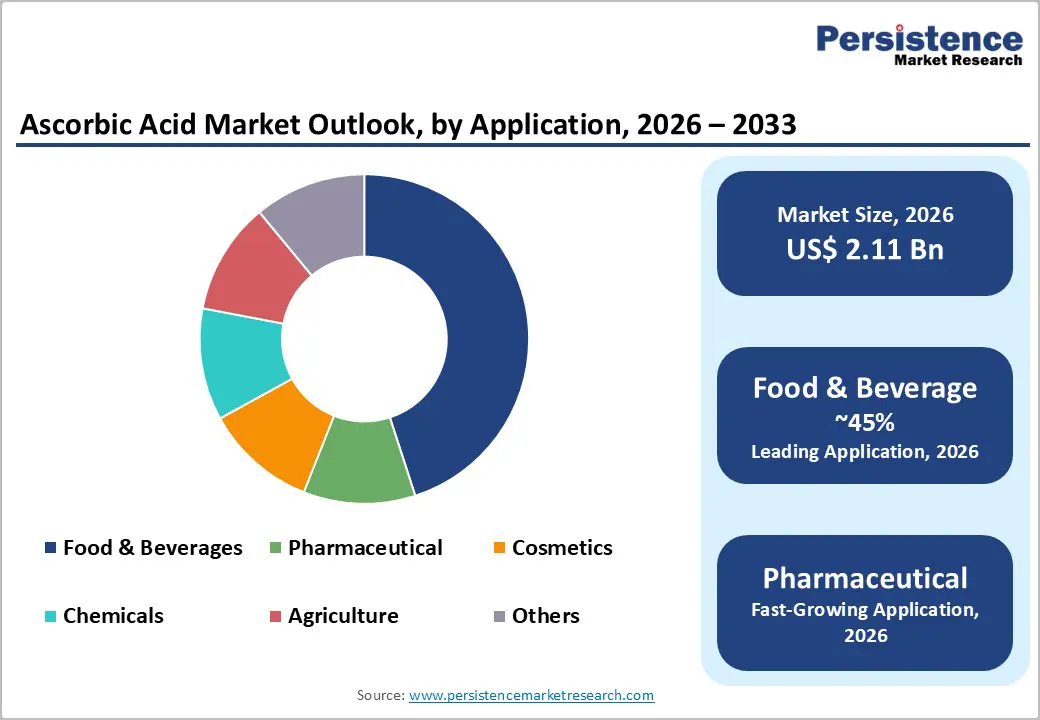
- Dominant Segment: Food & Beverages application represents the largest end-use segment commanding 45% market share, reflecting ascorbic acid's essential role as preservative, antioxidant, and nutritional fortifier across diverse food categories, including fruit juices, baked goods, processed meats, and ready-to-eat meals.
- Fastest Growing Segment: Pharmaceutical applications, including dietary supplements and intravenous formulations, supported by post-pandemic immunity-enhancement trends, clinical validation of high-dose intravenous applications, and expanding therapeutic indication research.
- Key Market Opportunity: Sustainable and bio-based production methodologies represent the most significant emerging opportunity, with regulatory harmonization and corporate sustainability commitments creating premium pricing prospects for manufacturers adopting green technologies and demonstrating verifiable environmental stewardship across the production supply chain.
| Key Insights | Details |
|---|---|
| Ascorbic Acid Market Size (2026E) | US$ 2.1 Bn |
| Market Value Forecast (2033F) | US$ 3.1 Bn |
| Projected Growth CAGR (2026-2033) | 5.5% |
| Historical Market Growth (2020-2025) | 5.0% |
Market Dynamics
Drivers - Surging Demand for Nutritional Fortification and Functional Foods
The global ascorbic acid market is witnessing significant expansion, driven by rising demand for fortified food and beverage products across both advanced and developing economies. China, a major producer, exported approximately 190,582 metric tons of vitamin C and its unmixed derivatives in 2024, reflecting strong worldwide consumption. Consumer interest in micronutrient supplementation continues to increase, further supported by evidence of robust market performance. For instance, L’Oréal’s 2023 report recorded a 12.6% like-for-like sales increase within its Consumer Products Division, with vitamin C serum highlighted as a key growth contributor.
Furthermore, the U.S. FDA’s GRAS designation for ascorbic acid at up to 90 mg per serving reinforces its widespread use in fortified foods. European nutraceutical demand remains substantial, consuming nearly 150,000 metric tons annually. This escalation reflects consumers' willingness to invest in Vitamin C Ingredients Market products, positioning ascorbic acid as an indispensable ingredient in modern food manufacturing and dietary supplement formulations.
Expansion of Natural Preservative Applications in Food Processing
The food and beverage industry's transition toward clean-label formulations and natural preservation methods has substantially elevated ascorbic acid utilization as a multifunctional ingredient. Beyond its role as a vitamin C source, ascorbic acid serves as an antioxidant that prevents oxidative degradation, extends shelf life, and maintains color stability in processed foods without synthetic chemical preservatives. The Food Safety and Standards Authority of India has implemented food fortification standards that actively encourage ascorbic acid incorporation in staple foods to address micronutrient deficiencies in emerging economies.
Commercial bakeries, beverage manufacturers, and meat processors increasingly rely on ascorbic acid to meet consumer expectations for naturally derived ingredients while maintaining product quality. According to the World Bank, the export value of vitamin C and its unmixed derivatives from China reached approximately $617.6 million in 2024, reflecting massive cross-industry utilization spanning food preservation, nutritional fortification, and functional food development.
Restraints - Physiological Side Effects and Consumer Apprehension
A significant market restraint stems from documented gastrointestinal side effects associated with high-dose ascorbic acid consumption. Approximately 30% of the global population may experience adverse effects, including diarrhea, nausea, and stomach cramps, when consuming daily doses exceeding 2 grams of ascorbic acid, according to clinical research from the National Institutes of Health. This physiological limitation directly impacts consumer adoption rates for dietary supplements and fortified food products marketed with elevated vitamin C concentrations.
Consumer hesitation regarding potential health risks creates barriers to expansion in sensitive market segments such as pediatric nutrition and elderly care formulations, where manufacturers must navigate stringent safety protocols and conservative dosing recommendations. The misinformation and health-related concerns circulating through digital media channels have created negative perceptions regarding supplemental vitamin C, thereby constraining market growth in price-sensitive consumer segments.
Price Volatility and Raw Material Cost Pressures
The production of ascorbic acid relies on energy-intensive fermentation and chemical oxidation processes that require controlled-temperature reactors, drying systems, and solvent recovery units. Consequently, the industry remains highly vulnerable to fluctuations in energy and raw material costs, particularly in manufacturing regions dominated by China. Rising energy expenses and increasingly stringent environmental regulations have further tightened profit margins and destabilized pricing. In Q1 2025, U.S. ascorbic acid prices reached $3,728 per metric ton, while domestic prices in China were recorded at $3,694 per metric ton, highlighting notable regional disparities driven by variations in production capacity and export volumes. Such volatility discourages long-term capital investment, often prompting temporary production shutdowns to balance market conditions, which disproportionately affects smaller participants and exacerbates operational and financial challenges across the supply chain.
Opportunities - Sustainable and Bio-based Production Technologies
A significant opportunity is emerging in the advancement and commercialization of sustainable, bio-based methodologies for ascorbic acid production. Conventional synthetic processes depend on petrochemical intermediates and generate considerable environmental impact through high energy usage and chemical waste. In March 2024, BASF Corporation and Archer Daniels Midland Company (ADM) announced a strategic collaboration to develop innovative vitamin C production technologies utilizing bio-based feedstock, aimed at reducing carbon emissions and enhancing overall sustainability. These initiatives align with rising regulatory pressures and growing corporate commitments to environmental responsibility, positioning early adopters of green technologies as industry leaders.
Within the Vitamin C Ingredients Market, producers demonstrating credible environmental stewardship increasingly benefit from premium pricing and preferential sourcing relationships. Meanwhile, regulatory frameworks across the European Union and North America continue to tighten environmental standards, providing a competitive advantage to manufacturers investing in biotechnological fermentation systems and renewable energy solutions.
Expansion into Aquaculture and Animal Nutrition Sectors
The aquaculture and animal nutrition sectors are emerging as rapidly expanding application areas for ascorbic acid, supported by the growth of global aquaculture production and evolving livestock management practices. China has become a major consumer of water-soluble vitamin formulations, with regulatory authorities such as the State Administration for Market Regulation (SAMR) enforcing stricter stability standards for vitamin C in aquaculture feeds beginning October 2025. Phosphate-stabilized ascorbic acid is gaining prominence in Vietnam and Thailand for water-based feed supplementation, enhancing nutrient absorption and improving disease resistance in fish and shrimp.
The Asia-Pacific region’s aquaculture output continues to rise at a pace surpassing terrestrial livestock production. Furthermore, the feed manufacturers are incorporating immunological enhancement benefits, establishing ascorbic acid as a vital nutritional component that supports production efficiency while reducing antibiotic dependence in compliance with tightening antimicrobial-use regulations.
Category-wise Analysis
Product Type Insights
Sodium ascorbate remains the leading product type, accounting for approximately 42% of the market share in 2026. Its dominance is supported by superior bioavailability, pH-neutral properties, and reduced gastric irritation compared to conventional ascorbic acid. This derivative is widely preferred in pharmaceutical formulations and dietary supplements, particularly where patient tolerance and compliance are essential. Major producers such as BASF SE and DSM Nutritional Products have expanded their manufacturing capacities to address rising demand from nutraceutical companies catering to consumers with sensitive digestive profiles.
The pharmaceutical sector also favors sodium ascorbate for injectable and intravenous applications due to its enhanced solubility and compatibility with physiological pH levels. According to the European Food Safety Authority, it provides equivalent vitamin C activity while minimizing acidic side effects, reinforcing its suitability for high-dose therapeutic use. Demand within the Vitamin C Ingredients Market continues to grow as specialized derivatives gain prominence in clinical nutrition and targeted therapeutic applications.
Grade Insights
Food and Pharmaceutical Grade ascorbic acid constitutes the leading grade segment, representing around 78% of total market valuation and commanding higher prices than industrial-grade variants. Its dominance is driven by stringent regulatory requirements and quality standards, which mandate a minimum purity level of 99% for food applications and even stricter specifications for pharmaceutical use. Compliance with international standards, including IP, BP, USP, and EP, ensures suitability for direct consumption and therapeutic formulations. Major producers such as DSM-Firmenich operate dedicated high-purity facilities, including the Dalry plant in Scotland, the only ascorbic acid manufacturing site in the Western hemisphere.
Pharmaceutical-grade material must further meet rigorous limits on heavy metals, including a typical threshold of below 0.1 ppm for lead. FDA GRAS guidelines specify maximum recommended usage levels of 90 mg per serving for adults and 25 mg for infants over six months. By contrast, industrial-grade ascorbic acid, with purity levels of 95–97%, is used primarily in chemical synthesis and lower-sensitivity preservation applications, supporting higher-volume demand at lower price points.
Application Insights
The Food & Beverages segment holds the largest share of the ascorbic acid market, accounting for approximately 45%, underscoring its essential role in preserving freshness, extending shelf life, and retaining nutritional quality across diverse food categories. Its antioxidant properties help prevent enzymatic browning in fruits and vegetables and maintain color stability in meat products, supporting clean-label formulations without synthetic additives. The growing demand for functional foods has further accelerated its use in fortified beverages, nutritional bars, and enhanced dairy products. Ascorbic acid’s multifunctionality, spanning oxidation prevention, color stabilization, browning inhibition, and antimicrobial activity, makes it vital across fruit juice processing, bakery applications, processed meats, and ready-to-eat meals. The segment’s strength is reinforced by the rising consumption of functional beverages within the expanding vitamins and supplements market.
Pharmaceutical applications hold the second-largest share at roughly 30%, driven by oral supplements, intravenous formulations, and clinical-grade preparations. Cargill, Inc. has broadened its portfolio to serve bakery applications, where ascorbic acid functions as a dough conditioner that improves texture and volume. The pharmaceutical segment is forecast to grow at 6.05% through 2031, supported by post-pandemic immunity-focused interventions and ongoing research on high-dose intravenous applications for conditions such as sepsis and viral infections.
Regional Insights
North America Ascorbic Acid Market Trends
The North American ascorbic acid market continues to demonstrate strong and consistent demand, supported by a mature regulatory environment, robust innovation capabilities, and sustained consumer focus on health and wellness. The United States remains the primary consumption hub, driven by extensive use of dietary supplements and the growing incorporation of ascorbic acid into functional food products across diverse population groups. Post-pandemic priorities have further accelerated spending on immunity-enhancing formulations, creating favorable conditions for manufacturers. Strict FDA GRAS regulations and USP standards reinforce product safety and elevate compliance requirements. In August 2025, Fufeng Group received FDA approval for its new U.S. facility, enabling expanded regional capacity and reducing reliance on Chinese imports.
The region’s innovation ecosystem supports advancements in personalized nutrition, microencapsulation technologies, and pharmaceutical-grade formulations. Leading producers, including Cargill, Inc., maintain extensive production and distribution networks that meet domestic needs while supporting exports to adjacent markets. Seasonal fluctuations persist, with higher supplement demand in autumn and winter, whereas cosmetic and skincare applications maintain steady, year-round consumption. Trade and supply dynamics remain influenced by tariff structures and logistics considerations, with domestic producers benefiting from proximity to end-user markets and lower transportation costs.
Europe Ascorbic Acid Market Trends
Europe is a strategically significant market for ascorbic acid, defined by stringent quality standards, strong regulatory harmonization, and high consumer demand for pharmaceutical-grade and naturally derived formulations. Major markets such as Germany, the U.K., France, Spain, and Italy show concentrated consumption across pharmaceutical and functional food applications. Rising interest in supplements has encouraged leading manufacturers, including BASF, to expand high-purity production capacity.
The region’s regulatory environment, shaped by the EU Cosmetics Regulation and Food Additives Regulation EC 1333/2008, enforces strict approval and certification processes that heighten entry barriers while ensuring product safety. Europe’s food and beverage sector consumes nearly 150,000 metric tons annually, supported by DSM-Firmenich’s Dalry facility, which provides strategic supply security. Growth varies by country, with France and Germany showing particularly strong momentum.
Asia Pacific Ascorbic Acid Market Trends
The Asia Pacific region remains the leading hub for global ascorbic acid production and consumption, with around 45% of the global market share, and China operates as the largest producer, with production capacity exceeding 350,000 metric tons annually. According to the China Chamber of Commerce for Import & Export of Medicines & Health Products, China's vitamin C export volume reached 190,582 metric tons in 2024, with export value approximating $617.6 million, demonstrating substantial global market dominance. Major Chinese manufacturers leverage cost-efficient production structures and advanced fermentation technologies to supply a broad international market spanning 161 countries.
Growing aquaculture activity in Vietnam and Thailand has further increased demand for phosphate-stabilized ascorbic acid used in fish and shrimp nutrition. Japan and India serve as important secondary markets, with Japan emphasizing advanced encapsulation technologies and India emerging as both a key consumer and expanding producer. The region’s access to low-cost feedstocks, skilled labor, and economies of scale continues to attract global investment, reinforced by China’s stricter SAMR standards for vitamin stability.
Competitive Landscape
The ascorbic acid market is moderately consolidated, with strong regional differences driven by China’s dominance in global production. Chinese manufacturers control around 70% of total capacity, led by CSPC Pharmaceutical Group Ltd. with nearly 80,000 metric tons. Despite consolidation, the market shows clear differentiation between high-volume producers serving food and beverage applications and specialized manufacturers supplying premium pharmaceutical and cosmeceutical grades. Companies such as BASF SE and DSM-Firmenich focus on vertical integration and R&D in areas like intravenous formulations, encapsulation, and sustainable production. Emerging trends emphasize supply chain transparency, sustainability certifications, and service-oriented support that strengthen long-term customer relationships.
Key Market Developments
- November 2025: Seiwa Kasei launches iVC 3GA-green, a plant-derived 3-Glyceryl Ascorbate (ascorbic acid derivative) with patented technology. The preservative-free ingredient targets anti-aging skincare through enhanced collagen production and melanin inhibition, offering superior stability for concentrated serums and vitamin C cosmetics.
- March 2024: DSM-Firmenich completed the divestiture of its Jiangshan ascorbic acid (Vitamin C) manufacturing facility in China, marking strategic portfolio repositioning within the global vitamin C supply chain amid intensifying competition from Chinese producers.
- September 2024: Norgine BV was granted U.S. Patent 12083179 for colon-cleansing solutions using 300 to 800 millimoles per liter ascorbate anion (mixture of ascorbic acid and ascorbate salts), demonstrating medical applications beyond nutrition.
Top Companies in Ascorbic Acid Market
BASF SE (Ludwigshafen, Germany) stands as one of the world's leading chemical producers with substantial ascorbic acid portfolio and advanced production infrastructure. The company maintains significant research and development capabilities focused on sustainable production methodologies and specialized derivative formulations. BASF's strategic partnerships and vertical integration approach position it as a technology leader in the industry with particular strength in European and North American markets.
DSM-Firmenich (Heerlen, Netherlands) maintains market leadership in pharmaceutical-grade and specialized ascorbic acid applications through its strategically positioned Dalry facility in Scotland, the sole ascorbic acid producer in the Western hemisphere. The company's commitment to quality assurance and sustainability standards, evidenced by CEFIC European Responsible Care Award recognition, provides competitive differentiation in premium market segments.
CSPC Pharmaceutical Group Ltd. (Shijiazhuang, China) represents the world's largest ascorbic acid producer with approximately 80,000 metric tons of annual production capacity. The company maintains comprehensive market coverage across commodity and specialized applications through economies of scale and cost-competitive production structures, dominating global export markets to North America and Europe.
Companies Covered in Ascorbic Acid Market
- BASF SE
- DSM Nutritional Products
- Cargill, Inc.
- Zhejiang Medicine Co., Ltd.
- Northeast Pharmaceutical Group Co., Ltd.
- CSPC Pharmaceutical Group Ltd.
- Shandong Luwei Pharmaceutical Co., Ltd.
- North China Pharmaceutical Co. Ltd
- Glanbia Nutritionals China (Suzhou) Co., Ltd
- China BBCA Group Corporation
Frequently Asked Questions
The global Ascorbic Acid market is projected to reach US$ 3.1 Bn by 2033 from US$ 2.1 Bn in 2026, representing a compound annual growth rate of 5.5% during the forecast period, driven by expanding demand across food fortification, pharmaceutical applications, and cosmeceutical formulations across developed and emerging economies.
The Ascorbic Acid market is principally driven by escalating consumer health consciousness and immunity-enhancement awareness, particularly following post-pandemic wellness trends, coupled with robust demand for fortified food and beverage products, pharmaceutical supplements, and cosmetic formulations emphasizing natural and scientifically validated ingredients.
Sodium Ascorbate dominates the product type segmentation with approximately 42% market share, driven by its dual functionality as both a reducing agent and antioxidant in meat curing applications, enhanced bioavailability characteristics, and widespread regulatory approval across pharmaceutical, food, and beverage industries globally.
Asia-Pacific maintains a dominant market position commanding approximately 45% of global revenues, with China serving as the world's largest ascorbic acid producer with combined capacity exceeding 350,000 metric tons annually, supported by cost-competitive manufacturing advantages and established fermentation technology expertise.
Major market opportunities encompass sustainable and bio-based production methodologies enabling premium pricing strategies through verifiable environmental stewardship, and cosmeceutical application development targeting premium skincare formulations commanding higher unit margins across affluent consumer demographics.
The Ascorbic Acid market is led by CSPC Pharmaceutical Group Ltd., BASF SE, DSM-Firmenich, and Cargill, Inc., providing a diversified portfolio coverage across food, pharmaceutical, and nutritional applications globally.


