


- Food Ingredients & Additives
- Food Preservative Market
Food Preservative Market Size, Share, and Growth Forecast, 2026-2033
Food Preservative Market by Preservative Type (Natural, Synthetic), Function (Antimicrobials, Antioxidants), Application (Meat & poultry, Dairy & Frozen Desserts, Bakery & Confectionery, Beverages, Ready‑to‑Eat Meals, Others), and Regional Analysis for 2026-2033
Food Preservative Market Share and Trends Analysis
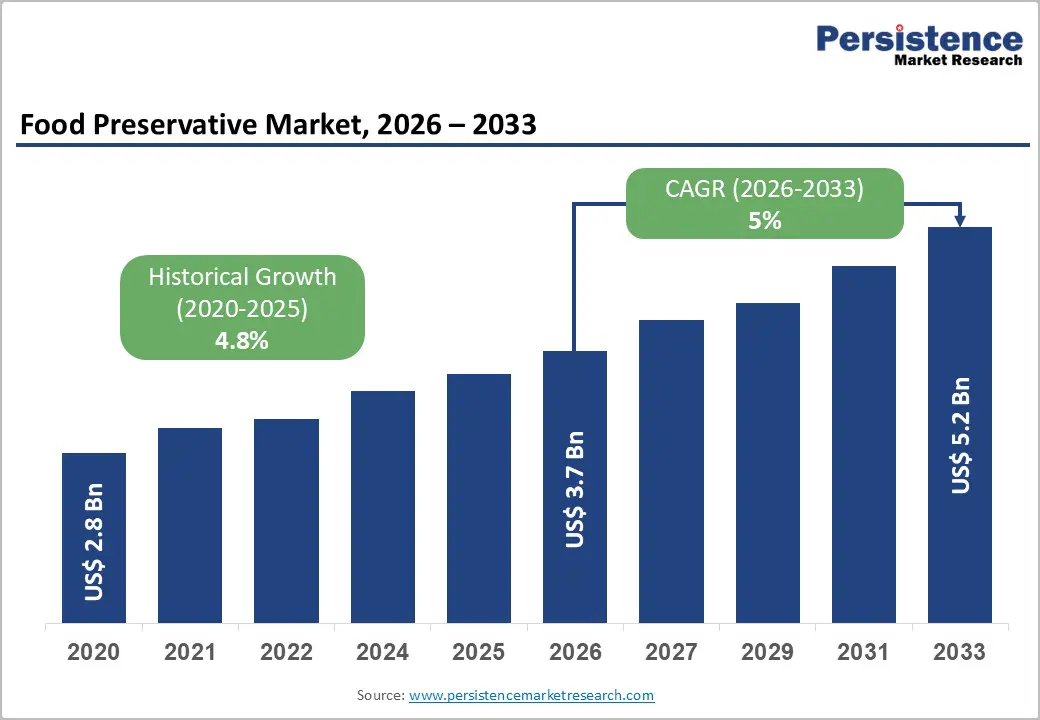
The global food preservative market size is likely to be valued at US$3.7 billion in 2026, and is projected to reach US$5.2 billion by 2033, growing at a CAGR of approximately 5.0% during the forecast period 2026–2033. Growth is being supported by continued demand for extended shelf life and improved food safety across packaged food categories. Manufacturers are incorporating preservative systems to reduce microbial contamination and maintain product stability during storage and transportation. Rising consumption of processed and convenience foods is increasing the need for reliable preservation solutions across bakery, dairy, meat, and ready-to-eat segments.
Regulatory authorities are strengthening food safety compliance requirements, and producers are responding by adopting standardized preservation protocols that align with national and international guidelines. Technological progress in natural preservation systems is reshaping product development strategies. Ingredient suppliers are investing in plant-derived antimicrobials, fermentation-based acids, and clean label solutions that meet evolving consumer expectations. Food processors are seeking multifunctional preservative blends that maintain taste and texture while extending product freshness. As distribution networks are expanding across urban and semi-urban regions, supply chain complexity is increasing, which is reinforcing demand for robust preservation systems. By aligning innovation efforts with safety standards and consumer preference shifts, industry participants are strengthening competitive positioning in the evolving food preservative market.
Key Industry Highlights
- Dominant Function: Antimicrobials are expected to hold 57% of the market in 2026, while antioxidants are likely to grow the fastest at 8.1% CAGR through 2033, driven by the critical need to prevent oxidation in processed foods.
- Leading Preservative Type: Synthetic preservatives are projected to lead with 60% share in 2026, while natural preservatives are likely to be the fastest-growing at 8.4% CAGR through 2033, supported by plant-derived and fermentation-based solutions.
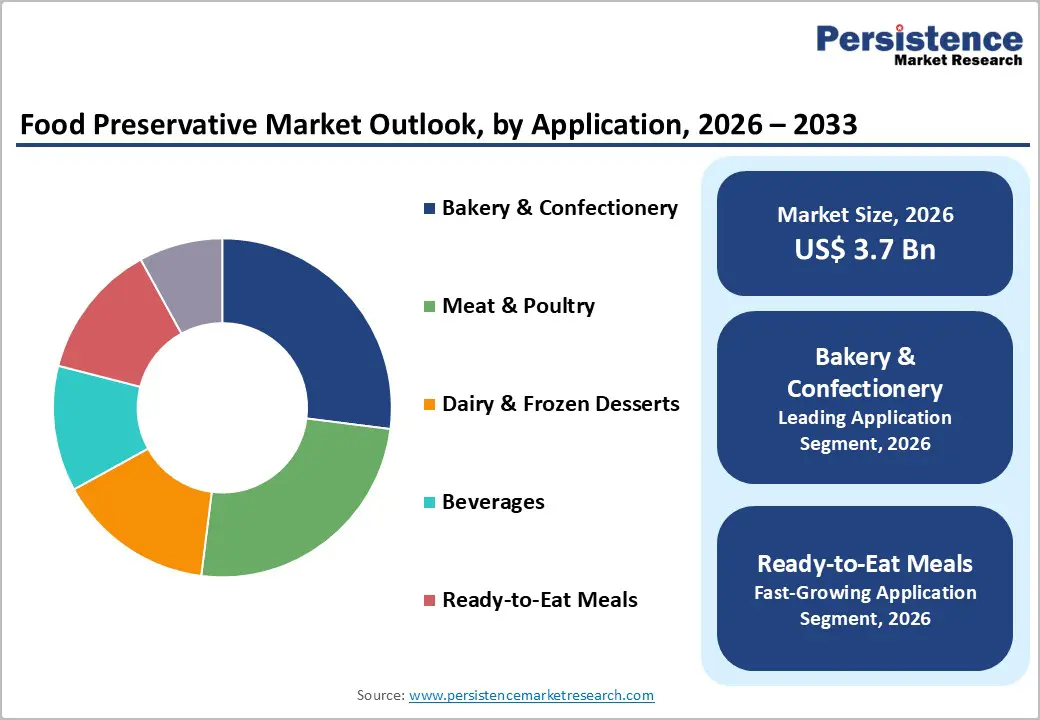
- Dominant Application: Bakery and confectionery are expected to account for 25% of the market in 2026, while ready-to-eat meals are likely to register the fastest growth at about 8.3% CAGR, reflecting rising demand for convenience foods.
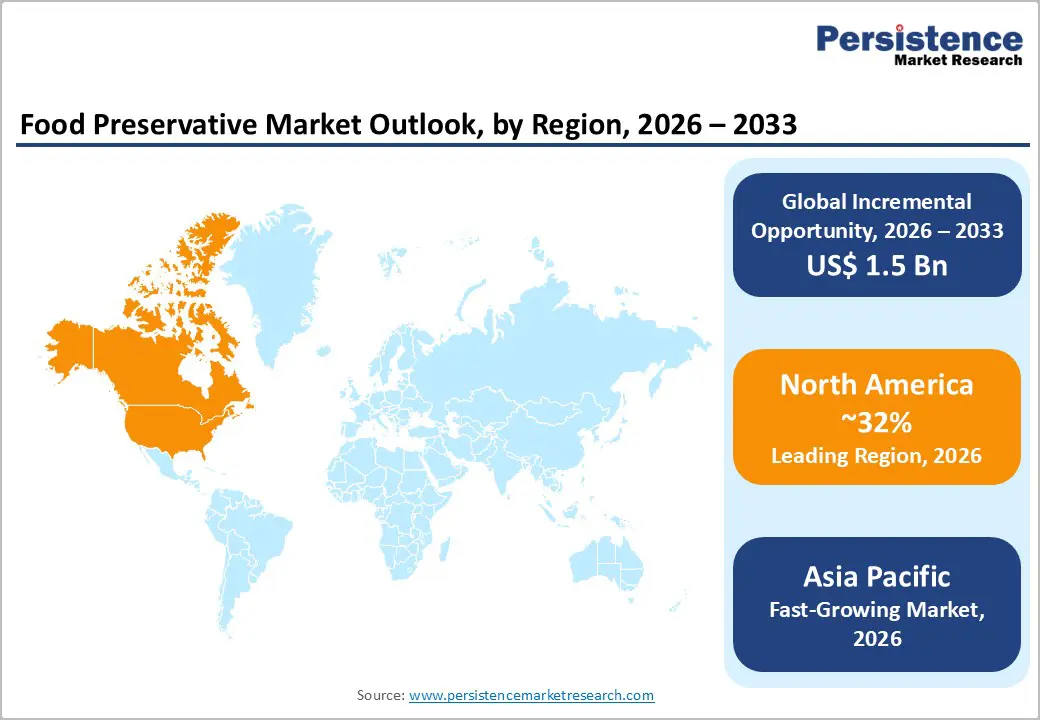
- Regional Leadership: North America is projected to dominate with roughly 32% share in 2026, while Asia Pacific is expected to be the fastest-growing market at about 6.8% CAGR, aided by strengthening cold-chain infrastructure.
- Innovation Focus: Multifunctional antimicrobial and antioxidant preservative systems are likely to drive premium adoption, enhancing food safety and shelf-life while aligning with evolving regulatory standards.
| Key Insights | Details |
|---|---|
| Food Preservative Market Size (2026E) | US$ 3.7 Bn |
| Market Value Forecast (2033F) | US$ 5.2 Bn |
| Projected Growth (CAGR 2026 to 2033) | 5.0% |
| Historical Market Growth (CAGR 2020 to 2025) | 4.8% |
Market Factors – Growth, Barriers, and Opportunity Analysis
Increasing Demand for Processed, Ready-to-Eat, and Clean-Label Food Products
Consumption of processed and convenience foods continues to rise as changing lifestyles and dietary habits prioritize convenience and quality. An overwhelming majority of urban consumers prefer packaged foods that maintain freshness across extended distribution channels, driving the need for preservatives that extend shelf life without affecting taste or texture. Manufacturers are increasingly using multifunctional preservatives combining antimicrobial and antioxidant properties to improve quality in meat, dairy, bakery, and beverage products. Regulatory agencies in key markets strengthened food safety standards, encouraging adoption of validated preservative solutions. These developments ensure consistent product quality across refrigerated and ambient supply chains while mitigating spoilage and contamination risks.
Clean-label preferences are also reshaping preservative strategies across the food industry. Leading companies such as Nestlé, Unilever, Kraft Heinz, and PepsiCo expanded reformulations to reduce artificial additives and emphasize natural ingredients. Retailers including Walmart announced plans to remove select synthetic additives from private-label products by 2027. These actions reflect rising consumer demand for transparency and minimally processed ingredients, supporting increased use of plant-derived extracts and fermentation-based preservatives. This alignment of regulatory compliance and consumer preference is driving broader adoption of natural preservative systems in multiple food categories.
Cost, Regulatory, and Technical Barriers to Preservative Adoption
The food preservative industry faces significant cost and supply chain barriers, especially for natural alternatives. Production of plant-derived and fermentation-based preservatives can be substantially more expensive than synthetic options, creating adoption challenges for cost-sensitive product lines. Supply chain volatility affecting botanical extract sourcing adds inconsistency in quality and pricing, while formulation complexities increase development effort. These pressures are most pronounced in large-volume segments, where pricing elasticity is limited. Technical limitations, such as narrower efficacy or sensitivity to pH and temperature in some natural systems, further complicate wide-scale deployment.
Regulatory and compliance challenges add another layer of complexity. The U.S. Food and Drug Administration (FDA) announced plans to phase out several synthetic food colorants and revisit the Generally Regarded as Safe (GRAS) approval approach, requiring more rigorous safety data for new additives, and potentially extending review timelines for natural preservatives. Approval timelines for new bio-based compounds can exceed a year, creating friction compared to established synthetic solutions. Evolving requirements across jurisdictions increase compliance costs, and varying definitions for natural ingredients add uncertainty for manufacturers. Together, these cost, regulatory, and technical barriers continue to restrain the pace of preservative innovation and broader adoption of cleaner alternatives.
Multifunctional Preservation and Clean-Label Expansion with Verified Industry Advances
Convergence of antimicrobial and antioxidant functionalities continues to create a compelling opportunity for preservative innovation. Companies such as Kerry Group launched clean-label preservatives tailored for plant-based dairy alternatives, using botanical extracts and natural antimicrobials that reduce artificial additives across product portfolios. Similarly, Cargill expanded its natural preservative range with a citrus-based antimicrobial blend that has been integrated into bakery segment applications to enhance shelf life. These developments demonstrate how multifunctional systems can extend product freshness while meeting consumer expectations for quality and simplicity. Emergence of hybrid formulations that combine microbial control with oxidative stability supports premium positioning and stronger brand differentiation.
Clean-label reformulation offers strategic value for manufacturers responding to evolving preferences. Events such as Corbion’s showcase of clean-label solutions at IBIE 2025 illustrate how natural fermentation-derived preservative systems are being promoted as practical alternatives to synthetic additives, particularly in bakery categories. Additionally, broader adoption of natural antimicrobials such as nisin in snacks, dairy, and meat applications highlights a shift toward label-friendly preservatives that still meet safety requirements. These real-world developments support partnerships between preservative suppliers and food producers, enabling alignment with both regulatory expectations and consumer demand for transparency. These represent actionable opportunities for innovation and growth across the preservative landscape.
Category-wise Analysis
Preservative Type Insights
Synthetic preservatives, including sorbates, benzoates, propionates, nitrites, and sulfites, are estimated to account for 60% of the market revenue share in 2026 due to their cost efficiency, proven efficacy, and regulatory familiarity. Their utility is projected across beverages, bakery, dairy, and meat products for controlling microbial growth. Over half of bakery and frozen products are estimated to incorporate advanced preservative systems, improving stability by more than 30% versus older formulations. These compounds are likely to remain the default choice for large-scale processing due to consistent performance. Multifunctional application is projected to further strengthen their adoption. Regulatory compliance is estimated to remain streamlined for these agents. Their dominance is expected to continue across both established and emerging markets.
Natural preservatives are projected to grow at an estimated 8.4% CAGR during the 2026-2033 forecast period, driven by clean-label demand and consumer preference for recognizable ingredients. This segment includes plant-derived extracts, fermentation-derived biopreservatives, traditional agents, and bio-based antioxidants. Ingredion expanded its partnership with Univar Solutions in the Benelux region, which is estimated to indirectly support adoption of natural preservative and antioxidant solutions in bakery and snack applications. Adoption is projected to be strongest in health-focused and premium product lines. Improved extraction and stabilization technologies are estimated to enhance functionality. Regulatory encouragement for natural labeling is expected to further support growth.
Function Insights
Antimicrobials are estimated to lead the food preservative market revenue share with approximately 57% in 2026, driven by their ability to inhibit bacteria, yeasts, and molds in high-risk foods such as meat, dairy, and ready-to-eat meals. Over one-third of ready-to-eat meals are estimated to incorporate antimicrobial blends that increase shelf life by more than 30%, reflecting industry adoption. These systems are projected to remain central in both refrigerated and ambient goods for maintaining consistent quality. Manufacturers are likely to increasingly deploy multifunctional antimicrobial systems to meet evolving safety regulations. Regulatory emphasis on microbial control is expected to continue reinforcing adoption. Their application is estimated to remain critical across both premium and mass-market product lines.
Antioxidants are anticipated to expand rapidly at an estimated 8.1% CAGR through 2033, owing to the widespread demand for oxidative stability in high-fat bakery, snacks, and dairy products. Improved antioxidant systems help preserve flavor, color, and nutritional integrity, enhancing consumer appeal. In July 2025, for instance, Tate & Lyle expanded its antioxidant-enriched preservative solutions for ready meals and beverages, specifically targeting flavor retention and quality consistency across distributed products. These innovations support extended freshness without compromising sensory attributes. Natural antioxidant extracts such as rosemary and tocopherols are gaining traction in clean-label portfolios. Antioxidants are increasingly paired with antimicrobial agents in hybrid formulations to deliver broader preservation benefits. Their growth reflects both functional necessity and evolving consumer preferences for quality and transparency.
Application Insight
Bakery and confectionery applications are estimated to account for around 25% of the food preservative market share in 2026 due to high susceptibility to microbial and oxidative spoilage. Preservatives are projected to maintain texture, moisture, and flavor across breads, cakes, cookies, and sweets. Multifunctional systems that manage both microbial and oxidative risks are estimated to be widely adopted. Ajinomoto introduced natural preservative formulations for bakery and fresh produce, which is projected to extend shelf life and maintain product quality. Adoption of clean-label preservatives is expected to increase in this high-volume category. Manufacturers are likely to combine natural and traditional preservatives for optimal performance. Regulatory compliance is projected to remain critical for both ambient and refrigerated products.
Ready meals and beverages are projected to grow at about 8.3% CAGR between 2026 and 2033, powered by heightening convenience consumption and distribution needs, especially in urban areas. Preservation systems are estimated to ensure microbial safety, flavor integrity, and nutritional value during refrigerated and ambient storage. Kirin Holdings launched plant-based antimicrobial preservatives for bakery, dairy, and beverage products, which is projected to improve product stability and consumer acceptance. Beverages such as juices and functional drinks are expected to rely on preservatives for oxidative and microbial control. Clean-label solutions are likely to gain further adoption while maintaining safety standards. Multifunctional systems are projected to be increasingly deployed for comprehensive preservation.
Regional Insights
North America Food Preservative Market Trends
North America is estimated to dominate the market for food preservatives with approximately 32% share in 2026, anchored by a mature food processing sector and strong safety oversight that supports preservative adoption. Regulatory momentum is shaping industry behavior. For example, the U.S. Department of Health and Human Services (HHS) announced plans to phase out certain petroleum-based synthetic food dyes by the end of 2026, pushing reformulations toward safer, label-friendly alternatives. Consumer preference for clean labels and ingredient transparency continues to drive preservative strategy shifts among major food producers. The complexity of extended distribution networks and growth of e-commerce food channels further amplifies reliance on preservation solutions that maintain safety and quality.
Legislative pressures have also been gathering steam at the state level. For example, several food industry groups sued the state of Texas over a new law requiring warning labels on certain preservatives and additives, underscoring regulatory uncertainty that affects formulation strategies in the region. Meanwhile, major food manufacturers are adapting by reformulating products with natural alternatives and enhanced quality control measures. Investments in analytical quality systems and automated production are increasing to support traceability and safety compliance. These developments are likely to sustain North America’s leadership while encouraging adoption of both traditional and innovative preservative technologies.
Europe Food Preservative Market Trends
Europe is expected to remain a key player in the food preservative market through 2033, with regulatory harmonization under bodies such as the European Food Safety Authority (EFSA) creating a consistent compliance environment. Regional food safety authorities have continued reviewing long-standing additives, with mid 2025 updates focusing on more rigorous testing for permitted food additives, including preservatives, to strengthen consumer protection and confidence in food safety. Consumer purchasing behavior strongly reflects clean-label preferences, with many buyers actively avoiding artificial additives as part of their quality assessment when shopping.
These regulatory and consumer trends are encouraging manufacturers to accelerate reformulation of legacy products with natural preservative systems that align with sustainability goals. Ingredient innovators and food processors are collaborating to develop bio-based and fermentation-derived preservative technologies that meet both safety expectations and sensory quality criteria. Investments in domestic production capacity and logistics continue to support the European food industry’s ability to serve both local and export markets. The region’s focus on ingredient transparency, combined with strict additive review processes, is expected to reinforce its role as a market where quality and compliance converge.
Asia Pacific Food Preservative Market Trends
The market for food preservatives in Asia Pacific is projected to grow at a strong CAGR of about 6.8% over the 2026-2033 forecast period, fueled by rising demand for processed and convenience foods amid large-scale urbanization and steadily rising disposable incomes. China leads with its expanding food processing industry and modern retail infrastructure, supporting preservative adoption to maintain quality over extended distribution. Indonesia’s mandatory halal certification updates impacted preservative compliance, prompting ingredient suppliers to reformulate products. Expanding cold chain logistics and e-commerce growth further increase the need for preservative systems that ensure safety and shelf life. Multifunctional antimicrobial and antioxidant solutions are increasingly adopted in snacks and beverages.
Consumer awareness of natural and label-friendly preservatives is rising across Japan, Singapore, and Australia, driving clean-label adoption. Several Southeast Asian beverage and snack producers implemented nisin-based antimicrobial systems as alternatives to synthetic preservatives. Local manufacturers are investing in R&D to develop region-specific solutions for traditional and modern foods. Strategic partnerships with multinational producers support technology transfer and broader product portfolios, while regulatory alignment with international safety standards encourages both natural and synthetic preservative adoption. Infrastructure and logistics improvements further enhance product safety and distribution efficiency.
Competitive Landscape
The global food preservative market structure is moderately consolidated, with leading players such as Kerry Group, Corbion, DSM, DuPont, and Tate & Lyle collectively controlling a significant portion of market revenue. These established companies leverage strong relationships with large-scale food manufacturers, deep regulatory expertise, and integrated preservative portfolios spanning both synthetic and natural solutions. Heavy investments in R&D and formulation innovation allow them to maintain technological leadership, particularly in multifunctional antimicrobial and antioxidant systems.
Regional and niche players, including Novozymes, and Ingredion, are focusing on natural preservative segments and high-growth geographies such as Asia Pacific. Barriers such as strict regulatory compliance, ingredient validation, and supply chain constraints limit new entrants, but trends toward clean-label, multifunctional preservatives, and natural solutions are enabling innovative start-ups to collaborate via technology partnerships. Market consolidation is projected to continue gradually, with global leaders acquiring smaller specialized companies to expand geographically and technologically, while regional producers strengthen presence through co-development of clean-label, bio-based, and fermentation-derived preservative solutions.
Key Industry Developments
- In September 2025, Argentina-based BioBlends developed volatile organic compound (VOC) preservatives derived from bacteria to naturally extend shelf life in baked goods. These preservatives maintain freshness and texture without synthetic additives, responding to rising clean-label demand.
- In July 2025, Novella partnered with Metaphor Foods to commercialize cell-based natural preservatives for meat, dairy, bakery, and alternative protein products. The AuraCell™ platform grows bioactive plant compounds outside the plant, providing consistent antimicrobial and antioxidant properties while reducing resource use by 99%.
- In July 2025, Mitsubishi Chemical enhanced its ready-to-eat meals and packaged foods portfolio using oxygen-absorbing technologies under AgeLess® and NutraSave brands. These solutions prevent spoilage and oxidative changes, potentially doubling shelf life while reducing preservatives and sodium.
Companies Covered in Food Preservative Market
- Royal DSM N.V.
- Kemin Industries, Inc.
- Cargill, Incorporated
- BASF SE
- Prinova Group LLC
- DuPont Nutrition & Biosciences
- Galactic SA
- Tate & Lyle PLC
- Celanese Corporation
- Kerry Group plc
- Ajinomoto Co., Inc.
- Purac Biochem B.V.
- Archer Daniels Midland Company
- Brenntag AG
- Edlong Flavors & Food Ingredients
Frequently Asked Questions
The global food preservative market is projected to reach US$ 3.7 billion in 2026.
Escalating consumption of processed and convenience foods, regulatory emphasis on food safety, and clean-label trends are driving market growth.
The market is poised to witness a CAGR of 5% from 2026 to 2033.
Innovation in multifunctional preservatives, clean-label product adoption, and expansion in developing markets represent major growth opportunities.
Kerry Group, Corbion, DSM, DuPont, Tate & Lyle, Chr. Hansen, Novozymes, and Ingredion are some of the leading companies in the market.


