


1. Executive Summary
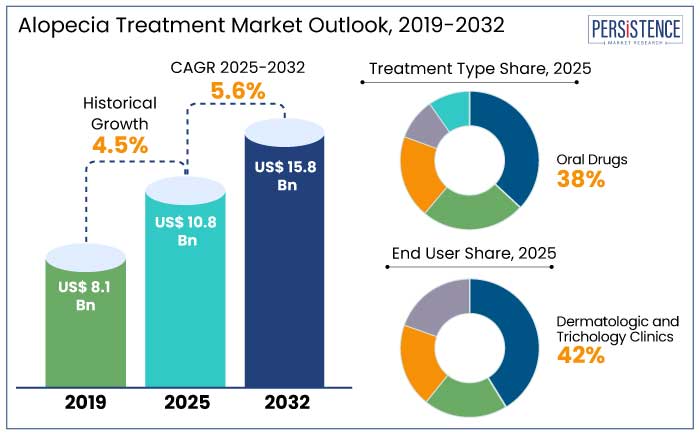
1.1. Global Alopecia Treatment Market Snapshot, 2025 and 2032
1.2. Market Opportunity Assessment, 2025 – 2032, US$ Bn
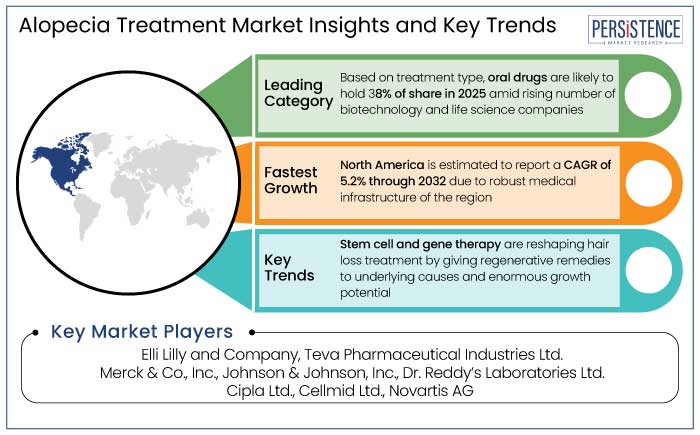
1.3. Key Market Trends
1.4. Future Market Projections
1.5. Premium Market Insights
1.6. Industry Developments and Key Market Events
1.7. PMR Analysis and Recommendations
2. Market Overview
2.1. Market Scope and Definition
2.2. Market Dynamics
2.2.1. Drivers
2.2.2. Restraints
2.2.3. Opportunity
2.2.4. Challenges
2.2.5. Key Trends
2.3. Macro-Economic Factors
2.3.1. Global Sectorial Outlook
2.3.2. Global GDP Growth Outlook
2.4. COVID-19 Impact Analysis
2.5. Forecast Factors – Relevance and Impact
3. Value Added Insights
3.1. Regulatory Landscape
3.2. Product Adoption Analysis
3.3. Value Chain Analysis
3.4. Key Deals and Mergers
3.5. PESTLE Analysis
3.6. Porter’s Five Force Analysis
4. Global Alopecia Treatment Market Outlook:
4.1. Key Highlights
4.1.1. Market Size (US$ Bn) and Y-o-Y Growth
4.1.2. Absolute $ Opportunity
4.2. Market Size (US$ Bn) Analysis and Forecast
4.2.1. Historical Market Size (US$ Bn) Analysis, 2019-2023
4.2.2. Current Market Size (US$ Bn) Analysis and Forecast, 2025–2032
4.3. Global Alopecia Treatment Market Outlook: Treatment Type
4.3.1. Introduction / Key Findings
4.3.2. Historical Market Size (US$ Bn) Analysis, By Treatment Type, 2019 – 2023
4.3.3. Current Market Size (US$ Bn) Analysis and Forecast, By Treatment Type, 2025 – 2032
4.3.3.1. Topical Drugs
4.3.3.1.1. Creams
4.3.3.1.2. Oils
4.3.3.1.3. Gels
4.3.3.1.4. Shampoo
4.3.3.1.5. Lotion
4.3.3.1.6. Foam
4.3.3.2. Oral Drugs
4.3.3.3. Injectable
4.3.3.3.1. Platelet Rich Plasma
4.3.3.3.2. Steroid Injections
4.3.3.3.3. Injectable Filler
4.3.3.4. Hair Transplant Services
4.3.3.5. Low-Level Laser Therapy
4.3.4. Market Attractiveness Analysis: Treatment Type
4.4. Global Alopecia Treatment Market Outlook: End User
4.4.1. Introduction / Key Findings
4.4.2. Historical Market Size (US$ Bn) Analysis, By End User, 2019 – 2023
4.4.3. Current Market Size (US$ Bn) Analysis and Forecast, By End User, 2025 – 2032
4.4.3.1. Hospitals
4.4.3.2. Dermatologic and Trichology Clinics
4.4.3.3. Home Care Settings
4.4.3.4. Aesthetic Clinics
4.4.4. Market Attractiveness Analysis: End User
5. Global Alopecia Treatment Market Outlook: Region
5.1. Key Highlights
5.2. Historical Market Size (US$ Bn) Analysis, By Region, 2019 – 2023
5.3. Current Market Size (US$ Bn) Analysis and Forecast, By Region, 2025 – 2032
5.3.1. North America
5.3.2. Europe
5.3.3. East Asia
5.3.4. South Asia and Oceania
5.3.5. Latin America
5.3.6. Middle East & Africa
5.4. Market Attractiveness Analysis: Region
6. North America Alopecia Treatment Market Outlook:
6.1. Key Highlights
6.2. Historical Market Size (US$ Bn) Analysis, By Market, 2019 – 2023
6.2.1. By Country
6.2.2. By Treatment Type
6.2.3. By End User
6.3. Current Market Size (US$ Bn) Analysis and Forecast, By Country, 2025 – 2032
6.3.1. U.S.
6.3.2. Canada
6.4. Current Market Size (US$ Bn) Analysis and Forecast, By Treatment Type, 2025 – 2032
6.4.1. Topical Drugs
6.4.1.1. Creams
6.4.1.2. Oils
6.4.1.3. Gels
6.4.1.4. Shampoo
6.4.1.5. Lotion
6.4.1.6. Foam
6.4.2. Oral Drugs
6.4.3. Injectable
6.4.3.1. Platelet Rich Plasma
6.4.3.2. Steroid Injections
6.4.3.3. Injectable Filler
6.4.4. Hair Transplant Services
6.4.5. Low-Level Laser Therapy
6.5. Current Market Size (US$ Bn) Analysis and Forecast, By End User, 2025 – 2032
6.5.1. Hospitals
6.5.2. Dermatologic and Trichology Clinics
6.5.3. Home care settings
6.5.4. Aesthetic Clinics
6.6. Market Attractiveness Analysis
7. Europe Alopecia Treatment Market Outlook:
7.1. Key Highlights
7.2. Historical Market Size (US$ Bn) Analysis, By Market, 2019 – 2023
7.2.1. By Country
7.2.2. By Treatment Type
7.2.3. By End User
7.3. Current Market Size (US$ Bn) Analysis and Forecast, By Country, 2025 – 2032
7.3.1. Germany
7.3.2. France
7.3.3. U.K.
7.3.4. Italy
7.3.5. Spain
7.3.6. Russia
7.3.7. Türkiye
7.3.8. Rest of Europe
7.4. Current Market Size (US$ Bn) Analysis and Forecast, By Treatment Type, 2025 – 2032
7.4.1. Topical Drugs
7.4.1.1. Creams
7.4.1.2. Oils
7.4.1.3. Gels
7.4.1.4. Shampoo
7.4.1.5. Lotion
7.4.1.6. Foam
7.4.2. Oral Drugs
7.4.3. Injectable
7.4.3.1. Platelet Rich Plasma
7.4.3.2. Steroid Injections
7.4.3.3. Injectable Filler
7.4.4. Hair Transplant Services
7.4.5. Low-Level Laser Therapy
7.5. Current Market Size (US$ Bn) Analysis and Forecast, By End User, 2025 – 2032
7.5.1. Hospitals
7.5.2. Dermatologic and Trichology Clinics
7.5.3. Home care settings
7.5.4. Aesthetic Clinics
7.6. Market Attractiveness Analysis
8. East Asia Alopecia Treatment Market Outlook:
8.1. Key Highlights
8.2. Historical Market Size (US$ Bn) Analysis, By Market, 2019 – 2023
8.2.1. By Country
8.2.2. By Treatment Type
8.2.3. By End User
8.3. Current Market Size (US$ Bn) Analysis and Forecast, By Country, 2025 – 2032
8.3.1. China
8.3.2. Japan
8.3.3. South Korea
8.4. Current Market Size (US$ Bn) Analysis and Forecast, By Treatment Type, 2025 – 2032
8.4.1. Topical Drugs
8.4.1.1. Creams
8.4.1.2. Oils
8.4.1.3. Gels
8.4.1.4. Shampoo
8.4.1.5. Lotion
8.4.1.6. Foam
8.4.2. Oral Drugs
8.4.3. Injectable
8.4.3.1. Platelet Rich Plasma
8.4.3.2. Steroid Injections
8.4.3.3. Injectable Filler
8.4.4. Hair Transplant Services
8.4.5. Low-Level Laser Therapy
8.5. Current Market Size (US$ Bn) Analysis and Forecast, By End User, 2025 – 2032
8.5.1. Hospitals
8.5.2. Dermatologic and Trichology Clinics
8.5.3. Home care settings
8.5.4. Aesthetic Clinics
8.6. Market Attractiveness Analysis
9. South Asia & Oceania Alopecia Treatment Market Outlook:
9.1. Key Highlights
9.2. Historical Market Size (US$ Bn) Analysis, By Market, 2019 – 2023
9.2.1. By Country
9.2.2. By Treatment Type
9.2.3. By End User
9.3. Current Market Size (US$ Bn) Analysis and Forecast, By Country, 2025 – 2032
9.3.1. India
9.3.2. Southeast Asia
9.3.3. ANZ
9.3.4. Rest of South Asia & Oceania
9.4. Current Market Size (US$ Bn) Analysis and Forecast, By Treatment Type, 2025 – 2032
9.4.1. Topical Drugs
9.4.1.1. Creams
9.4.1.2. Oils
9.4.1.3. Gels
9.4.1.4. Shampoo
9.4.1.5. Lotion
9.4.1.6. Foam
9.4.2. Oral Drugs
9.4.3. Injectable
9.4.3.1. Platelet Rich Plasma
9.4.3.2. Steroid Injections
9.4.3.3. Injectable Filler
9.4.4. Hair Transplant Services
9.4.5. Low-Level Laser Therapy
9.5. Current Market Size (US$ Bn) Analysis and Forecast, By End User, 2025 – 2032
9.5.1. Hospitals
9.5.2. Dermatologic and Trichology Clinics
9.5.3. Home care settings
9.5.4. Aesthetic Clinics
9.6. Market Attractiveness Analysis
10. Latin America Alopecia Treatment Market Outlook:
10.1. Key Highlights
10.2. Historical Market Size (US$ Bn) Analysis, By Market, 2019 – 2023
10.2.1. By Country
10.2.2. By Treatment Type
10.2.3. By End User
10.3. Current Market Size (US$ Bn) Analysis and Forecast, By Country, 2025 – 2032
10.3.1. Brazil
10.3.2. Mexico
10.3.3. Rest of Latin America
10.4. Current Market Size (US$ Bn) Analysis and Forecast, By Treatment Type, 2025 – 2032
10.4.1. Topical Drugs
10.4.1.1. Creams
10.4.1.2. Oils
10.4.1.3. Gels
10.4.1.4. Shampoo
10.4.1.5. Lotion
10.4.1.6. Foam
10.4.2. Oral Drugs
10.4.3. Injectable
10.4.3.1. Platelet Rich Plasma
10.4.3.2. Steroid Injections
10.4.3.3. Injectable Filler
10.4.4. Hair Transplant Services
10.4.5. Low-Level Laser Therapy
10.5. Current Market Size (US$ Bn) Analysis and Forecast, By End User, 2025 – 2032
10.5.1. Hospitals
10.5.2. Dermatologic and Trichology Clinics
10.5.3. Home care settings
10.5.4. Aesthetic Clinics
10.6. Market Attractiveness Analysis
11. Middle East & Africa Alopecia Treatment Market Outlook:
11.1. Key Highlights
11.2. Historical Market Size (US$ Bn) Analysis, By Market, 2019 – 2023
11.2.1. By Country
11.2.2. By Treatment Type
11.2.3. By End User
11.3. Current Market Size (US$ Bn) Analysis and Forecast, By Country, 2025 – 2032
11.3.1. GCC Countries
11.3.2. Egypt
11.3.3. South Africa
11.3.4. Northern Africa
11.3.5. Rest of Middle East & Africa
11.4. Current Market Size (US$ Bn) Analysis and Forecast, By Treatment Type, 2025 – 2032
11.4.1. Topical Drugs
11.4.1.1. Creams
11.4.1.2. Oils
11.4.1.3. Gels
11.4.1.4. Shampoo
11.4.1.5. Lotion
11.4.1.6. Foam
11.4.2. Oral Drugs
11.4.3. Injectable
11.4.3.1. Platelet Rich Plasma
11.4.3.2. Steroid Injections
11.4.3.3. Injectable Filler
11.4.4. Hair Transplant Services
11.4.5. Low-Level Laser Therapy
11.5. Current Market Size (US$ Bn) Analysis and Forecast, By End User, 2025 – 2032
11.5.1. Hospitals
11.5.2. Dermatologic and Trichology Clinics
11.5.3. Home care settings
11.5.4. Aesthetic Clinics
11.6. Market Attractiveness Analysis
12. Competition Landscape
12.1. Market Share Analysis, 2025
12.2. Market Structure
12.2.1. Competition Intensity Mapping By Market
12.2.2. Competition Dashboard
12.3. Company Profiles (Details – Overview, Financials, Strategy, Recent Developments)
12.3.1. Elli Lilly and Company
12.3.1.1. Overview
12.3.1.2. Segments and Products
12.3.1.3. Key Financials
12.3.1.4. Market Developments
12.3.1.5. Market Strategy
12.3.2. Teva Pharmaceutical Industries Ltd.
12.3.3. Merck & Co., Inc.
12.3.4. Johnson & Johnson, Inc.
12.3.5. Dr. Reddy’s Laboratories Ltd.
12.3.6. Cipla Ltd.
12.3.7. Cellmid Ltd.
12.3.8. The Himalaya Drug Company
12.3.9. Taisho Pharmaceutical Holdings Co., Ltd
12.3.10. Shiseido Co., Ltd.
12.3.11. Zhangguang 101 Science & Technology Co., Ltd.
12.3.12. Pfizer
12.3.13. Thera dome
12.3.14. LUTRONIC
12.3.15. Curallux
12.3.16. Sun Pharmaceutical Industries Ltd.
12.3.17. GlaxoSmithKline plc
12.3.18. Fagron
12.3.19. Apple Therapeutics Private Limited
12.3.20. Aclaris Therapeutics, Inc.
12.3.21. RepliCel Life Sciences Inc.
13. Appendix
13.1. Research Methodology
13.2. Research Assumptions
13.3. Acronyms and Abbreviations

Loading page data
Please wait a moment


