


- Marine
- Seismic Vessels Market
Seismic Vessels Market Size, Trends, Share, and Growth Forecast, 2025 - 2032
Seismic Vessels Market by Size of Screening Systems (2D Seismic Vessels, 3D Seismic Vessels and 4D Seismic Vessels), Technology (Towed Streamer Vessels, Ocean Bottom Seismic Vessels and Transition Zone Seismic Vessels), Application (Oil & Gas Industries, Geological Surveys, and Defense), and Regional Analysis for 2025 - 2032
Seismic Vessels Market Size and Trends Analysis
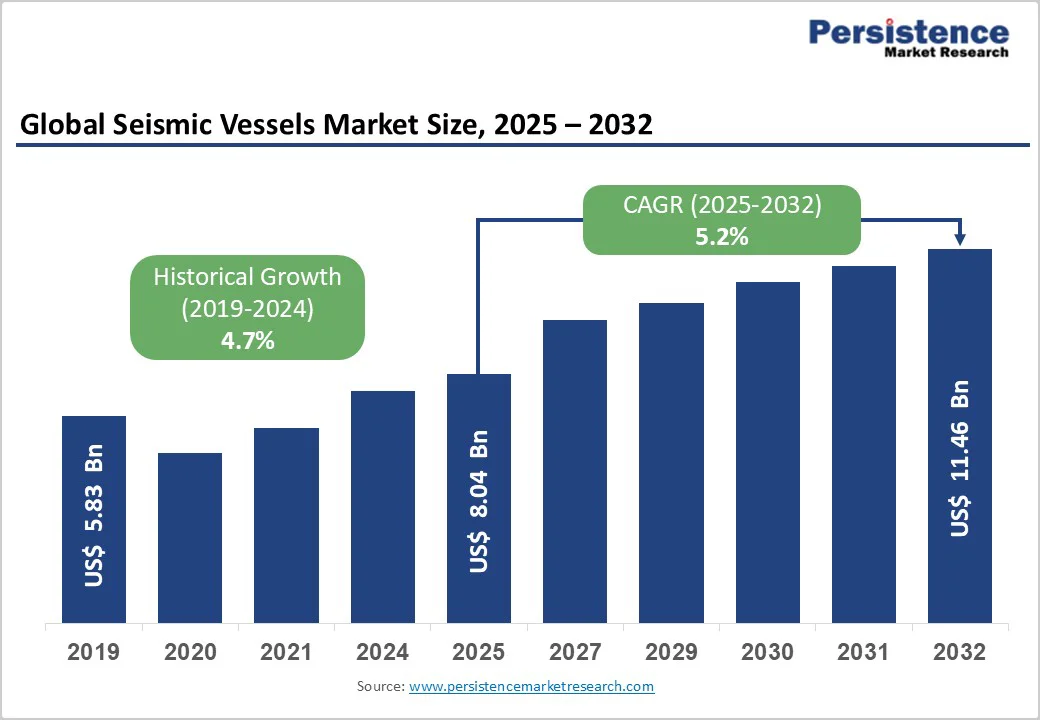
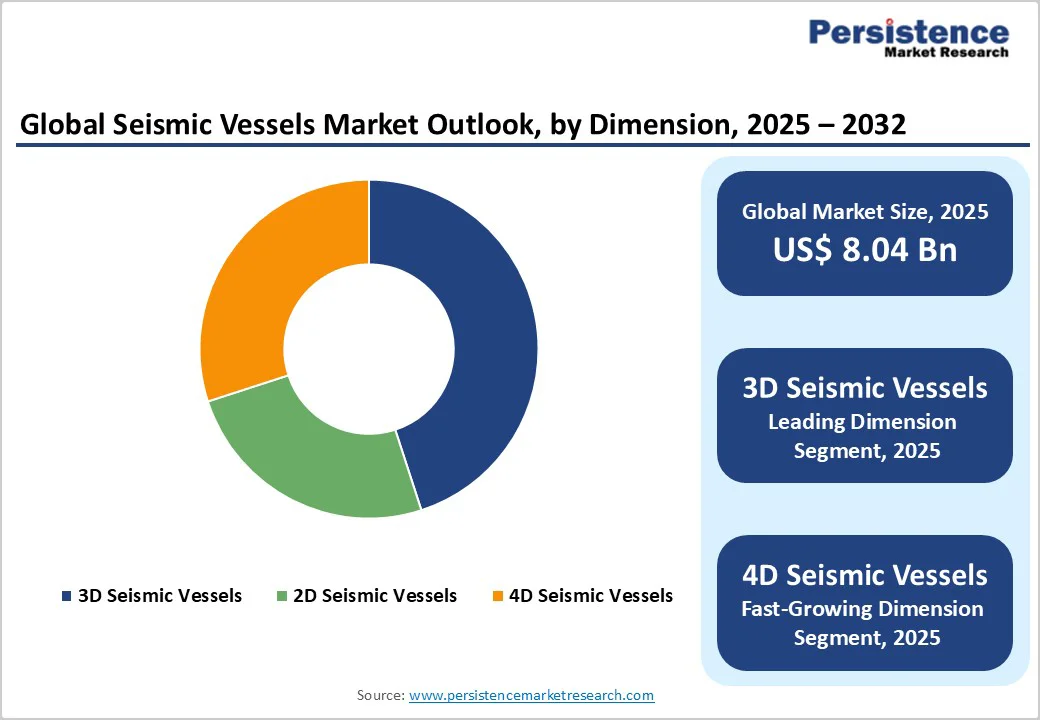
The global seismic vessels market size was valued at US$8.04 billion in 2025 and is projected to reach US$11.46 billion by 2032, growing at a CAGR of 5.2% between 2025 and 2032.
The market's expansion is fundamentally driven by persistent demand for accurate subsurface imaging to locate hydrocarbon reserves, ongoing offshore oil and gas exploration in challenging marine environments, and emerging opportunities in renewable energy applications, including offshore wind farm site assessments and cable routing surveys.
Key Industry Highlights:
- Survey Type Dominance: 3D seismic vessels command 45.2% market share ($3.63 billion), while 4D vessels represent fastest-growing segment driven by reservoir monitoring and production optimization requirements
- Technology Segmentation: Towed streamer vessels dominate with 38.5% share and established reliability, while ocean bottom seismic vessels represent fastest-growing technology segment with superior subsurface imaging capabilities
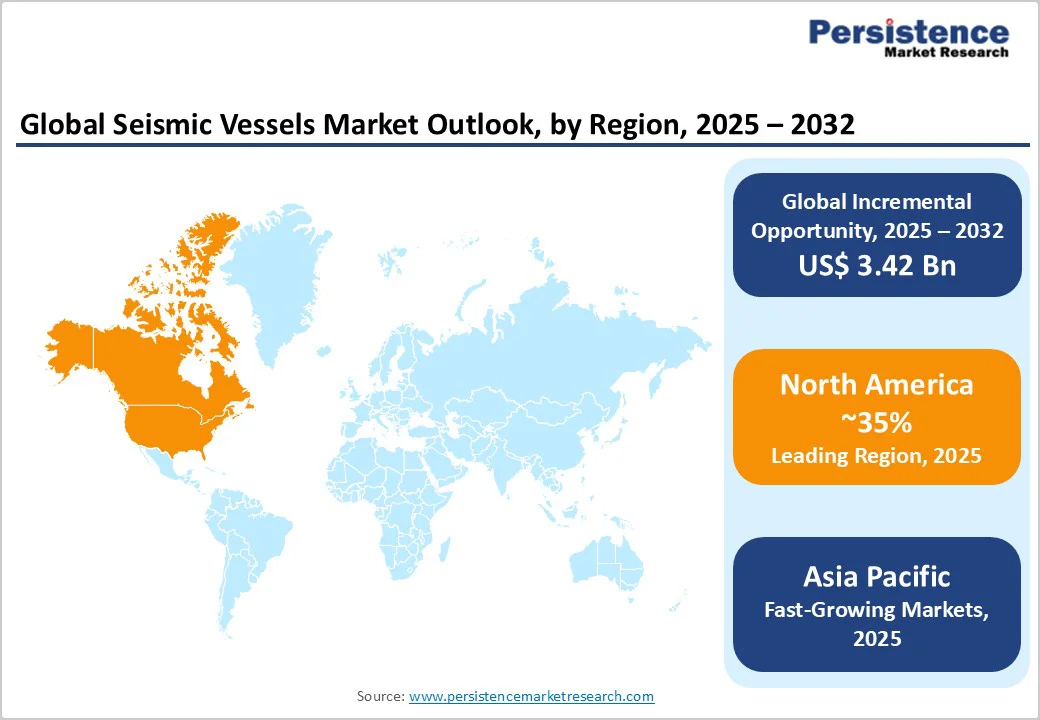
- Regional Leadership: North America dominates with 30-35% market share driven by Gulf of Mexico exploration, while Asia-Pacific emerges as the fastest-growing region at 5.5%+ projected CAGR with Vietnam, Indonesia, and Australia leading demand
- Application Evolution: Oil & Gas Industries command 43.2% market share ($3.48 billion), while Geological Surveys emerge as the fastest-growing application driven by offshore wind farm site selection and renewable energy infrastructure requirements
- Strategic Consolidation: TGS's $864 million PGS acquisition and $231 million Magseis-Fairfield purchase create an integrated services provider, while Shearwater operates independent fleet of 20+ vessels representing a competitive alternative
- Technology Innovation Leadership: Autonomous underwater vehicle development, including PXGEO MantaRay and Blue Ocean Seismic Services BOSS system, combined with AI-powered data processing and Sercel/Teledyne nodal system advancement, reshaping operational economics and reducing survey duration by 30-40%.
| Key Insights | Details |
|---|---|
|
Seismic Vessels Market Size (2025E) |
US$8.04 Bn |
|
Market Value Forecast (2032F) |
US$11.46 Bn |
|
Projected Growth (CAGR 2025 to 2032) |
5.2% |
|
Historical Market Growth (CAGR 2019 to 2024) |
4.7% |
Market Dynamics
Drivers - Rising Global Vehicle Production and Fleet Expansion
The seismic vessels market is experiencing substantial growth driven by escalating exploration activities in deepwater and ultra-deepwater offshore environments, where traditional shallow-water reserves have been largely depleted. Global deepwater production is expected to increase significantly with discoveries in regions including West Africa, South America (particularly Guyana and Suriname), and Southeast Asia, requiring specialized seismic survey capabilities. The International Energy Agency reports that offshore oil and gas investments have reached unprecedented levels, with deepwater projects commanding premium valuations justifying extensive seismic survey expenditures.
Modern 3D seismic surveys can now image reserves up to 3-5 kilometers below the seafloor compared to 100-200 meters in the 1980s, providing unprecedented subsurface clarity. Schlumberger, a major oilfield services company, projected more than 20% growth in 2023 with anticipated investments totaling more than $500 million between 2022 and 2025 in oil and gas exploration, representing a 90% increase compared to the 2016-2019 period.
Technological Advancement and Next-Generation Imaging Capabilities
Continuous innovation in seismic acquisition technologies, including 3D, 4D, and advanced multi-component imaging systems, enhances data quality, operational efficiency, and reduces exploration risk. Approximately 40% of new seismic vessel orders in 2023 were for multi-purpose vessels capable of performing both seismic studies and other offshore tasks, enhancing operational flexibility and cost efficiency. Advanced features including autonomous underwater vehicles, AI-powered data interpretation, IoT integration, and real-time data processing, are transforming operational capabilities.
4D seismic survey technology, enabling repeated imaging at time intervals, permits detection of fluid substitution and pressure variations within reservoirs, providing critical insights for production optimization and risk mitigation. Integration of machine learning and artificial intelligence into data interpretation improves accuracy while reducing processing time, creating a competitive advantage for operators deploying advanced analytics. These technological improvements attract capital investment and sustain market growth momentum.
Restraints - Oil Price Volatility and Capital Spending Uncertainty
Fluctuating oil and natural gas prices create demand uncertainty and constrain capital investment decisions by oil and gas companies, thereby limiting seismic survey deployment requirements. Lower commodity prices reduce exploration budgets and delay seismic survey projects, directly impacting vessel utilization rates and revenue generation.
The majority of market demand remains concentrated in oil and gas exploration, creating exposure to commodity price cycles and energy transition risks. Global energy policy shifts toward renewables and decarbonization create long-term uncertainty regarding traditional oil and gas exploration investment, potentially moderating growth projections. These macroeconomic uncertainties create planning challenges for vessel operators and equipment manufacturers.
High Capital Intensity and Overcapacity Dynamics
Significant capital requirements for constructing and maintaining advanced seismic vessels create financial barriers and operational challenges, limiting market entry and expansion opportunities. The seismic vessel industry has historically experienced periods of overcapacity when supply exceeds demand, resulting in depressed charter rates and reduced profitability. Fleet consolidation resulting from industry restructuring has reduced active vessel counts from 65-70 to 15-17 towed streamer vessels, but overcapacity remains characteristic in ocean bottom seismic segments. Excess vessel capacity depresses charter rates and reduces returns on capital, constraining profitability and limiting investment in new vessel construction. These structural challenges create volatility and limit growth acceleration.
Opportunities - Autonomous Underwater Vehicle Integration and Next Generation Technologies
The development and deployment of autonomous underwater vehicles for seismic survey operations represent transformative technology opportunities enabling faster, safer, and more cost-effective survey execution. Blue Ocean Seismic Services completed successful autonomous sea trials of prototype underwater vehicles designed for self-repositioning ocean-bottom node deployment, demonstrating technological viability.
PXGEO's MantaRay hovering autonomous underwater vehicle technology enables rapid ocean bottom node deployment and recovery with reduced environmental impact, reducing survey operation duration and operational costs. The WiMUST project, which is developing cooperative autonomous underwater vehicle formations, demonstrates the potential to revolutionize seismic survey methodology, fundamentally transforming operational economics.
Emerging Market Penetration and Regional Expansion
Asia-Pacific represents the highest-growth regional market with strong demand from deepwater exploration in Southeast Asia and offshore wind development, creating substantial expansion opportunities. Chinese and Southeast Asian shipbuilding capacity offers cost-competitive vessel construction capabilities, enabling capital-efficient fleet expansion strategies. Government policies supporting offshore energy infrastructure development across the Asia-Pacific create stable, predictable demand sources. Operators establishing regional manufacturing partnerships and service capabilities capture emerging market opportunities during high-growth phases.
Category-wise Analysis
Seismic Survey Type Analysis
3D seismic vessels dominate the market with a 45.2% share, valued at approximately $3.63 billion in 2025, owing to their superior imaging precision and ability to reduce exploration risks. These vessels capture high-resolution volumetric data that optimize well placement, horizontal drilling, and reservoir evaluation, making them indispensable for offshore exploration. Although more complex and costly than 2D surveys, 3D seismic operations provide deeper geological insights, supporting efficient exploration planning.
Meanwhile, 4D seismic vessels represent the fastest-growing segment, driven by demand for reservoir monitoring and production optimization. By conducting time-lapse 3D imaging, 4D seismic surveys detect fluid and pressure changes within reservoirs, improving recovery rates and reducing drilling uncertainty. Their growing adoption highlights increasing emphasis on data-driven production management.
Technology Analysis
Towed streamer vessels hold a 38.5% market share, representing the long-standing standard in seismic survey technology. These vessels deploy hydrophone arrays towed behind ships, offering cost-effective, high-resolution subsurface imaging across large offshore areas. Modern systems equipped with 8–12 km streamers and advanced signal processing deliver improved accuracy and efficiency. Ongoing innovations—such as AI-driven data interpretation and dual-energy imaging—enhance detection precision, while fleet consolidation from 65–70 to 15–17 active units has improved pricing stability and market balance.
Conversely, Ocean Bottom Node (OBN) seismic vessels represent the fastest-growing segment, delivering superior subsurface imaging through three-component sensors placed on the seabed. OBN systems achieve higher market value due to premium data quality, enhanced azimuth coverage, and autonomous node deployment, which improves survey speed and environmental performance.
Application Analysis
Oil and gas exploration dominates the market with a 43.2% share (≈$3.48 billion in 2025), driven by continued exploration in deepwater, ultra-deepwater, and mature producing fields across the Gulf of Mexico, North Sea, West Africa, and Southeast Asia. Seismic surveys remain essential for reservoir characterization, production optimization, and appraisal drilling, ensuring steady demand despite commodity price fluctuations.
Conversely, geological surveys represent the fastest-growing application, supported by rising investments in renewable energy infrastructure, scientific research, and environmental monitoring. Offshore wind projects increasingly require subsea geophysical surveys for foundation and cable route assessment. Expanding geological and environmental survey activities enhance market resilience by reducing dependence on traditional oil and gas exploration cycles.
Regional Market Insights
North America Seismic Vessels Market Trends
North America represents approximately 35% of the global seismic vessels market, with the United States commanding a dominant regional position through Gulf of Mexico oil and gas exploration activities. Approximately 44 seismic vessels operate in North American waters, including 32 in the U.S. Gulf of Mexico and 12 in Canadian Atlantic waters, reflecting substantial regional survey activity. North America captured 45% of global equipment deployments in 2023-2024, with 1,200 square kilometers of 3D surveys and 130,000 line-kilometers of 2D data acquired. The region hosted 150 sub-bottom profiler units and 80 air-gun clusters supporting deepwater Gulf campaigns, demonstrating equipment concentration.
U.S. offshore energy policies and the Offshore Energy Competitiveness Act promote investments in sustained seismic research and the advancement of marine technology. Emerging Atlantic offshore wind development and Gulf of Mexico renewables projects create new survey opportunities for traditional seismic vessel operators. North American infrastructure investments, including four new streamer-refurbishment docks, represent significant operational capability enhancement, enabling 90 streamer retrofits and reducing lead times by 20%. Government support for offshore energy infrastructure development and advanced technology innovation sustains market leadership.
Europe Seismic Vessels Market Trends
Europe accounts for approximately 20% of the global market, with the North Sea serving as the primary operational hub for towed streamer and emerging ocean-bottom seismic activities. European regulatory frameworks, including stringent environmental standards and emissions controls, drive vessel fleet modernization, favoring advanced energy-efficient designs. Strategic exploration and production activities across mature North Sea fields and emerging deepwater prospects sustain steady survey demand. Scientific research initiatives and environmental monitoring surveys create additional stable demand sources.
European companies, including Shearwater GeoServices and TGS-PGS, are establishing global technology leadership. Shearwater's fleet, comprising approximately 20 vessels, represents substantial regional and international capability. Strategic acquisitions and equipment retrofits reflect a commitment to advancing technology and improving operational efficiency. Environmental regulations promoting sustainable technologies accelerate the adoption of efficient propulsion systems and emissions reduction technologies.
Asia Pacific Seismic Vessels Market Trends
Asia-Pacific represents the fastest-growing regional market with 25.0% global market share in 2024, positioned for continued expansion. Deepwater and ultra-deepwater exploration activities in Southeast Asia, Australia, and offshore China drive substantial survey demand. Countries including Vietnam, Indonesia, and Australia demonstrate high seismic activity reflecting substantial offshore exploration portfolios. Chinese and Southeast Asian shipbuilding capacity enables cost-competitive vessel construction, attracting capital investment.
Emerging markets across the Asia-Pacific region, representing significant untapped offshore reserves, create substantial exploration opportunities, with governments aggressively supporting offshore energy infrastructure development. Investment in geological surveys supporting renewable energy projects, including offshore wind farms, accelerates across the region. Strong infrastructure development initiatives and urbanization drive energy demand, establishing a foundation for sustained offshore exploration expansion.
Seismic Vessels Market Competitive Landscape
The global seismic vessels market exhibits moderate concentration with leading operators TGS, Shearwater GeoServices, CGG, and BGP controlling substantial market shares through owned fleets and established client relationships. Following industry consolidation, the towed streamer market comprises approximately 15-17 actively operating vessels controlled by two primary companies, creating improved market dynamics and pricing stability. The ocean bottom seismic market is highly fragmented, with multiple competitors including Sercel, Teledyne Marine, and emerging autonomous technology providers, creating competitive pricing pressure and technology-driven differentiation opportunities.
Key Industry Developments:
- In May 2024, Deltamarin and ECOLOG collaborated to create a new design for an LCO2 carrier for global tendering at shipyards. This design is geared toward intra-EU, short-range, low-pressure, and shallow draft criteria.
- In February 2024, Deltamarin and BAR Technologies announced a new wind-optimized hull design, demonstrating their dedication to decarbonization and innovation. Aquilo, a co-developed Aframax/LRII design, improves performance through enhanced hull design and WindWings technology.
Companies Covered in Seismic Vessels Market
- Tananger Offshore AS
- Damen Shipyards Group
- Naval Dynamics
- Rederij Groen
- Cemre Shipyard
- Swire Pacific Offshore Operations (Pte) Ltd
- Salt Ship Design
- Sanco Shipping AS
- Ulstein Group ASA
- Others Key Players
Frequently Asked Questions
The Seismic Vessels market is estimated to be valued at US$ 8.04 Bn in 2025.
The key demand driver for the Seismic Vessels market is the rising global exploration and production (E&P) activities in offshore oil and gas fields, particularly in deepwater and ultra-deepwater regions.
In 2025, the North America region will dominate the market with an exceeding 35% revenue share in the global Seismic Vessels market.
Among the Dimension Type, 3D Seismic Vessels holds the highest preference, capturing beyond 45.2% of the market revenue share in 2025, surpassing other Dimension.
The key players in Seismic Vessels are Tananger Offshore AS, Damen Shipyards Group, Naval Dynamics and Rederij Groen.


