

- Executive Summary
- Global Truck Landing Gear Market Snapshot 2026 and 2033
- Market Opportunity Assessment, 2026 - 2033, US$ Bn
- Key Market Trends
- Industry Developments and Key Market Events
- Demand Side and Supply Side Analysis
- PMR Analysis and Recommendations
- Market Overview
- Market Scope and Definitions
- Value Chain Analysis
- Macro-Economic Factors
- Global GDP Outlook
- Global Automotive Sector Outlook
- Global Trailer Production
- Global Trailer Production, by Manufacturers
- Forecast Factors - Relevance and Impact
- COVID-19 Impact Assessment
- PESTLE Analysis
- Porter's Five Forces Analysis
- Geopolitical Tensions: Market Impact
- Regulatory and Technology Landscape
- Market Dynamics
- Drivers
- Restraints
- Opportunities
- Trends
- Price Trend Analysis, 2020 - 2033
- Region-wise Price Analysis
- Price by Segments
- Price Impact Factors
- Global Truck Landing Gear Market Outlook: Historical (2020 - 2025) and Forecast (2026 - 2033)
- Key Highlights
- Global Truck Landing Gear Market Outlook: Product Type
- Introduction/Key Findings
- Historical Market Size (US$ Bn) and Volume (Units) Analysis by Product Type, 2020-2025
- Current Market Size (US$ Bn) and Volume (Units) Forecast, by Product Type, 2026-2033
- Manual Landing Gear
- Automatic/Power Landing Gear
- Market Attractiveness Analysis: Product Type
- Global Truck Landing Gear Market Outlook: Lifting Capacity
- Introduction/Key Findings
- Historical Market Size (US$ Bn) and Volume (Units) Analysis by Lifting Capacity, 2020-2025
- Current Market Size (US$ Bn) and Volume (Units) Forecast, by Lifting Capacity, 2026-2033
- Upto 20000 lbs
- 20001 to 50000 lbs
- Above 50000 lbs
- Market Attractiveness Analysis: Lifting Capacity
- Global Truck Landing Gear Market Outlook: Sales Channel
- Introduction/Key Findings
- Historical Market Size (US$ Bn) and Volume (Units) Analysis by Sales Channel, 2020-2025
- Current Market Size (US$ Bn) and Volume (Units) Forecast, by Sales Channel, 2026-2033
- OEM
- Aftermarket
- Market Attractiveness Analysis: Sales Channel
- Global Truck Landing Gear Market Outlook: Region
- Key Highlights
- Historical Market Size (US$ Bn) and Volume (Units) Analysis by Region, 2020-2025
- Current Market Size (US$ Bn) and Volume (Units) Forecast, by Region, 2026-2033
- North America
- Europe
- East Asia
- South Asia & Oceania
- Latin America
- Middle East & Africa
- Market Attractiveness Analysis: Region
- North America Truck Landing Gear Market Outlook: Historical (2020 - 2025) and Forecast (2026 - 2033)
- Key Highlights
- Pricing Analysis
- North America Market Size (US$ Bn) and Volume (Units) Forecast, by Country, 2026-2033
- U.S.
- Canada
- North America Market Size (US$ Bn) and Volume (Units) Forecast, by Product Type, 2026-2033
- Manual Landing Gear
- Automatic/Power Landing Gear
- North America Market Size (US$ Bn) and Volume (Units) Forecast, by Lifting Capacity, 2026-2033
- Upto 20000 lbs
- 20001 to 50000 lbs
- Above 50000 lbs
- North America Market Size (US$ Bn) and Volume (Units) Forecast, by Sales Channel, 2026-2033
- OEM
- Aftermarket
- Europe Truck Landing Gear Market Outlook: Historical (2020 - 2025) and Forecast (2026 - 2033)
- Key Highlights
- Pricing Analysis
- Europe Market Size (US$ Bn) and Volume (Units) Forecast, by Country, 2026-2033
- Germany
- Italy
- France
- U.K.
- Spain
- Russia
- Rest of Europe
- Europe Market Size (US$ Bn) and Volume (Units) Forecast, by Product Type, 2026-2033
- Manual Landing Gear
- Automatic/Power Landing Gear
- Europe Market Size (US$ Bn) and Volume (Units) Forecast, by Lifting Capacity, 2026-2033
- Upto 20000 lbs
- 20001 to 50000 lbs
- Above 50000 lbs
- Europe Market Size (US$ Bn) and Volume (Units) Forecast, by Sales Channel, 2026-2033
- OEM
- Aftermarket
- East Asia Truck Landing Gear Market Outlook: Historical (2020 - 2025) and Forecast (2026 - 2033)
- Key Highlights
- Pricing Analysis
- East Asia Market Size (US$ Bn) and Volume (Units) Forecast, by Country, 2026-2033
- China
- Japan
- South Korea
- East Asia Market Size (US$ Bn) and Volume (Units) Forecast, by Product Type, 2026-2033
- Manual Landing Gear
- Automatic/Power Landing Gear
- East Asia Market Size (US$ Bn) and Volume (Units) Forecast, by Lifting Capacity, 2026-2033
- Upto 20000 lbs
- 20001 to 50000 lbs
- Above 50000 lbs
- East Asia Market Size (US$ Bn) and Volume (Units) Forecast, by Sales Channel, 2026-2033
- OEM
- Aftermarket
- South Asia & Oceania Truck Landing Gear Market Outlook: Historical (2020 - 2025) and Forecast (2026 - 2033)
- Key Highlights
- Pricing Analysis
- South Asia & Oceania Market Size (US$ Bn) and Volume (Units) Forecast, by Country, 2026-2033
- India
- Southeast Asia
- ANZ
- Rest of SAO
- South Asia & Oceania Market Size (US$ Bn) and Volume (Units) Forecast, by Product Type, 2026-2033
- Manual Landing Gear
- Automatic/Power Landing Gear
- South Asia & Oceania Market Size (US$ Bn) and Volume (Units) Forecast, by Lifting Capacity, 2026-2033
- Upto 20000 lbs
- 20001 to 50000 lbs
- Above 50000 lbs
- South Asia & Oceania Market Size (US$ Bn) and Volume (Units) Forecast, by Sales Channel, 2026-2033
- OEM
- Aftermarket
- Latin America Truck Landing Gear Market Outlook: Historical (2020 - 2025) and Forecast (2026 - 2033)
- Key Highlights
- Pricing Analysis
- Latin America Market Size (US$ Bn) and Volume (Units) Forecast, by Country, 2026-2033
- Brazil
- Mexico
- Rest of LATAM
- Latin America Market Size (US$ Bn) and Volume (Units) Forecast, by Product Type, 2026-2033
- Manual Landing Gear
- Automatic/Power Landing Gear
- Latin America Market Size (US$ Bn) and Volume (Units) Forecast, by Lifting Capacity, 2026-2033
- Upto 20000 lbs
- 20001 to 50000 lbs
- Above 50000 lbs
- Latin America Market Size (US$ Bn) and Volume (Units) Forecast, by Sales Channel, 2026-2033
- OEM
- Aftermarket
- Middle East & Africa Truck Landing Gear Market Outlook: Historical (2020 - 2025) and Forecast (2026 - 2033)
- Key Highlights
- Pricing Analysis
- Middle East & Africa Market Size (US$ Bn) and Volume (Units) Forecast, by Country, 2026-2033
- GCC Countries
- South Africa
- Northern Africa
- Rest of MEA
- Middle East & Africa Market Size (US$ Bn) and Volume (Units) Forecast, by Product Type, 2026-2033
- Manual Landing Gear
- Automatic/Power Landing Gear
- Middle East & Africa Market Size (US$ Bn) and Volume (Units) Forecast, by Lifting Capacity, 2026-2033
- Upto 20000 lbs
- 20001 to 50000 lbs
- Above 50000 lbs
- Middle East & Africa Market Size (US$ Bn) and Volume (Units) Forecast, by Sales Channel, 2026-2033
- OEM
- Aftermarket
- Competition Landscape
- Market Share Analysis, 2025
- Market Structure
- Competition Intensity Mapping
- Competition Dashboard
- Company Profiles
- Jost International
- Company Overview
- Product Portfolio/Offerings
- Key Financials
- SWOT Analysis
- Company Strategy and Key Developments
- FUWA K-Hitch
- SAF-Holland
- Hendrickson
- Wabash National
- Paccar
- Esco Technologies
- BPW
- Actros Landing Gear
- Hyster-Yale
- Fontaine Fifth Wheel
- Logistik Ltd
- Linamar Corporation
- Jost International
- Appendix
- Research Methodology
- Research Assumptions
- Acronyms and Abbreviations


- Automotive Components & Materials
- Truck Landing Gear Market
Truck Landing Gear Market Size, Share, Trends, Growth, Regional Forecasts 2026 - 2033
Truck Landing Gear Market Product Type (Manual Landing Gear, Automatic/Power Landing Gear), Lifting Capacity (Upto 20000 lbs, 20001 to 50000 lbs, Above 50000 lbs), End-user (OEM, Aftermarket) and Regional Analysis 2026 to 2033
Key Industry Highlights:
- Manual landing gear dominates the product category with a 54% market share, while automatic/power systems are expanding at a 5.4% CAGR. Mid-range capacity (20001-50000 lbs) commands 41% share, with the heavy-capacity segment growing at a 5.2% CAGR.
- OEM sales channel maintains 58% market leadership while aftermarket segment accelerates at 5.2% CAGR, capturing growing replacement and maintenance demand from aging fleet populations.
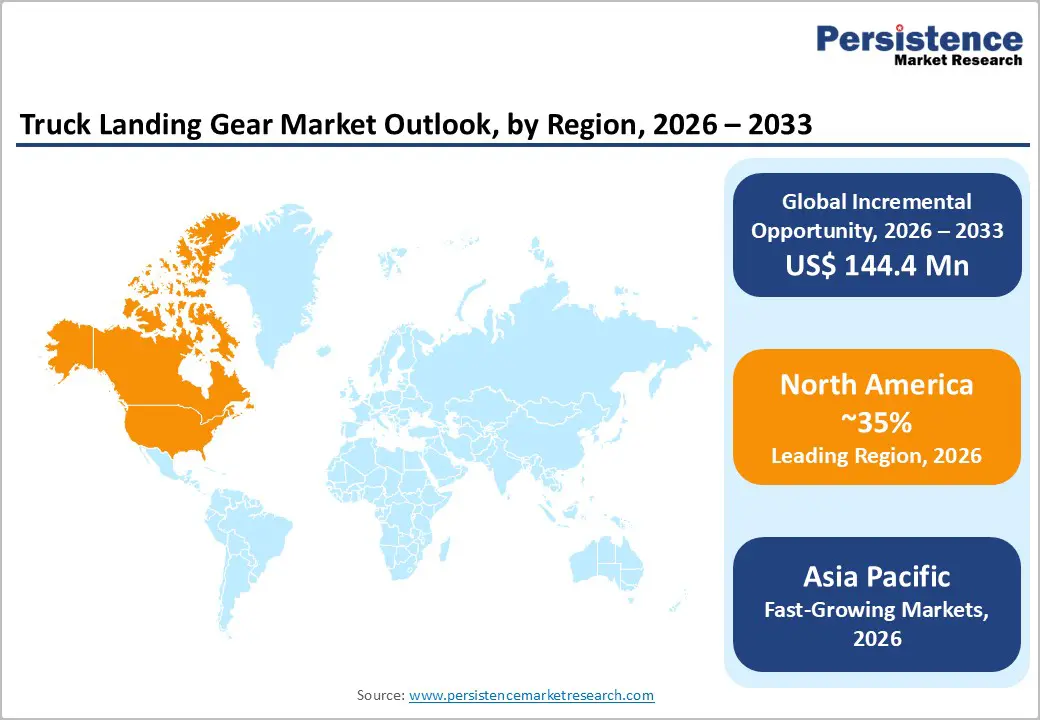
- North America leads regional markets with 35% share, Europe holds 25%, while Asia-Pacific demonstrates the highest growth momentum at 5.6% CAGR, driven by commercial fleet expansion.
- Strategic M&A activities, OEM platform partnerships, and technology integration initiatives are consolidating the competitive landscape, with a focus on automated systems and fleet telematics connectivity.
| Key Insights | Details |
|---|---|
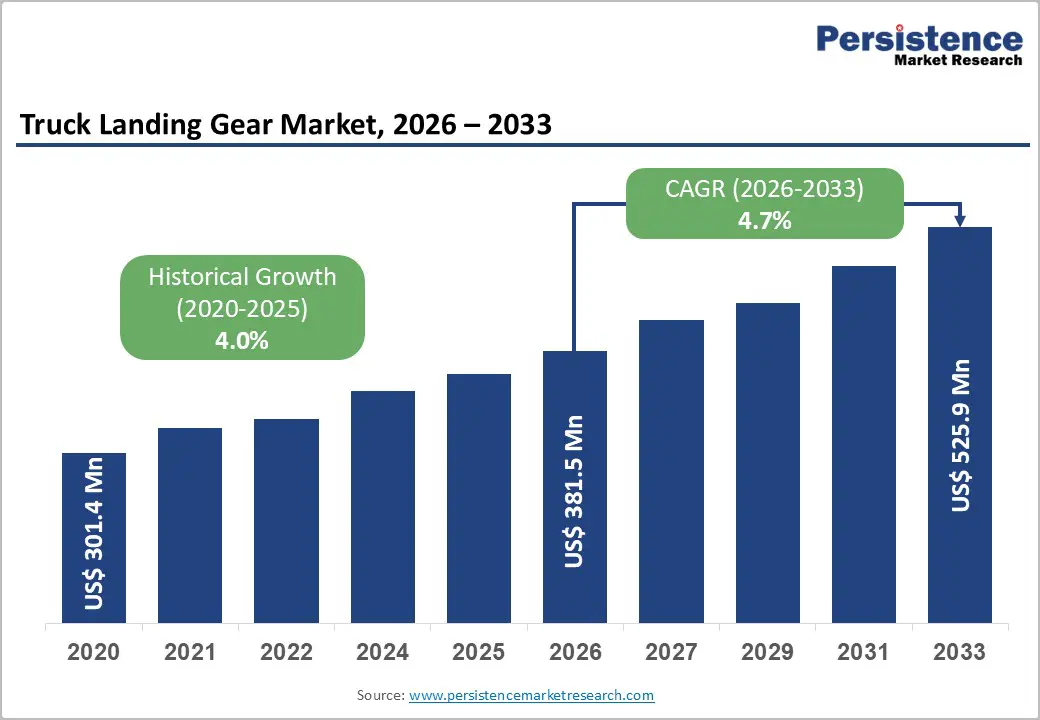
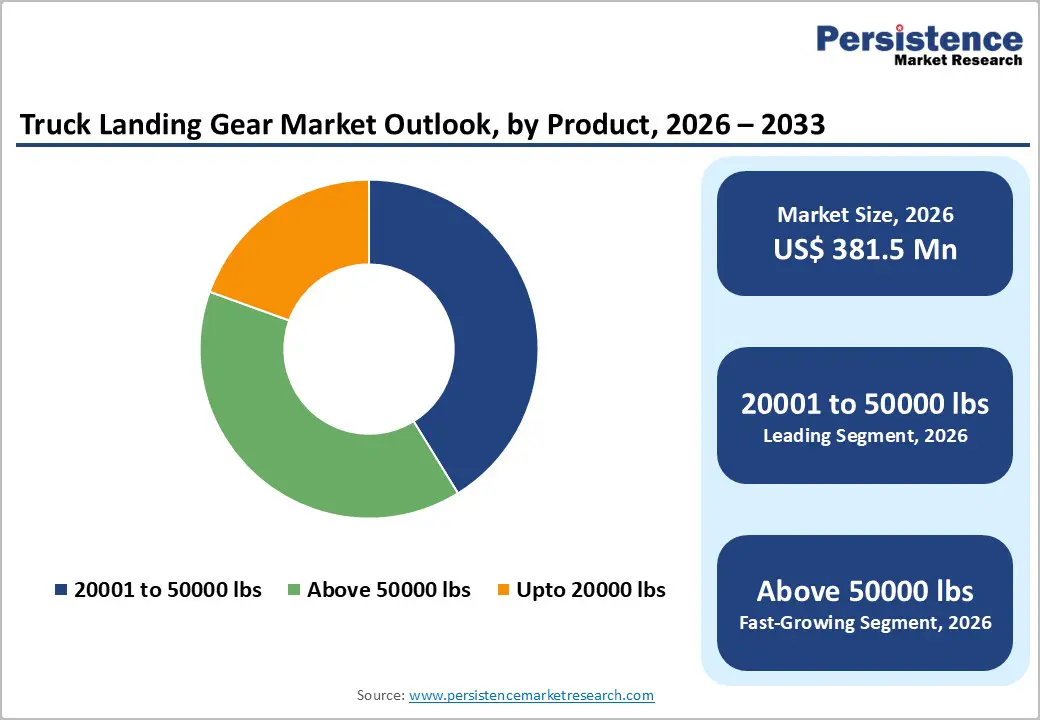
| Truck Landing Gear Market Size (2026E) | US$ 381.5 million |
| Market Value Forecast (2033F) | US$ 525.9 million |
| Projected Growth CAGR (2026 - 2033) | 4.7% |
| Historical Market Growth (2020 - 2025) | 4.0% |
Market Dynamics Analysis
Drivers - Expanding Global Commercial Vehicle Fleet and Logistics Growth
The global commercial vehicle fleet has experienced sustained expansion, with approximately 40 million heavy-duty trucks operating worldwide as of 2025, supporting logistics, construction, and transportation industries. International Road Transport Union (IRU) data indicate that commercial vehicle registrations grew at 3.2% annually between 2020 and 2025, with projected acceleration to 4.1% through 2033 in the Asia-Pacific and emerging markets. Fleet modernization initiatives, particularly in developing nations that are implementing stricter emission standards and safety protocols, necessitate replacing aging landing gear systems with advanced variants.
The surge in e-commerce and last-mile delivery requirements has increased truck utilization, extending operational hours and accelerating component wear cycles, necessitating frequent maintenance and replacement. Government infrastructure development programs across India, Southeast Asia, and Africa are expanding transportation corridors, creating incremental demand for commercial vehicles and associated landing gear systems. Market data indicate that commercial vehicle production reached 28.5 million units globally in 2024, with demand for landing gear systems increasing proportionally across OEM supply chains and aftermarket service channels.
Regulatory Mandates for Safety Systems and Automated Technologies
Stringent regulatory frameworks governing commercial vehicle safety, such as the European Union's General Safety Regulation (GSR) and U.S. NHTSA standards, mandate the integration of comprehensive safety systems, including advanced landing gear mechanisms. Regulations requiring electronic stability control, automated braking systems, and integrated landing gear deployment have accelerated adoption of power-operated landing gear systems, commanding 18-25% price premiums over manual variants. Federal Motor Carrier Safety Administration (FMCSA) regulations in the United States mandate regular landing gear inspections and functional testing, creating sustained aftermarket demand for replacement components and maintenance services.
European Union's Right-to-Repair directive ensures component availability and standardization, supporting competitive aftermarket segments while driving OEM innovation investments. Chinese regulatory authorities have implemented stringent commercial-vehicle safety standards aligned with European specifications, thereby expanding market opportunities for advanced landing-gear technologies across the Asia-Pacific region. Government-mandated safety certifications (e.g., ISO 9001, API standards) create barriers for low-quality manufacturers, thereby consolidating market share among ISO-compliant suppliers capable of meeting institutional procurement requirements.
Restraints - High Capital Costs and Extended Purchase Cycles
Automated landing gear systems requiring significant upfront capital investments of US$8,000-15,000 per unit restrict fleet replacement velocity, particularly among small and medium-sized trucking operators constrained by working capital limitations. Extended vehicle purchase cycles averaging 5-7 years reduce near-term replacement demand for landing gear systems bundled with new truck acquisitions, creating customer resistance to component upgrades on existing fleets.
Financing constraints among independent trucking operators in emerging markets limit access to premium automated systems, thereby supporting demand for cost-competitive manual variants that command lower price points despite inferior operational efficiency. Economic downturns impacting logistics demand, as evidenced during the 2020 - 2021 pandemic disruptions, reduced fleet utilization by 18-22%, compressing capital spending on vehicle modernization and maintenance services. Competitive pricing pressure from low-cost manufacturers in South Asian markets offering manual landing gear systems at 35-45% discount to branded equivalents constrains profit margins and OEM pricing strategies.
Supply Chain Disruptions and Raw Material Cost Volatility
Global supply chain vulnerabilities exposed following geopolitical tensions have increased procurement costs for specialty steel and aluminum components by 22-28%, introducing cost pressures across manufacturing and assembly operations. Semiconductor supply constraints affecting sensor-integrated automated systems have created production bottlenecks, thereby limiting the availability of advanced landing gear variants during peak-demand periods. Transportation cost inflation, averaging 14% annually since 2022, has increased logistics expenses for component distribution to geographically dispersed dealer networks, thereby constraining competitive pricing flexibility. Lead time extensions for critical components increased from 6-8 weeks (pre-pandemic) to 14-18 weeks (2024 - 2025), creating inventory management challenges and extended customer delivery timelines, reducing market responsiveness.
Opportunities - Emerging Market Expansion in South Asia and ASEAN Regions
India and Southeast Asian nations demonstrate substantial opportunity potential, driven by rapid commercial vehicle fleet expansion at 7.2% annual growth rates and by government infrastructure modernization initiatives, including highway development programs that expand logistics corridors. Rising disposable incomes, enabling fleet modernization investments, combined with a gradual transition from manual to automated systems, are projected to drive market growth to US$0.082 billion in South Asia by 2033. ASEAN countries, including Vietnam, Thailand, and Indonesia, characterized by expanding middle-class logistics demand and container shipping growth, demonstrate 6.8% CAGR in commercial vehicle registrations, creating incremental landing gear demand.
Market opportunity sizing indicates that South Asia and ASEAN regions represent 18% of the global market value by 2033, offering significant growth potential through premium system adoption and OEM partnership development.
Aftermarket Expansion Through Fleet Modernization and Maintenance Services
The expanding installed base of commercial vehicles, estimated at more than 40 million units globally, creates sustained aftermarket demand for replacement components, maintenance services, and system upgrades, thereby extending the lifespan of the landing gear system. Predictive maintenance technologies enabling condition-based component replacement reduce unplanned downtime by 22%, creating value propositions supporting premium aftermarket pricing and customer retention strategies. Fleet operators seeking competitive maintenance sourcing experience 4.8% annual growth in expenditure on landing gear services as utilization rates intensify and component wear cycles accelerate. The aftermarket segment opportunity is estimated at US$0.198 billion by 2033, representing 38% of total market value, with growth accelerated by maintenance cost optimization and fleet availability maximization priorities.
Category-wise Analysis
Product Type Insights
Manual landing gear dominates the market with 54% global market share, driven by cost-competitiveness and widespread adoption across small to medium-sized truck fleets. Mechanical simplicity, durability, and established supply chain relationships support sustained demand, particularly in price-sensitive emerging markets where manual systems command a 35-40% cost advantage over automated variants. Institutional buyers, including government transportation agencies and budget-constrained private fleet operators, preferentially specify manual landing gear systems to contain costs, thereby supporting market dominance in lower-value vehicle segments. Regulatory compliance requirements mandate manual operational capability as a backup to automated platforms, ensuring sustained demand regardless of the trajectory of automation adoption.
Automatic and power-operated landing gear represents the fastest-growing segment, expanding at 5.4% CAGR through 2033, driven by premium adoption among large fleet operators and OEM integration mandates. Technological advancement, reducing deployment times and enabling remote operation, combined with prioritization of safety regulations for automated systems, accelerates market penetration among logistics providers, thereby maximizing operational efficiency and driver safety.
Lifting Capacity Insights
The 20001 to 50000 lbs lifting capacity segment commands 41% market share, reflecting dominant commercial truck specifications accommodating typical trailer weight distributions and axle load requirements. Medium-capacity landing gear systems standardized across light to medium-duty commercial platforms represent the largest addressable market segment, supported by extensive OEM integration and established aftermarket service networks. Regulatory axle weight limits of 40000 lbs in North America and 44000 lbs in Europe have standardized landing gear specifications within this capacity range, driving standardized component manufacturing and interchangeability across regional markets.
The segment with a capacity above 50000 lbs emerges as the fastest-growing category, expanding at a 5.2% CAGR through 2033, driven by heavy-haul specialist applications and mega-trailer configurations that require enhanced load-bearing systems. Specialized mining, construction, and logistics applications that utilize articulated vehicles and multi-axle platforms drive demand for heavy-capacity landing gear systems, which command 22-28% price premiums, supporting margin expansion.
Sales Channel Insights
OEM sales channels account for 58% of the market, reflecting original equipment manufacturer integration during truck production and assembly. Contractual OEM relationships with major truck manufacturers (Volvo, Daimler, Scania, Paccar, Hino) ensure sustained demand through production-volume commitments and platform-standardization requirements. Quality assurance standards and certification requirements mandated by OEM supply chain management create barriers protecting established suppliers from competitive displacement. OEM channel profitability advantages, through volume commitments and long-term contracts, support manufacturers' investment in advanced technologies and geographic capacity expansion.
Aftermarket sales channel represents fastest-growing segment, expanding at 5.2% CAGR through 2033, driven by replacement demand from aging fleet components and maintenance service expansion. Extended commercial vehicle fleet lifespans averaging 12-15 years create sustained aftermarket opportunity as original landing gear systems deteriorate and require replacement. Independent service networks and specialty aftermarket suppliers capturing price-sensitive customers seeking cost-competitive replacement options drive market share gains from OEM supplier relationships.
Regional Market Insights
North America Truck Landing Gear Market Trends
North America dominates the global market, accounting for approximately 35% of the market, supported by a mature commercial vehicle fleet of 15.8 million heavy-duty trucks. Market growth is accelerating, driven by fleet modernization initiatives that address aging vehicle populations and by stringent NHTSA safety regulations mandating advanced landing gear systems. United States market leadership reflects established OEM partnerships with Paccar, Volvo, and Daimler platforms, supporting high-volume production integration. The expansion of the commercial trucking sector, driven by e-commerce logistics demand and infrastructure investment programs, sustains replacement component demand across OEM and aftermarket channels.
The North American competitive landscape features consolidated OEM-supplier relationships and established aftermarket service networks that support regional dominance. Prioritizing the regulatory framework for safety system integration drives the adoption of premium automated systems, supporting margin expansion and technology investment. Fleet electrification initiatives pose challenges for integrating landing gear with electric vehicle platforms, creating opportunities for suppliers to develop compatible system solutions.
Europe Truck Landing Gear Market Trends
Europe commands a 25% global market share, with a steady growth trajectory of 3.7% CAGR through 2033. Market dynamics reflect a mature commercial fleet of 5.2 million registered heavy-duty trucks and a stringent EU regulatory environment that prioritizes emissions reduction and safety-system standardization. Germany leads the regional market with 4.1% CAGR driven by premium vehicle manufacturing and an innovation-focused supplier ecosystem. The United Kingdom demonstrates 3.4% growth supporting premium automation adoption, while France and Spain follow a regional trajectory with 3.2-3.5% CAGR supported by logistics sector expansion.
European regulatory harmonization under the EU General Safety Regulation establishes standardized landing-gear specifications, reducing regional fragmentation and supporting supply-chain consolidation. Commercial segment expansion through construction and infrastructure development programs generates sustained demand across specialty vehicle applications. The competitive landscape features established European manufacturers (Jost, FUWA) and emerging supply chain partnerships that support innovation investment and margin defense.
Asia Pacific Truck Landing Gear Market Trends
Asia-Pacific region demonstrates accelerating growth momentum with 5.6% CAGR through 2033, emerging as the highest-growth region driven by commercial vehicle fleet expansion and logistics infrastructure modernization. China maintains a substantial market presence with 5.1% CAGR supported by 25.6 million commercial vehicles and government infrastructure development initiatives. India emerges as fastest-growing country with 8.4% CAGR propelled by rapid urbanization, e-commerce logistics expansion, and government highway development programs. Japan demonstrates mature market characteristics with 2.3% growth trajectory reflecting high fleet penetration and premium automation adoption.
The Asia-Pacific competitive landscape features dominance by multinational manufacturers through established OEM relationships, offset by emerging regional suppliers capturing cost-sensitive segments. Manufacturing advantages, including lower production costs and proximity to component supply chains, enable regional manufacturers to achieve competitive pricing while supporting OEM supply chain integration. Investment trends prioritize geographic capacity expansion, supporting production volume growth and emerging market distribution network development.
Competitive landscape
Market leaders employ coordinated strategies emphasizing OEM partnership consolidation, technology-driven product differentiation, and aftermarket channel expansion. Dominant themes include automation system innovation to address safety regulations, cost leadership positioning through manufacturing efficiency, and geographic market expansion to support penetration of emerging economies. Key differentiators include proprietary sensor technologies, supply chain integration advantages, and regional manufacturing capabilities that support customer proximity and delivery responsiveness. Emerging business model trends emphasize predictive maintenance platforms, fleet telematics integration, and subscription-based service offerings capturing incremental customer value beyond component sales.
Strategic Developments:
- In January 2024, Jost International introduced sensor-equipped landing gear featuring real-time load monitoring and remote deployment capabilities across European OEM platforms. Strategic significance emphasizes technology leadership and OEM integration, supporting premium positioning.
- In August 2024, SAF-Holland commissioned a new automated manufacturing facility in Germany, producing advanced landing gear systems with Industry 4.0 integration.
- Investment significance supports growth in production capacity and cost-structure optimization.
- November 2024, Wabash National expanded specialty aftermarket landing gear service centers across North American logistics hubs to capture maintenance and replacement demand. Strategic expansion addresses growing aftermarket opportunity and customer retention.
Companies Covered in Truck Landing Gear Market
- Jost International
- FUWA K-Hitch
- SAF-Holland
- Hendrickson
- Wabash National
- Paccar
- Esco Technologies
- BPW
- Actros Landing Gear
- Hyster-Yale
- Fontaine Fifth Wheel
- Logistik Ltd
- Linamar Corporation
Frequently Asked Questions
The global truck landing gear market is valued at US$381.5 Million in 2026 and projected to reach US$525.9 Million by 2033.
Market expansion stems from expanding global commercial vehicle fleet requiring 40+ million trucks, stringent safety regulations mandating automated landing gear systems, and rapid technological advancement enabling remote deployment and predictive maintenance capabilities.
The market demonstrates 4.7% CAGR through 2033.
Primary opportunities include South Asian market penetration, aftermarket expansion through fleet modernization, and autonomous vehicle platform integration.
Global market leaders include Jost International, FUWA K-Hitch, SAF-Holland, Hendrickson, Wabash National, Paccar, Esco Technologies, BPW, Actros Landing Gear, Hyster-Yale, Fontaine Fifth Wheel, Logistik Ltd, and Linamar Corporation.


