

- Executive Summary
- Global Medical Implants Sterile Packaging Market Snapshot 2026 and 2033
- Market Opportunity Assessment, 2026 - 2033, US$ Bn
- Key Market Trends
- Industry Developments and Key Market Events
- Demand Side and Supply Side Analysis
- PMR Analysis and Recommendations
- Market Overview
- Market Scope and Definitions
- Market Dynamics
- Driver
- Restraint
- Opportunities
- Trends
- Macro-Economic Factors
- Global GDP Outlook
- Global Prison Growth Outlook
- Global Crime Rates by Country
- Global Prison Population by Country
- Global Private Prison Market Growth Outlook
- Other Macro-economic Factors
- Forecast Factors - Relevance and Impact
- COVID-19 Impact Assessment
- Value Added Insights
- Value Chain analysis
- Key Market Players
- Product Adoption Analysis
- Key Promotional Strategies by key players
- PESTLE Analysis
- Porter's Five Forces Analysis
- Regulatory and Technology Landscape
- Price Trend Analysis, 2025
- Region-wise Price Analysis
- Price by Segments
- Price Impact Factors
- Global Medical Implants Sterile Packaging Market Outlook: Historical (2020 - 2025) and Forecast (2026 - 2033)
- Key Highlights
- Global Medical Implants Sterile Packaging Market Outlook: Packaging Type
- Introduction/Key Findings
- Historical Market Size (US$ Bn) and Volume (Units) Analysis by Packaging Type, 2020-2025
- Current Market Size (US$ Bn) and Volume (Units) Forecast, by Packaging Type, 2026-2033
- Pouches & Bags
- Trays
- Blister Packs
- Clamshells
- Boxes & Cartons
- Others
- Market Attractiveness Analysis: Packaging Type
- Global Medical Implants Sterile Packaging Market Outlook: Material Types
- Introduction/Key Findings
- Historical Market Size (US$ Bn) and Volume (Units) Analysis by Material Types, 2020-2025
- Current Market Size (US$ Bn) and Volume (Units) Forecast, by Material Types, 2026-2033
- Plastic
- Paper
- Foil
- Others
- Market Attractiveness Analysis: Material Types
- Global Medical Implants Sterile Packaging Market Outlook: Implant Type
- Introduction/Key Findings
- Historical Market Size (US$ Bn) and Volume (Units) Analysis by Implant Type, 2020-2025
- Current Market Size (US$ Bn) and Volume (Units) Forecast, by Implant Type, 2026-2033
- Orthopedic Implants
- Dental Implants
- Cardiovascular Implants
- Neurological Implants
- Ophthalmic Implants
- Others
- Market Attractiveness Analysis: Implant Type
- Global Medical Implants Sterile Packaging Market Outlook: End User
- Introduction/Key Findings
- Historical Market Size (US$ Bn) and Volume (Units) Analysis by End User, 2020-2025
- Current Market Size (US$ Bn) and Volume (Units) Forecast, by End User, 2026-2033
- Medical Device Manufacturers
- Hospitals & Surgical Centers
- Dental Clinics
- Orthopedic Clinics
- Contract Sterilization Providers
- Others
- Market Attractiveness Analysis: End User
- Global Medical Implants Sterile Packaging Market Outlook: Region
- Key Highlights
- Historical Market Size (US$ Bn) and Volume (Units) Analysis by Region, 2020-2025
- Current Market Size (US$ Bn) and Volume (Units) Forecast, by Region, 2026-2033
- North America
- Europe
- East Asia
- South Asia & Oceania
- Latin America
- Middle East & Africa
- Market Attractiveness Analysis: Region
- North America Medical Implants Sterile Packaging Market Outlook: Historical (2020 - 2025) and Forecast (2026 - 2033)
- Key Highlights
- Pricing Analysis
- North America Market Size (US$ Bn) and Volume (Units) Forecast, by Country, 2026-2033
- U.S.
- Canada
- North America Market Size (US$ Bn) and Volume (Units) Forecast, by Packaging Type, 2026-2033
- Pouches & Bags
- Trays
- Blister Packs
- Clamshells
- Boxes & Cartons
- Others
- North America Market Size (US$ Bn) and Volume (Units) Forecast, by Material Types, 2026-2033
- Plastic
- Paper
- Foil
- Others
- North America Market Size (US$ Bn) and Volume (Units) Forecast, by Implant Type, 2026-2033
- Orthopedic Implants
- Dental Implants
- Cardiovascular Implants
- Neurological Implants
- Ophthalmic Implants
- Others
- North America Market Size (US$ Bn) and Volume (Units) Forecast, by End User, 2026-2033
- Medical Device Manufacturers
- Hospitals & Surgical Centers
- Dental Clinics
- Orthopedic Clinics
- Contract Sterilization Providers
- Others
- Europe Medical Implants Sterile Packaging Market Outlook: Historical (2020 - 2025) and Forecast (2026 - 2033)
- Key Highlights
- Pricing Analysis
- Europe Market Size (US$ Bn) and Volume (Units) Forecast, by Country, 2026-2033
- Germany
- Italy
- France
- U.K.
- Spain
- Russia
- Rest of Europe
- Europe Market Size (US$ Bn) and Volume (Units) Forecast, by Packaging Type, 2026-2033
- Pouches & Bags
- Trays
- Blister Packs
- Clamshells
- Boxes & Cartons
- Others
- Europe Market Size (US$ Bn) and Volume (Units) Forecast, by Material Types, 2026-2033
- Plastic
- Paper
- Foil
- Others
- Europe Market Size (US$ Bn) and Volume (Units) Forecast, by Implant Type, 2026-2033
- Orthopedic Implants
- Dental Implants
- Cardiovascular Implants
- Neurological Implants
- Ophthalmic Implants
- Others
- Europe Market Size (US$ Bn) and Volume (Units) Forecast, by End User, 2026-2033
- Medical Device Manufacturers
- Hospitals & Surgical Centers
- Dental Clinics
- Orthopedic Clinics
- Contract Sterilization Providers
- Others
- East Asia Medical Implants Sterile Packaging Market Outlook: Historical (2020 - 2025) and Forecast (2026 - 2033)
- Key Highlights
- Pricing Analysis
- East Asia Market Size (US$ Bn) and Volume (Units) Forecast, by Country, 2026-2033
- China
- Japan
- South Korea
- East Asia Market Size (US$ Bn) and Volume (Units) Forecast, by Packaging Type, 2026-2033
- Pouches & Bags
- Trays
- Blister Packs
- Clamshells
- Boxes & Cartons
- Others
- East Asia Market Size (US$ Bn) and Volume (Units) Forecast, by Material Types, 2026-2033
- Plastic
- Paper
- Foil
- Others
- East Asia Market Size (US$ Bn) and Volume (Units) Forecast, by Implant Type, 2026-2033
- Orthopedic Implants
- Dental Implants
- Cardiovascular Implants
- Neurological Implants
- Ophthalmic Implants
- Others
- East Asia Market Size (US$ Bn) and Volume (Units) Forecast, by End User, 2026-2033
- Medical Device Manufacturers
- Hospitals & Surgical Centers
- Dental Clinics
- Orthopedic Clinics
- Contract Sterilization Providers
- Others
- South Asia & Oceania Medical Implants Sterile Packaging Market Outlook: Historical (2020 - 2025) and Forecast (2026 - 2033)
- Key Highlights
- Pricing Analysis
- South Asia & Oceania Market Size (US$ Bn) and Volume (Units) Forecast, by Country, 2026-2033
- India
- Southeast Asia
- ANZ
- Rest of SAO
- South Asia & Oceania Market Size (US$ Bn) and Volume (Units) Forecast, by Packaging Type, 2026-2033
- Pouches & Bags
- Trays
- Blister Packs
- Clamshells
- Boxes & Cartons
- Others
- South Asia & Oceania Market Size (US$ Bn) and Volume (Units) Forecast, by Material Types, 2026-2033
- Plastic
- Paper
- Foil
- Others
- South Asia & Oceania Market Size (US$ Bn) and Volume (Units) Forecast, by Implant Type, 2026-2033
- Orthopedic Implants
- Dental Implants
- Cardiovascular Implants
- Neurological Implants
- Ophthalmic Implants
- Others
- South Asia & Oceania Market Size (US$ Bn) and Volume (Units) Forecast, by End User, 2026-2033
- Medical Device Manufacturers
- Hospitals & Surgical Centers
- Dental Clinics
- Orthopedic Clinics
- Contract Sterilization Providers
- Others
- Latin America Medical Implants Sterile Packaging Market Outlook: Historical (2020 - 2025) and Forecast (2026 - 2033)
- Key Highlights
- Pricing Analysis
- Latin America Market Size (US$ Bn) and Volume (Units) Forecast, by Country, 2026-2033
- Brazil
- Mexico
- Rest of LATAM
- Latin America Market Size (US$ Bn) and Volume (Units) Forecast, by Packaging Type, 2026-2033
- Pouches & Bags
- Trays
- Blister Packs
- Clamshells
- Boxes & Cartons
- Others
- Latin America Market Size (US$ Bn) and Volume (Units) Forecast, by Material Types, 2026-2033
- Plastic
- Paper
- Foil
- Others
- Latin America Market Size (US$ Bn) and Volume (Units) Forecast, by Implant Type, 2026-2033
- Orthopedic Implants
- Dental Implants
- Cardiovascular Implants
- Neurological Implants
- Ophthalmic Implants
- Others
- Latin America Market Size (US$ Bn) and Volume (Units) Forecast, by End User, 2026-2033
- Medical Device Manufacturers
- Hospitals & Surgical Centers
- Dental Clinics
- Orthopedic Clinics
- Contract Sterilization Providers
- Others
- Middle East & Africa Medical Implants Sterile Packaging Market Outlook: Historical (2020 - 2025) and Forecast (2026 - 2033)
- Key Highlights
- Pricing Analysis
- Middle East & Africa Market Size (US$ Bn) and Volume (Units) Forecast, by Country, 2026-2033
- GCC Countries
- South Africa
- Northern Africa
- Rest of MEA
- Middle East & Africa Market Size (US$ Bn) and Volume (Units) Forecast, by Packaging Type, 2026-2033
- Pouches & Bags
- Trays
- Blister Packs
- Clamshells
- Boxes & Cartons
- Others
- Middle East & Africa Market Size (US$ Bn) and Volume (Units) Forecast, by Material Types, 2026-2033
- Plastic
- Paper
- Foil
- Others
- Middle East & Africa Market Size (US$ Bn) and Volume (Units) Forecast, by Implant Type, 2026-2033
- Orthopedic Implants
- Dental Implants
- Cardiovascular Implants
- Neurological Implants
- Ophthalmic Implants
- Others
- Middle East & Africa Market Size (US$ Bn) and Volume (Units) Forecast, by End User, 2026-2033
- Medical Device Manufacturers
- Hospitals & Surgical Centers
- Dental Clinics
- Orthopedic Clinics
- Contract Sterilization Providers
- Others
- Competition Landscape
- Market Share Analysis, 2025
- Market Structure
- Competition Intensity Mapping
- Competition Dashboard
- Company Profiles
- Amcor
- Company Overview
- Product Portfolio/Offerings
- Key Financials
- SWOT Analysis
- Company Strategy and Key Developments
- DuPont
- Berry Global
- WestRock
- Nelipak Healthcare Packaging
- Oliver Healthcare Packaging
- Tekni-Plex
- SteriPack Group
- Klöckner Pentaplast
- Wipak Group
- Sealed Air
- Placon Corporation
- Sonoco Products Company
- 3M
- Riverside Medical Packaging
- Amcor
- Appendix
- Research Methodology
- Research Assumptions
- Acronyms and Abbreviations


- Non-food Packaging
- Medical Implants Sterile Packaging Market
Medical Implants Sterile Packaging Market Size, Share, and Growth Forecast 2026 - 2033
Medical Implants Sterile Packaging Market by Packaging Type (Pouches & Bags, Trays, Blister Packs, Clamshells, Boxes & Cartons, Others), Material types (Plastic, Paper, Foil, Others), Implant Type (Orthopedic Implants, Dental Implants, Cardiovascular Implants, Neurological Implants, Ophthalmic Implants, Others), End-user, and Regional Analysis, 2026 - 2033
Medical Implants Sterile Packaging Market Size and Trend Analysis
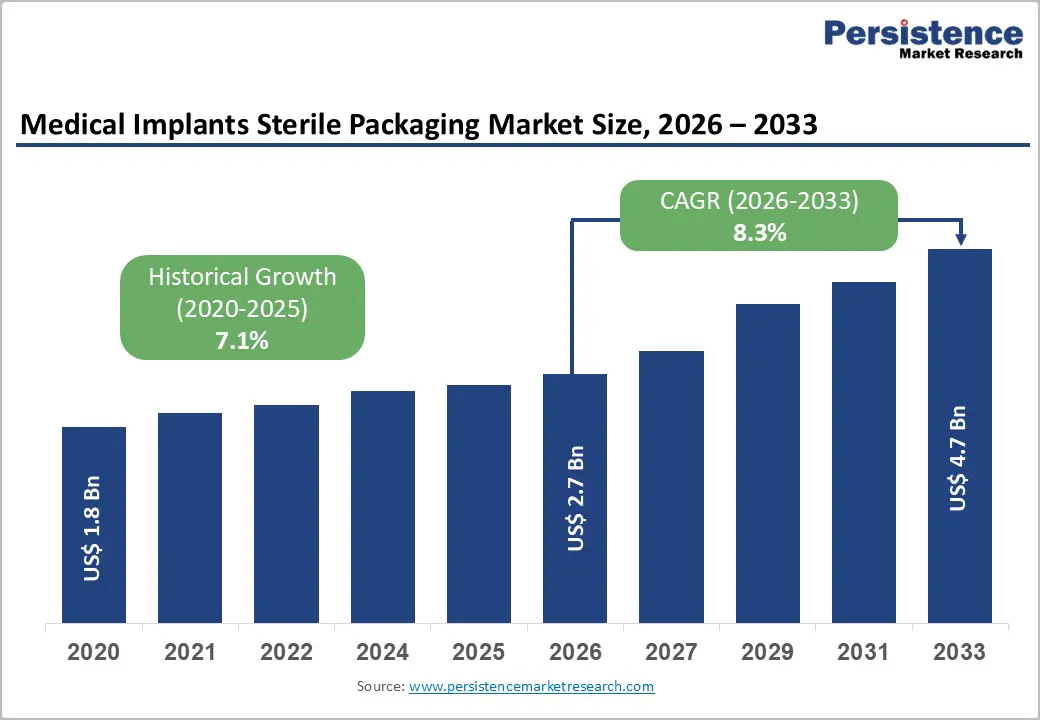
The global medical implants sterile packaging market size is expected to be valued at US$ 2.7 billion in 2026 and projected to reach US$ 4.7 billion by 2033, growing at a CAGR of 8.3% between 2026 and 2033.
This growth is driven by the rising demand for medical implants worldwide, fueled by an aging population and increasing prevalence of chronic diseases. More than 1.5 billion people are projected to be aged 60+ by 2050, increasing demand for orthopedic and cardiovascular implants. Advances in minimally invasive surgeries and stringent sterility regulations further accelerate the adoption of specialized sterile packaging, supporting sustained market expansion.
Key Industry Highlights:
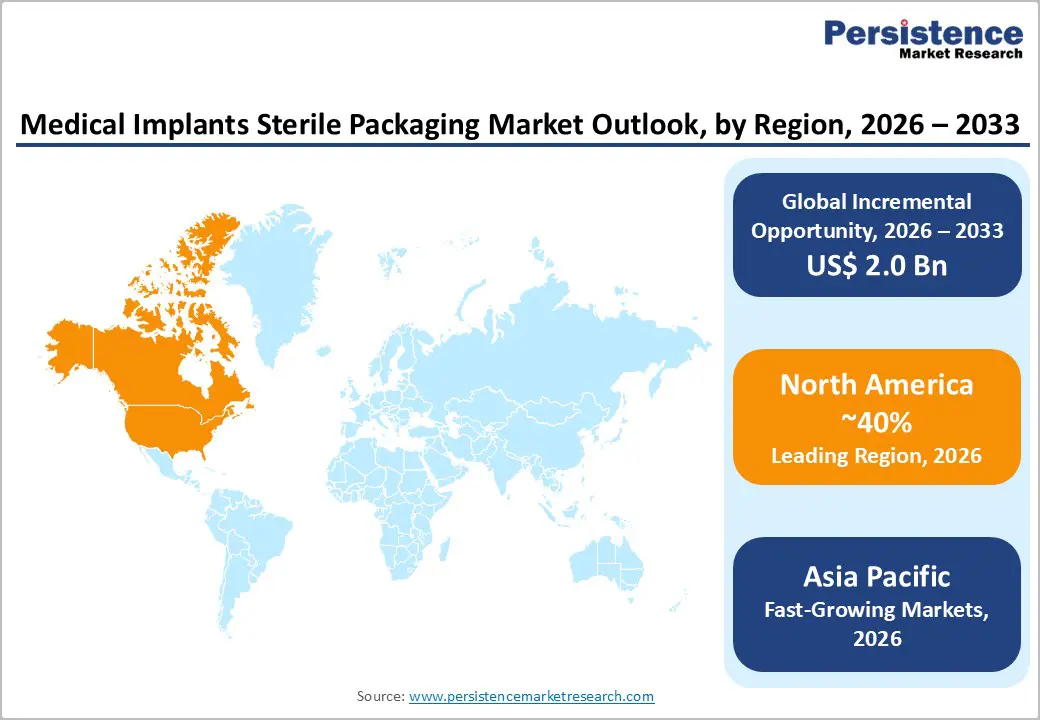
- Leading Region: North America dominates the Medical Implants Sterile Packaging Market, accounting for 40% of the market in 2025, driven by U.S. regulatory leadership and high implant volumes exceeding 2 million annually.
- Fastest-Growing Region: Asia Pacific is the fastest-growing region, with a 32% share in 2025, driven by healthcare expansion in China and India and manufacturing efficiencies.
- Leading Packaging Type: Trays account for 35% of the packaging segment in 2025 and are ideal for orthopedic implants due to their rigidity, modularity, and ISO 11607-1 compliance.
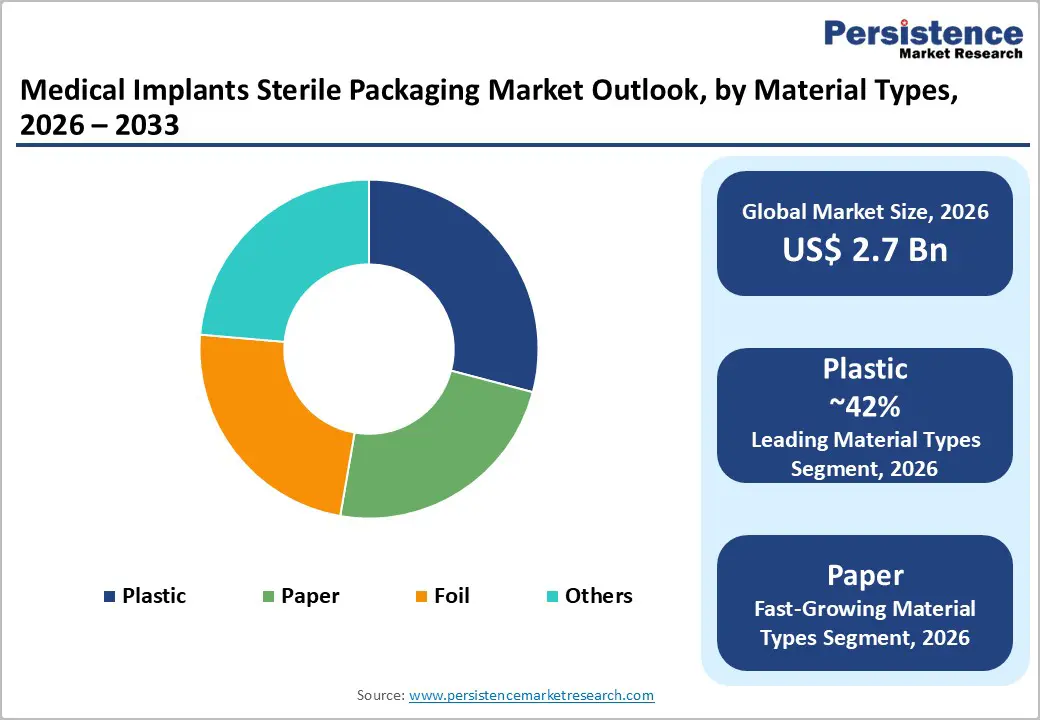
- Leading Material Type: Plastic dominates material usage, accounting for 42% of the market in 2025, owing to its cost-effectiveness and radiation resistance, particularly in dental implant packaging.
- Key Opportunity Segment: Sustainable packaging presents significant growth potential, targeting environmental mandates with biodegradable and recyclable options in emerging markets.
| Key Insights | Details |
|---|---|
| Medical Implants Sterile Packaging Size (2026E) | US$ 2.7 billion |
| Market Value Forecast (2033F) | US$ 4.7 billion |
| Projected Growth CAGR (2026 - 2033) | 8.3% |
| Historical Market Growth (2020 - 2025) | 7.1% |
Market Dynamics
Drivers - Surging Demand for Orthopedic and Joint Replacement Procedures Fueling Sterile Packaging Growth
The rapid rise in orthopedic implant procedures is a key driver for the sterile packaging market. Globally, over 2.5 million hip and knee replacements are performed annually, according to the International Society of Hip and Knee Surgeons. This surge necessitates packaging that ensures sterility to prevent surgical site infections, which affect 2-5% of procedures, as reported by the Centers for Disease Control and Prevention.
Innovations in breathable films and high-performance materials enhance barrier properties and comply with ISO 11607 standards for sterile barrier systems. Manufacturers increasingly adopt rigid trays that maintain seal integrity during gamma radiation sterilization, transport, and storage, ensuring safety and regulatory compliance. These advancements strengthen market growth by addressing the needs of high-volume orthopedic surgeries.
Technological Advancements in Sterilization Methods Driving Specialized Packaging Adoption
Advances in sterilization technologies are significantly increasing demand for advanced sterile packaging. Methods such as ethylene oxide and gamma irradiation are widely used; the Association for the Advancement of Medical Instrumentation reports that gamma irradiation sterilizes nearly 70% of medical devices, which require compatible packaging materials to maintain sterility.
Recent approvals by the U.S. Nuclear Regulatory Commission for electron-beam sterilization have reduced sterilization cycle times by up to 50%, thereby enabling faster processing. These advancements drive the adoption of specialized pouches and trays made from radiation-resistant polyesters and other materials that preserve microbial-barrier performance throughout the supply chain, thereby expanding the sterile packaging sector for medical implants.
Restraints - High Production Costs and Material Price Volatility Limiting Market Expansion
Rising raw material costs are a significant restraint for the sterile packaging market. According to Plastics Europe, plastic resin prices increased by 20-30% in 2024 due to supply chain disruptions, raising packaging expenses by approximately 15%. These costs are particularly challenging for small and mid-sized manufacturers producing foil and plastic laminates essential for microbial barrier protection.
Volatility in petrochemical feedstocks creates pricing unpredictability, forcing companies to carefully balance quality and cost efficiency. Additionally, compliance with FDA and EU MDR requirements entails additional validation and certification costs, thereby limiting scalability. These factors collectively constrain production flexibility, slow market entry for new players, and challenge profitability in a price-sensitive segment of medical implants' sterile packaging.
Stringent Global Regulatory Compliance Slowing Innovation and Adoption
Stringent regulatory frameworks worldwide pose challenges for sterile packaging manufacturers. The European Medicines Agency’s MDR 2017/745 mandates extensive packaging validation, often delaying product launches by 12-18 months. Similarly, FDA regulations under 21 CFR Part 820 require full traceability, raising compliance costs by 10-20% and creating substantial entry barriers for smaller firms.
Ongoing revalidation for any material changes further complicates supply chain management. These rigorous requirements slow the adoption of innovative sterile packaging solutions, limit flexibility in design and material selection, and increase time-to-market, making it difficult for manufacturers to quickly respond to rising demand in the medical implants sector.
Opportunity -Expansion into Emerging Markets Driven by Rising Healthcare Access and Implant Demand
Emerging economies present significant growth opportunities for the sterile packaging market due to increasing healthcare access. Asia-Pacific healthcare spending grew at an annual rate of 12% between 2020 and 2025, thereby increasing demand for medical implants. Programs such as India’s Ayushman Bharat, which covers 500 million people, are increasing the volume of orthopedic procedures.
Companies focusing on specialized pouches and trays for orthopedic and cardiovascular implants can capitalize on this trend. Regulatory approvals, such as China’s National Medical Products Administration authorizing 25% more implant devices in 2024, coupled with local manufacturing hubs, reduce logistics costs and improve compliance, enabling efficient market penetration and regional expansion for packaging manufacturers.
Adoption of Sustainable and Eco-Friendly Packaging Solutions
Sustainability trends are creating new growth avenues for the sterile packaging of medical implants. The Ellen MacArthur Foundation projects that up to 80% of medical packaging could transition to recyclable materials by 2030, prompting demand for eco-friendly alternatives. Paper-based sterile barriers that meet USP Class VI standards enable manufacturers to comply without relying on conventional plastics.
Regulations like the EU Single-Use Plastics Directive incentivize innovation in biodegradable foils and bio-based polymers for cardiovascular and orthopedic implants. These materials maintain microbial-barrier performance while supporting circular-economy goals. Manufacturers investing in sustainable solutions can differentiate their offerings, meet regulatory expectations, and capitalize on the high-growth potential in the eco-conscious medical device market.
Category-wise Analysis
Packaging Type Insights
Trays lead the market with a 35% share in 2025, particularly favored for orthopedic implants due to their rigid structure and stackability. Compliance with ISO 11607-1 ensures seal integrity, critical for procedures like over 1 million annual spinal fusions worldwide. Trays accommodate complex implant geometries, reducing contamination risks by up to 40% during handling, according to AAMI guidelines. PETG and polycarbonate materials enhance durability, allowing repeated autoclaving while maintaining barrier properties.
Flexible packaging, such as pouches, is the fastest-growing segment, driven by the rise of minimally invasive procedures and single-use implants. Pouches provide ease of aseptic presentation, lower storage space requirements, and adaptability to diverse implant sizes. Their compatibility with multiple sterilization methods and lightweight nature make them increasingly preferred in high-volume hospital sterilization workflows.
Material Types Insights
Plastic dominates the market, with a 42% share in 2025, owing to its durability, transparency, and cost-effectiveness in blister packs. FDA-approved polyethylene and polypropylene are biocompatible and account for approximately 75% of dental implant packaging. Radiation-resistant plastics such as PETG offer high puncture resistance, while multilayer coextrusions improve moisture-barrier performance, thereby ensuring microbial protection during storage and sterilization.
Innovative biodegradable and paper-based materials are the fastest-growing category, responding to sustainability trends and regulatory mandates like the EU Single-Use Plastics Directive. These eco-friendly solutions maintain barrier integrity while reducing environmental impact, gaining traction among medical device manufacturers focused on circular economy goals.
Implant Type Insights
Orthopedic implants lead with a 38% share in 2025, driven by aging populations and rising musculoskeletal disorders. WHO reports 1.71 billion global cases, fueling demand for hip and knee replacements. Packaging for these implants must endure autoclaving, with trays preferred for modular designs that secure complex geometries and ensure sterility across high-volume surgical centers.
Cardiovascular and dental implants are the fastest-growing segments, reflecting the expansion of minimally invasive procedures and the rising prevalence of chronic diseases. Customized packaging solutions for small, delicate devices support aseptic handling, reduce contamination risks, and enable rapid adoption in hospitals and specialty clinics.
End-user Insights
Medical device manufacturers hold 45% market share in 2025, as the primary purchasers of sterile packaging. They produce roughly 80% of sterile implants, necessitating scalable, customizable solutions such as pouches and rigid trays. Integration with in-house sterilization processes and bulk formats optimizes production efficiency while ensuring compliance with FDA validation requirements.
Hospitals and surgical centers represent the fastest-growing end-user segment, driven by the expansion of implant procedures and the adoption of pre-sterilized, ready-to-use implants. Their demand for user-friendly packaging that supports aseptic presentation and minimizes handling errors is increasing rapidly, creating growth opportunities for packaging suppliers.
Regional Insights
North America Medical Implants Sterile Packaging Market Trends
North America leads the market with a 40% share in 2025, driven by U.S. innovation and robust adoption of advanced sterile packaging solutions. FDA 510(k) clearances for sterile packaging increased by 18% in 2024, supporting advances in tray and pouch packaging. MedTech hubs such as Boston foster R&D, ensuring regulatory compliance while enabling product differentiation.
The U.S. accounts for approximately 35% of global orthopedic implant procedures, with more than 2 million hip and knee replacements annually. High reimbursement rates and favorable healthcare policies accelerate adoption of premium sterile packaging. Hospitals and manufacturers increasingly prefer pre-sterilized, ready-to-use implants, solidifying North America’s leadership in the medical implants sterile packaging market through 2033.
Europe Medical Implants Sterile Packaging Market Trends
Europe holds a significant market position, with growth driven by regulatory harmonization under MDR and a strong focus on sustainability. Orthopedic packaging demand is high in Germany, where TÜV SÜD certifications enhance export potential. Procedure volumes in the UK and France are increasing by approximately 12% annually, according to Eurostat data.
The European Union’s Single-Use Plastics Directive and strict post-market surveillance requirements promote innovation in eco-friendly packaging solutions, including recycled materials and biodegradable foils for cardiovascular and neurological implants. These factors support a steady CAGR of 8.1%, ensuring continued expansion of the European medical implants sterile packaging market while emphasizing high-quality and compliant solutions.
Asia Pacific Medical Implants Sterile Packaging Market Trends
Asia-Pacific accounts for 32% of the market in 2025 and is the fastest-growing region, with a 9.5% CAGR (2026-2033), driven by China and India. Approvals for implant devices by China’s National Medical Products Administration surged 30% in 2025, while India’s Ayushman Bharat scheme covers 500 million beneficiaries, expanding surgical implant volumes.
Regional manufacturing hubs offer cost advantages, with Japan excelling in the production of precision foils for sterile trays and pouches. Rising middle-class populations across ASEAN countries increase healthcare spending, driving demand for orthopedic, cardiovascular, and dental implants. Streamlined regulatory pathways and local production facilities attract global manufacturers, positioning the Asia Pacific as a high-growth market for medical implants and sterile packaging.
Competitive Landscape
The medical implants sterile packaging market is moderately consolidated, with top players controlling around 60% of the share through strong R&D, mergers, and strategic collaborations. Key differentiators include ISO-certified barrier technologies, automation in production, and development of specialized trays and pouches that ensure sterility and compliance with global regulations.
Emerging business models focus on contract manufacturing to enhance scalability amid stringent regulatory pressures. Companies are investing heavily in next-generation materials compatible with advanced sterilization methods while leveraging automation to reduce production costs by up to 20%. Strategic partnerships with device manufacturers secure long-term supply agreements and market stability.
Key Developments:
- In November 2025, Essentra plc launched recyclable trays for orthopedic implants, fully compliant with EU MDR requirements. These trays reduce plastic usage by 25%, offer enhanced durability during sterilization, and support sustainable packaging initiatives, meeting the growing demand for eco-friendly sterile solutions in high-volume surgical procedures.
- In March 2024, the FDA approved advanced foil pouches for cardiovascular implants, enhancing seal strength by 30% and ensuring superior sterility protection. These pouches improve handling efficiency, reduce contamination risk, and support compatibility with multiple sterilization methods, thereby strengthening market adoption of critical implant devices.
- In October 2023, ISO updated the ISO 11607 standard, prompting wider adoption of radiation-resistant plastics in sterile packaging. The revisions emphasize barrier integrity, microbial safety, and material performance during gamma and e-beam sterilization, accelerating innovation in durable and compliant packaging solutions globally.
Companies Covered in Medical Implants Sterile Packaging Market
- Amcor
- DuPont
- Berry Global
- WestRock
- Nelipak Healthcare Packaging
- Oliver Healthcare Packaging
- Tekni-Plex
- SteriPack Group
- Klöckner Pentaplast
- Wipak Group
- Sealed Air
- Placon Corporation
- Sonoco Products Company
- 3M
- Riverside Medical Packaging
Frequently Asked Questions
The medical implants sterile packaging market is expected to reach US$ 2.7 billion in 2026, growing to US$ 4.7 billion by 2033 at an 8.3% CAGR.
Demand is driven by surging orthopedic implants (2.5 million annual procedures) and advancements in sterilization technologies, supported by ISO 11607 compliance.
North America leads with 40% share in 2025, boosted by U.S. FDA regulations and an 18% rise in 510(k) clearances.
Sustainable packaging offers growth potential, especially in emerging markets, aligning with EU directives and Asia Pacific’s 32% share with 9.5% CAGR.
Leading firms include Essentra plc, Amcor plc, Berry Global Inc., focusing on compliant, innovative solutions.


