

- Executive Summary
- Global Marine Scrubber Systems Market Snapshot 2026 and 2033
- Market Opportunity Assessment, 2026 - 2033, US$ Bn
- Key Market Trends
- Industry Developments and Key Market Events
- Demand Side and Supply Side Analysis
- PMR Analysis and Recommendations
- Market Overview
- Market Scope and Definitions
- Value Chain Analysis
- Macro-Economic Factors
- Global GDP Outlook
- Global Automotive Industry Overview
- Forecast Factors - Relevance and Impact
- COVID-19 Impact Assessment
- PESTLE Analysis
- Porter's Five Forces Analysis
- Geopolitical Tensions: Market Impact
- Regulatory and Technology Landscape
- Market Dynamics
- Drivers
- Restraints
- Opportunities
- Trends
- Price Trend Analysis, 2020 - 2033
- Region-wise Price Analysis
- Price by Segments
- Price Impact Factors
- Global Marine Scrubber Systems Market Outlook: Historical (2020 - 2025) and Forecast (2026 - 2033)
- Key Highlights
- Global Marine Scrubber Systems Market Outlook: By Scrubber Type
- Introduction/Key Findings
- Historical Market Size (US$ Bn) and Volume (Units) Analysis by By Scrubber Type, 2020-2025
- Current Market Size (US$ Bn) and Volume (Units) Forecast, by By Scrubber Type, 2026-2033
- Open Loop
- Closed Loop
- Hybrid
- Market Attractiveness Analysis: By Scrubber Type
- Global Marine Scrubber Systems Market Outlook: By Installation Type
- Introduction/Key Findings
- Historical Market Size (US$ Bn) and Volume (Units) Analysis by By Installation Type, 2020-2025
- Current Market Size (US$ Bn) and Volume (Units) Forecast, by By Installation Type, 2026-2033
- Newbuild
- Retrofit
- Market Attractiveness Analysis: By Installation Type
- Global Marine Scrubber Systems Market Outlook: By System Type
- Introduction/Key Findings
- Historical Market Size (US$ Bn) and Volume (Units) Analysis by By System Type, 2020-2025
- Current Market Size (US$ Bn) and Volume (Units) Forecast, by By System Type, 2026-2033
- Packed Bed
- Vortex
- Bubble Tower
- Multi-stage
- Market Attractiveness Analysis: By System Type
- Global Marine Scrubber Systems Market Outlook: By End User
- Introduction/Key Findings
- Historical Market Size (US$ Bn) and Volume (Units) Analysis by By End User, 2020-2025
- Current Market Size (US$ Bn) and Volume (Units) Forecast, by By End User, 2026-2033
- Ship Owners
- Shipyards
- Marine Engineering Contractors
- Charterers
- Government / Defense
- Market Attractiveness Analysis: By End User
- Global Marine Scrubber Systems Market Outlook: Region
- Key Highlights
- Historical Market Size (US$ Bn) and Volume (Units) Analysis by Region, 2020-2025
- Current Market Size (US$ Bn) and Volume (Units) Forecast, by Region, 2026-2033
- North America
- Europe
- East Asia
- South Asia & Oceania
- Latin America
- Middle East & Africa
- Market Attractiveness Analysis: Region
- North America Marine Scrubber Systems Market Outlook: Historical (2020 - 2025) and Forecast (2026 - 2033)
- Key Highlights
- Pricing Analysis
- North America Market Size (US$ Bn) and Volume (Units) Forecast, by Country, 2026-2033
- U.S.
- Canada
- North America Market Size (US$ Bn) and Volume (Units) Forecast, by By Scrubber Type, 2026-2033
- Open Loop
- Closed Loop
- Hybrid
- North America Market Size (US$ Bn) and Volume (Units) Forecast, by By Installation Type, 2026-2033
- Newbuild
- Retrofit
- North America Market Size (US$ Bn) and Volume (Units) Forecast, by By System Type, 2026-2033
- Packed Bed
- Vortex
- Bubble Tower
- Multi-stage
- North America Market Size (US$ Bn) and Volume (Units) Forecast, by By End User, 2026-2033
- Ship Owners
- Shipyards
- Marine Engineering Contractors
- Charterers
- Government / Defense
- Europe Marine Scrubber Systems Market Outlook: Historical (2020 - 2025) and Forecast (2026 - 2033)
- Key Highlights
- Pricing Analysis
- Europe Market Size (US$ Bn) and Volume (Units) Forecast, by Country, 2026-2033
- Germany
- Italy
- France
- U.K.
- Spain
- Russia
- Rest of Europe
- Europe Market Size (US$ Bn) and Volume (Units) Forecast, by By Scrubber Type, 2026-2033
- Open Loop
- Closed Loop
- Hybrid
- Europe Market Size (US$ Bn) and Volume (Units) Forecast, by By Installation Type, 2026-2033
- Newbuild
- Retrofit
- Europe Market Size (US$ Bn) and Volume (Units) Forecast, by By System Type, 2026-2033
- Packed Bed
- Vortex
- Bubble Tower
- Multi-stage
- Europe Market Size (US$ Bn) and Volume (Units) Forecast, by By End User, 2026-2033
- Ship Owners
- Shipyards
- Marine Engineering Contractors
- Charterers
- Government / Defense
- East Asia Marine Scrubber Systems Market Outlook: Historical (2020 - 2025) and Forecast (2026 - 2033)
- Key Highlights
- Pricing Analysis
- East Asia Market Size (US$ Bn) and Volume (Units) Forecast, by Country, 2026-2033
- China
- Japan
- South Korea
- East Asia Market Size (US$ Bn) and Volume (Units) Forecast, by By Scrubber Type, 2026-2033
- Open Loop
- Closed Loop
- Hybrid
- East Asia Market Size (US$ Bn) and Volume (Units) Forecast, by By Installation Type, 2026-2033
- Newbuild
- Retrofit
- East Asia Market Size (US$ Bn) and Volume (Units) Forecast, by By System Type, 2026-2033
- Packed Bed
- Vortex
- Bubble Tower
- Multi-stage
- East Asia Market Size (US$ Bn) and Volume (Units) Forecast, by By End User, 2026-2033
- Ship Owners
- Shipyards
- Marine Engineering Contractors
- Charterers
- Government / Defense
- South Asia & Oceania Marine Scrubber Systems Market Outlook: Historical (2020 - 2025) and Forecast (2026 - 2033)
- Key Highlights
- Pricing Analysis
- South Asia & Oceania Market Size (US$ Bn) and Volume (Units) Forecast, by Country, 2026-2033
- India
- Southeast Asia
- ANZ
- Rest of SAO
- South Asia & Oceania Market Size (US$ Bn) and Volume (Units) Forecast, by By Scrubber Type, 2026-2033
- Open Loop
- Closed Loop
- Hybrid
- South Asia & Oceania Market Size (US$ Bn) and Volume (Units) Forecast, by By Installation Type, 2026-2033
- Newbuild
- Retrofit
- South Asia & Oceania Market Size (US$ Bn) and Volume (Units) Forecast, by By System Type, 2026-2033
- Packed Bed
- Vortex
- Bubble Tower
- Multi-stage
- South Asia & Oceania Market Size (US$ Bn) and Volume (Units) Forecast, by By End User, 2026-2033
- Ship Owners
- Shipyards
- Marine Engineering Contractors
- Charterers
- Government / Defense
- Latin America Marine Scrubber Systems Market Outlook: Historical (2020 - 2025) and Forecast (2026 - 2033)
- Key Highlights
- Pricing Analysis
- Latin America Market Size (US$ Bn) and Volume (Units) Forecast, by Country, 2026-2033
- Brazil
- Mexico
- Rest of LATAM
- Latin America Market Size (US$ Bn) and Volume (Units) Forecast, by By Scrubber Type, 2026-2033
- Open Loop
- Closed Loop
- Hybrid
- Latin America Market Size (US$ Bn) and Volume (Units) Forecast, by By Installation Type, 2026-2033
- Newbuild
- Retrofit
- Latin America Market Size (US$ Bn) and Volume (Units) Forecast, by By System Type, 2026-2033
- Packed Bed
- Vortex
- Bubble Tower
- Multi-stage
- Latin America Market Size (US$ Bn) and Volume (Units) Forecast, by By End User, 2026-2033
- Ship Owners
- Shipyards
- Marine Engineering Contractors
- Charterers
- Government / Defense
- Middle East & Africa Marine Scrubber Systems Market Outlook: Historical (2020 - 2025) and Forecast (2026 - 2033)
- Key Highlights
- Pricing Analysis
- Middle East & Africa Market Size (US$ Bn) and Volume (Units) Forecast, by Country, 2026-2033
- GCC Countries
- South Africa
- Northern Africa
- Rest of MEA
- Middle East & Africa Market Size (US$ Bn) and Volume (Units) Forecast, by By Scrubber Type, 2026-2033
- Open Loop
- Closed Loop
- Hybrid
- Middle East & Africa Market Size (US$ Bn) and Volume (Units) Forecast, by By Installation Type, 2026-2033
- Newbuild
- Retrofit
- Middle East & Africa Market Size (US$ Bn) and Volume (Units) Forecast, by By System Type, 2026-2033
- Packed Bed
- Vortex
- Bubble Tower
- Multi-stage
- Middle East & Africa Market Size (US$ Bn) and Volume (Units) Forecast, by By End User, 2026-2033
- Ship Owners
- Shipyards
- Marine Engineering Contractors
- Charterers
- Government / Defense
- Competition Landscape
- Market Share Analysis, 2025
- Market Structure
- Competition Intensity Mapping
- Competition Dashboard
- Company Profiles
- Alfa Laval AB
- Company Overview
- Product Portfolio/Offerings
- Key Financials
- SWOT Analysis
- Company Strategy and Key Developments
- Wärtsilä Oyj Abp
- Yara Marine Technologies As
- VDL AEC Maritime
- Feen Marine Scrubbers Inc.
- CR Ocean Engineering, LLC
- E. I. du Pont de Nemours and Company
- Mitsubishi Heavy Industries, Ltd.
- Hyundai Heavy Industries
- Kwangsung Co.,Ltd
- Shanghai Bluesoul Environmental Technology Co.,Ltd.
- Pacific Green Marine Technologies Inc.
- Primarine GmbH
- Ecospray Technologies
- PANASIA CO., LTD.
- Alfa Laval AB
- Appendix
- Research Methodology
- Research Assumptions
- Acronyms and Abbreviations


- Oil & Gas
- Marine Scrubber Systems Market
Marine Scrubber Systems Market Size, Share, and Growth Forecast 2026 - 2033
Marine Scrubber Systems Market by Scrubber Type (Open Loop, Closed Loop, Hybrid), by System Type (Packed Bed, Vortex, Bubble Tower, Multi-stage), Installation Type (Newbuild, Retrofit), End-user (Ship Owners, Shipyards, Marine Engineering Contractors, Charterers, Government), Regional Analysis, 2026 - 2033
Marine Scrubber Systems Market Size and Trend Analysis
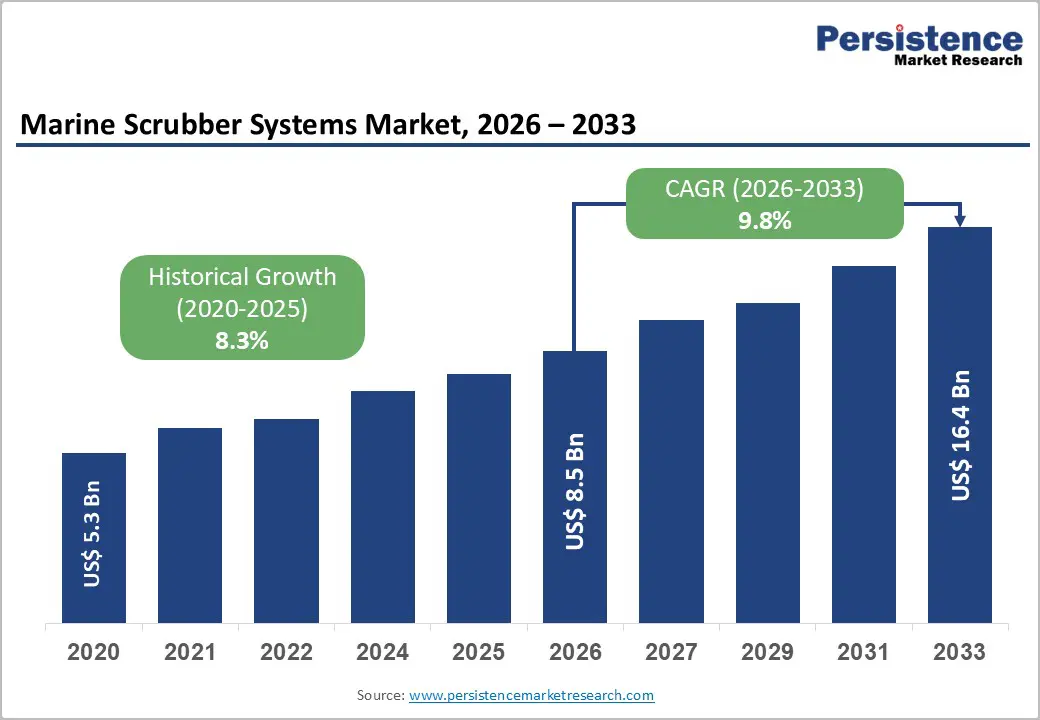
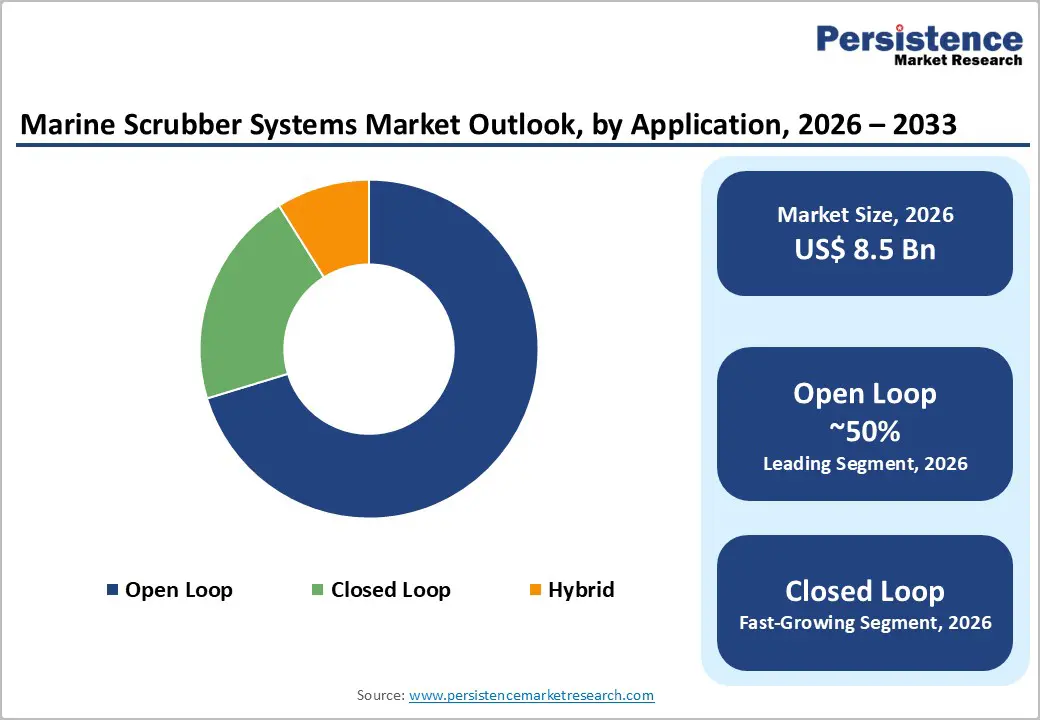
The global marine scrubber systems market is projected to reach US$ 8.5 billion in 2026 and US$ 16.4 billion by 2033, growing at a CAGR of 9.8% over the forecast period.
Market expansion is driven by IMO 2020 sulfur regulations, tightening global emission standards, and strong economic benefits, as scrubbers enable regulatory compliance while delivering significant fuel cost savings with rapid 2-3-year payback periods.
Key Market Highlights
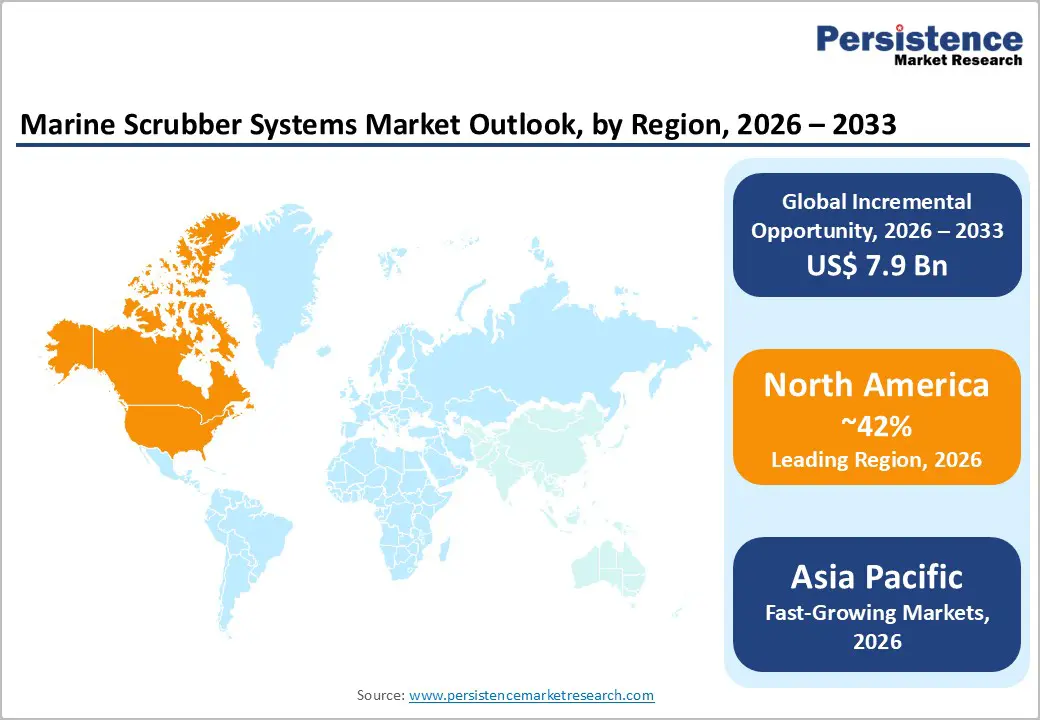
- Leading Region: North America maintains a significant market share of 42%, supported by stringent EPA standards, port-level emission requirements, and mature maritime infrastructure, with regulatory compliance frameworks compelling advanced scrubber system adoption across commercial shipping fleets operating in North American waters.
- Fastest-Growing Region: Asia Pacific is the fastest-growing region, with a 25% market share, driven by 1,200+ scrubber installations by 2025, up from 300 in 2019, exceptional shipping industry growth, and rapid implementation of environmental regulations across rapidly industrializing maritime economies.
- Leading Segment: Open-loop systems command 71% of installed scrubber base, driven by lower capital investment, simplified design, minimal operational complexity, and cost-effectiveness compared to closed-loop and hybrid alternatives.
- Fastest-Growing Segment: Dry scrubber systems experience fastest technology growth at 22.6% CAGR, driven by advanced formulations enabling improved environmental performance and expanding applicability across diverse vessel types and operational requirements.
- Key opportunity: Retrofit installations command 45% market demand and accelerating adoption rates as aging vessel fleets require advanced emission control system integration to maintain regulatory compliance and competitive positioning across global maritime operations.
| Key Insights | Details |
|---|---|
| Marine Scrubber Systems Market Size (2026E) | US$ 8.5 Billion |
| Market Value Forecast (2033F) | US$ 16.4 Billion |
| Projected Growth CAGR (2026 - 2033) | 9.8% |
| Historical Market Growth (2020 - 2025) | 8.3% |
Market Dynamics
Drivers - Global Maritime Emission Regulations Accelerate Mandatory Adoption of Marine Scrubber Systems for Long-Term Environmental Compliance
Global maritime emission regulations are becoming increasingly strict, forcing shipping companies to adopt reliable emission control technologies such as marine scrubber systems. International regulations under IMO MARPOL Annex VI place firm limits on sulfur oxide (SOx) and nitrogen oxide (NOx) emissions from vessels. The implementation of the 2020 global sulfur cap, which reduced allowable sulfur content in marine fuels from 3.5% to 0.5%, significantly increased compliance pressure across the shipping industry. As a result, scrubber systems have emerged as a practical and cost-efficient compliance solution.
In addition, several ports across Europe, Asia Pacific, and North America have introduced restrictions on open-loop scrubber discharge, encouraging a shift toward closed-loop and hybrid systems. Governments and regulatory bodies continue expanding emission control requirements under international climate and air-quality agreements. This steady regulatory expansion creates long-term, predictable demand for scrubber systems, supporting sustained market growth regardless of short-term economic fluctuations.
Fuel Cost Savings and Attractive Payback Periods Drive Strong Financial Case for Scrubber Investments Across Commercial Fleets
Strong economic benefits play a major role in accelerating scrubber system adoption across commercial shipping fleets. By installing scrubbers, vessel operators can continue using lower-cost high-sulfur fuel oil (HFO) while remaining compliant with environmental regulations. The price gap between HFO and compliant fuels such as marine gas oil (MGO) and very low-sulfur fuel oil (VLSFO) remains significant, allowing many operators to recover scrubber installation costs within an estimated 2-3 years.
This rapid payback period makes scrubber investments financially appealing, particularly for vessels with high fuel consumption. Large vessel categories such as bulk carriers, container ships, and tankers benefit most due to their intensive operating cycles. Growing adoption levels highlight this financial logic, with Asia Pacific installations increasing from around 300 units in 2019 to nearly 1,200 systems by 2025. These trends confirm rising confidence in scrubber economics and long-term operational savings.
Restraints - Increasing Environmental Concerns and Port-Level Discharge Restrictions Create Regulatory Uncertainty for Long-Term Scrubber Deployment
Rising environmental concerns surrounding scrubber wastewater discharge are creating uncertainty within the marine scrubber market. Open-loop scrubber systems release treated wash water back into the sea, which has raised concerns among environmental groups and regulators. Several ports and coastal regions, particularly in Europe, have already implemented restrictions or complete bans on open-loop scrubber discharges. Globally, open-loop systems are estimated to discharge nearly 10 billion cubic meters of wash water annually, intensifying environmental scrutiny.
As environmental monitoring becomes more advanced, regulators are paying closer attention to potential long-term effects on marine ecosystems. This evolving regulatory environment creates compliance complexity for shipping operators, especially those operating globally across multiple jurisdictions. The possibility of further restrictions or expanded bans increases uncertainty around the long-term viability of existing scrubber installations, which may discourage new investments and reduce confidence in scrubber technology as a permanent compliance solution.
High Capital Costs and Retrofit Complexity Limit Adoption among Smaller and Cost-Sensitive Shipping Operators
High upfront investment remains a significant barrier to wider scrubber system adoption, particularly for small and mid-sized shipping operators. Advanced closed-loop and hybrid scrubber systems require complex onboard water treatment units, chemical handling systems, and additional storage capacity, increasing total installation costs. Retrofitting existing vessels is especially challenging, as it involves detailed engineering assessments, structural modifications, and compatibility checks with existing engines and ship layouts.
These projects often result in extended vessel downtime, leading to revenue loss for operators. In addition, retrofit installations demand specialized labor and technical expertise, further increasing project costs. Beyond capital expenditure, operators must also manage ongoing operating expenses such as chemicals, sludge disposal, energy consumption, and routine maintenance. For vessels with lower fuel usage or limited operating routes, these additional costs can extend payback periods, reducing overall investment attractiveness and slowing market adoption.
Opportunities - Advancement of Green Shipping Technologies and Sustainability Regulations Creates New Growth Pathways for Next-Generation Scrubber Systems
The global push toward sustainable and low-emission shipping presents strong growth opportunities for advanced scrubber technologies. Governments and international maritime organizations are increasingly targeting net-zero emissions by 2050, encouraging the adoption of cleaner maritime solutions. Next-generation scrubber systems now incorporate artificial intelligence, automated controls, and real-time monitoring to improve efficiency and reduce operational complexity. These innovations appeal to shipping companies aiming to strengthen ESG performance while maintaining regulatory compliance.
Dry scrubber technology, currently witnessing the fastest growth rate of approximately 22.6% CAGR, represents a major opportunity as technological improvements overcome earlier limitations. Additionally, integration of scrubber systems with alternative fuel strategies such as methanol, ammonia, and biofuels enhances long-term relevance. Manufacturers offering environmentally advanced, future-ready systems are well-positioned to capture premium market segments driven by sustainability commitments and evolving regulatory expectations across global shipping markets.
Rising Demand for Fleet Modernization and Retrofit Installations Expands Market Opportunities across Aging Global Vessel Fleets
The global shipping fleet includes a large number of aging vessels that require modernization to remain compliant and competitive. This creates a strong opportunity for scrubber retrofit installations, particularly in North America, Europe, and Asia Pacific. Rather than replacing vessels, operators increasingly prefer cost-effective retrofitting solutions that extend asset life while meeting emission regulations. Retrofit scrubber systems are now designed to accommodate diverse vessel sizes, layouts, and operational profiles, reducing the need for major structural reconstruction.
As shipping companies aim to maximize vessel lifespan, planned modernization programs are becoming common, generating long-term demand for retrofit services. Specialized marine engineering contractors and system integrators benefit from this trend through recurring installation and maintenance projects. Emerging shipping regions such as Southeast Asia, the Middle East, and Latin America also present growing retrofit potential, supported by fleet expansion, regulatory enforcement, and improved access to financing solutions.
Category-wise Analysis
Scrubber Type Insights
Open-loop scrubber systems currently dominate the installed base, accounting for approximately 71% of total installations worldwide. Their popularity is largely driven by lower capital costs, simple system design, and ease of operation. These systems utilize seawater as the scrubbing medium, eliminating the need for onboard chemicals and complex waste storage systems. This simplicity supports faster installation and reduced operational burden across various vessel types. Open-loop systems are particularly attractive to cost-sensitive operators and vessels with limited onboard space.
However, increasing environmental concerns and expanding port-level discharge bans are restricting their future growth. As regulatory pressure intensifies, operators are gradually shifting toward hybrid and closed-loop systems that offer greater environmental flexibility. This transition reflects the market’s gradual movement toward compliance-ready solutions capable of operating across both regulated and unrestricted waters.
System Type Insights
Packed bed scrubber systems represent the most widely adopted and proven technology within the market. They offer stable performance, reliable emission reduction, and cost-efficient operation across multiple vessel categories. Vortex scrubber systems provide higher efficiency while requiring less installation space, making them suitable for space-constrained vessels and retrofit projects. Bubble tower systems offer an alternative configuration focused on simplified operation and easier maintenance. Multi-stage scrubber systems represent advanced solutions that incorporate multiple treatment phases to achieve superior pollutant removal.
These systems are typically selected by operators prioritizing maximum environmental performance and long-term regulatory compliance. Although multi-stage systems command premium pricing, they attract customers seeking future-ready solutions capable of meeting stricter emission standards. Overall, system selection depends heavily on vessel type, operating routes, regulatory exposure, and available installation space.
Installation Type Insights
Newbuild installations account for approximately 60% of total scrubber system demand, supported by ongoing commercial vessel construction worldwide. Modern shipbuilding practices allow scrubbers to be integrated during the design phase, resulting in optimized layout, improved efficiency, and lower installation costs. Shipbuilders increasingly include scrubber systems as standard equipment on bulk carriers, container ships, and tankers. Retrofit installations represent around 45% of market demand and continue to grow steadily.
As existing vessels must comply with emission regulations, retrofit scrubbers offer a cost-effective alternative to fleet replacement. Advances in modular system design and installation techniques have improved retrofit feasibility. With a large portion of the global fleet already in operation, retrofit demand is expected to remain strong, supporting long-term growth for engineering contractors and technology providers.
End-user Insights
Ship owners remain the primary decision-makers in marine scrubber procurement, focusing on regulatory compliance, fuel cost optimization, and return on investment. Shipyards play a critical role as integration partners, particularly for newbuild vessels where system installation can be optimized during construction. Marine engineering contractors provide specialized expertise for retrofit installations, often managing complex technical and structural modifications. Charterers are increasingly influencing technology decisions by imposing ESG requirements and emission performance standards on leased vessels. Government and defense organizations also represent important end-users, installing scrubber systems on naval and coast guard fleets as part of environmental compliance and sustainability initiatives. Together, these stakeholders shape purchasing decisions and technology preferences across the marine scrubber value chain.
Regional Insights
North America Marine Scrubber Systems Trends
North America holds a strong position in the marine scrubber systems market due to its mature maritime infrastructure and strict environmental regulations. U.S. Environmental Protection Agency (EPA) standards and regional port emission requirements create strong compliance pressure for commercial vessels operating in North American waters. Major ports such as New York, Los Angeles, San Francisco, and Houston enforce emission standards that encourage the adoption of advanced scrubber systems.
The region also benefits from well-developed shipyard capabilities supporting both newbuild integration and complex retrofit projects. North America’s leadership in environmental regulation fosters early adoption of advanced technologies and supports innovation. This regulatory clarity and infrastructure strength create favorable conditions for premium scrubber solutions focused on efficiency, monitoring, and long-term compliance reliability.
Europe Marine Scrubber Systems Trends
Europe places strong emphasis on environmental protection and maritime emission reduction. European Union regulations and regional maritime directives mandate strict compliance across commercial shipping fleets. Several European ports have implemented discharge restrictions, accelerating demand for closed-loop and hybrid scrubber systems. Countries such as Germany, the United Kingdom, France, Spain, and Scandinavian nations are at the forefront of enforcement.
Europe also benefits from strong collaboration between manufacturers, research institutions, and shipyards, driving continuous technology development. Major shipping hubs, including Rotterdam, Hamburg, and Antwerp, create concentrated demand supported by advanced aftermarket services and retrofit expertise. This mature ecosystem strengthens Europe’s position as a key market for high-performance and environmentally advanced scrubber systems.
Asia Pacific Marine Scrubber Systems Trends
Asia Pacific is the largest and fastest-growing regional market, accounting for approximately 25% of global demand. Growth is driven by expanding maritime trade, large-scale port development, and increasing environmental regulation across the region. China leads the market due to its dominant shipbuilding industry, extensive port network, and massive commercial fleet. Rapid industrialization and export-driven trade continue to support fleet expansion and modernization. Installation growth is significant, with scrubber installations rising from around 300 units in 2019 to nearly 1,200 systems by 2025. Countries such as Japan, South Korea, India, and Singapore contribute through advanced manufacturing capabilities and technological expertise. Asia Pacific’s scale, production capacity, and trade intensity make it a central hub for global scrubber system demand.
Competitive Landscape
The global marine scrubber systems market shows moderate consolidation, with a mix of global leaders and regional specialists. Major players such as Alfa Laval AB, Wärtsilä Oyj Abp, Yara Marine Technologies, and Mitsubishi Heavy Industries together account for approximately 50% of global market share. These companies benefit from broad product portfolios, long-standing shipyard relationships, and strong technical credibility.
Competitive strategies focus heavily on research and development aimed at improving efficiency, automation, and environmental performance. Reliability, operational simplicity, and regulatory compliance assurance remain key differentiators. Manufacturers also collaborate closely with shipbuilders and engineering firms to deliver customized solutions for different vessel types. This combination of technology leadership and strategic partnerships continues to define competitive positioning within the global marine scrubber systems market.
Key Developments:
- In November 2024: Wärtsilä introduced an IoT-enabled marine scrubber platform with real-time monitoring, predictive maintenance, and cloud connectivity, helping ship operators improve performance, reduce downtime, and make data-driven decisions for more efficient emissions control systems.
- In August 2024: Alfa Laval significantly expanded its scrubber retrofit engineering and installation services throughout Southeast and East Asia to support growing fleet modernization demand and increase scrubber adoption among emerging market shipping operators.
- In May 2024: Yara Marine Technologies advanced dry scrubber solutions with enhanced catalytic media and improved system efficiency, accelerating the shift toward higher environmental performance and simplified operation in maritime emission control.
Companies Covered in Marine Scrubber Systems Market
- Alfa Laval AB
- Wärtsilä Oyj Abp
- Yara Marine Technologies AS
- VDL AEC Maritime
- Feen Marine Scrubbers Inc.
- CR Ocean Engineering LLC
- DuPont
- Mitsubishi Heavy Industries Ltd.
- Hyundai Heavy Industries
- Kwangsung Co. Ltd.
- Shanghai Bluesoul Environmental Technology Co. Ltd.
- Pacific Green Marine Technologies Inc.
- Primarine GmbH
- Ecospray Technologies
- PANASIA Co. Ltd.
- ANDRITZ AG
- Langh Tech Oy Ab
- SAACKE GmbH
Frequently Asked Questions
The global marine scrubber systems market is projected to reach US$ 16.4 billion by 2033, growing at 9.8% CAGR driven by IMO compliance, emission regulations, and fuel cost optimization benefits.
Demand is driven by IMO 2020 sulfur regulations, strong fuel cost savings with 2-3 year payback periods, and increasing port-level environmental compliance requirements.
Open-loop scrubber systems dominate the market with around 71% installed base, supported by lower costs and simpler operation, despite rising adoption of hybrid and closed-loop systems.
Asia Pacific leads the global market with 40-45% share, driven by rapid shipping growth, large-scale installations, and strengthening environmental regulations.
Major opportunities include green shipping technology innovation, AI-enabled scrubbers, fast-growing dry scrubber systems, and expanding retrofit demand from aging global fleets.
Key players include Alfa Laval, Wärtsilä, Yara Marine Technologies, Mitsubishi Heavy Industries, and Hyundai Heavy Industries, supported by strong technology portfolios and shipyard partnerships.


